You are not logged in.
This means you
CAN ONLY VIEW reports that were published prior to Monday, April 14, 2025.
You
MUST UPGRADE YOUR MEMBERSHIP if you want to see any current reports.
AFTER MARKET UPDATE - TUESDAY, OCTOBER 20TH, 2009
Previous After Market Report Next After Market Report >>>
|
|
|
|
DOW |
-50.71 |
10,041.48 |
-0.50% |
|
Volume |
1,236,575,100 |
+14% |
|
Volume |
2,161,087,430 |
+8% |
|
NASDAQ |
-12.85 |
2,163.47 |
-0.59% |
|
Advancers |
1,044 |
33% |
|
Advancers |
745 |
26% |
|
S&P 500 |
-6.85 |
1,091.06 |
-0.62% |
|
Decliners |
1,998 |
64% |
|
Decliners |
1,989 |
70% |
|
Russell 2000 |
-8.93 |
613.41 |
-1.43% |
|
52 Wk Highs |
243 |
|
|
52 Wk Highs |
104 |
|
|
S&P 600 |
-4.34 |
324.32 |
-1.32% |
|
52 Wk Lows |
4 |
|
|
52 Wk Lows |
12 |
|
|
 |
Averages End Lower With Higher Volume Indicative Of Distribution
Adam Sarhan, Contributing Writer,
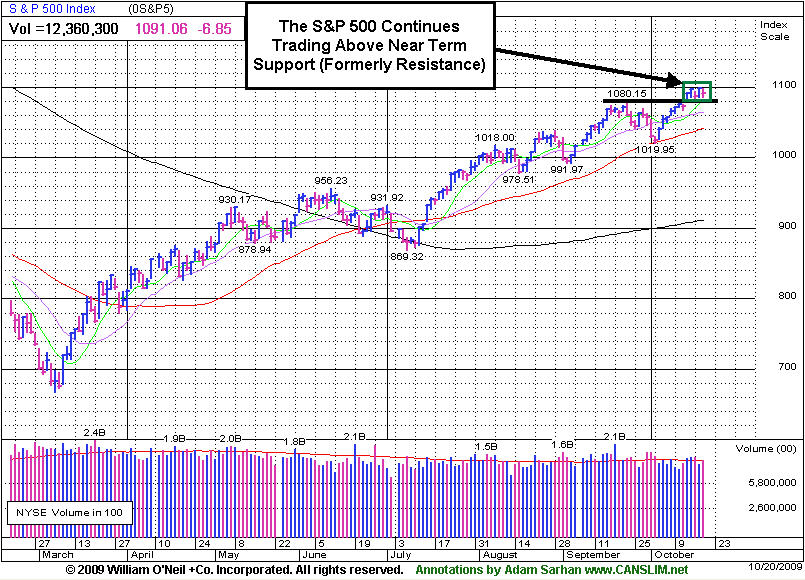
The major averages suffered a distribution day as the US dollar advanced. Volume was heavier than the prior session on the NYSE and on the Nasdaq exchange, which was not a welcome sign since the major averages slid. Decliners led advancers by about a 2-to-1 ratio on the NYSE and by nearly a 3-to-1 ratio on the Nasdaq exchange. There were 39 high-ranked companies from the CANSLIM.net Leaders List, making a new 52-week high and appearing on the CANSLIM.net BreakOuts Page, down from the 50 issues that appeared on the prior session. New 52-week highs substantially outnumbered new 52-week lows on both major exchanges.
The US dollar rallied which sent a slew of stocks and commodities lower. The dollar rebounded from a 14-month low against the euro after a disappointing report from the housing market was released. The Commerce Department released a report which showed housing starts rose +0.5% in September to an annual rate of 590,000 and lowered August's reading. This fell short of the Street's estimate for a rate of 610,000. Permits, a sign of future construction, fell for the second time in the past three months which signaled the housing recovery is still questionable. The Labor Department released its Producer Price Index (PPI) which fell -0.6%. Bloomberg.com defines the PPI as "index that measures the average price level for a fixed basket of capital and consumer goods received by producers." This was the second decline in three months and followed a +1.7% rise in August. Core PPI which excludes food and energy slid -0.1%.
Companies continue reporting Q3 results in droves as more than 130 companies in the S&P 500 are scheduled to report their results this week! So far, earnings have topped analysts’ estimates for +79% of the companies that released results, according to Bloomberg.com. Last quarter, more than +72% exceeded the average estimate which matched the highest reading going back to 1993. It is important to note that even though earnings are likely to exceed estimates again this quarter, they are still down and barring some unforeseen event, this will be the ninth straight quarter of declining profits which is the longest streak since the Great Depression.
PICTURED: The S&P 500 Index closed above near-term support (former resistance).
|
|
|
 |
Healthcare Group A Standout Gainer, Meanwhile Biotech Index Lags
Kenneth J. Gruneisen - Passed the CAN SLIM® Master's Exam
The Healthcare Index ($HMO +1.00%) was one defensive group on the rise Tuesday. However, the Gold & Silver Index ($XAU -2.15%) slumped and the Oil Services Index ($OSX -1.59%) and Integrated Oil Index ($XOI -0.65%) lost ground. Weakness in the Retail Index ($RLX -1.66%) and financial shares created a drag on the major indices while the Broker/Dealer Index ($XBD -1.39%) and Bank Index ($BKX -0.45%) sank. The Biotechnology Index ($BTK -2.91%) was a laggard among the tech sector indices, followed by smaller losses for the Internet Index ($IIX -0.70%), Networking Index ($NWX -0.65%), and Semiconductor Index ($SOX -0.23%).
Charts courtesy www.stockcharts.com
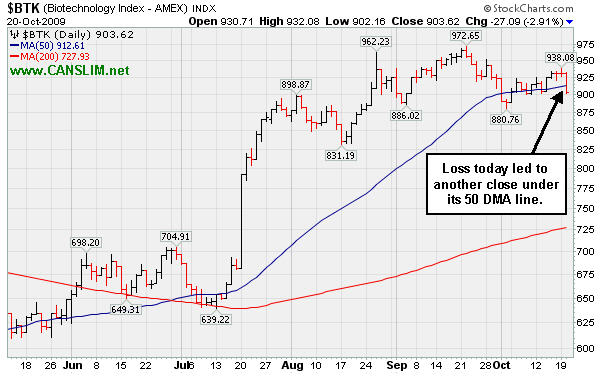
PICTURED: The Biotechnology Index's ($BTK -2.91%) loss today led to another close under its 50-day moving average (DMA) line.
| Oil Services |
$OSX |
207.90 |
-3.35 |
-1.59% |
+71.27% |
| Healthcare |
$HMO |
1,157.71 |
+11.49 |
+1.00% |
+20.57% |
| Integrated Oil |
$XOI |
1,109.49 |
-7.26 |
-0.65% |
+13.25% |
| Semiconductor |
$SOX |
326.87 |
-0.74 |
-0.23% |
+54.06% |
| Networking |
$NWX |
240.68 |
-1.58 |
-0.65% |
+67.27% |
| Internet |
$IIX |
222.61 |
-1.56 |
-0.70% |
+66.41% |
| Broker/Dealer |
$XBD |
122.90 |
-1.73 |
-1.39% |
+58.64% |
| Retail |
$RLX |
390.86 |
-6.59 |
-1.66% |
+39.96% |
| Gold & Silver |
$XAU |
174.23 |
-3.82 |
-2.15% |
+40.68% |
| Bank |
$BKX |
46.84 |
-0.21 |
-0.45% |
+5.69% |
| Biotech |
$BTK |
903.62 |
-27.09 |
-2.91% |
+39.63% |
|
|
|
 |
Sell-Off On Earnings News Pressures Firm To Close Below 50-Day Line
Kenneth J. Gruneisen - Passed the CAN SLIM® Master's Exam
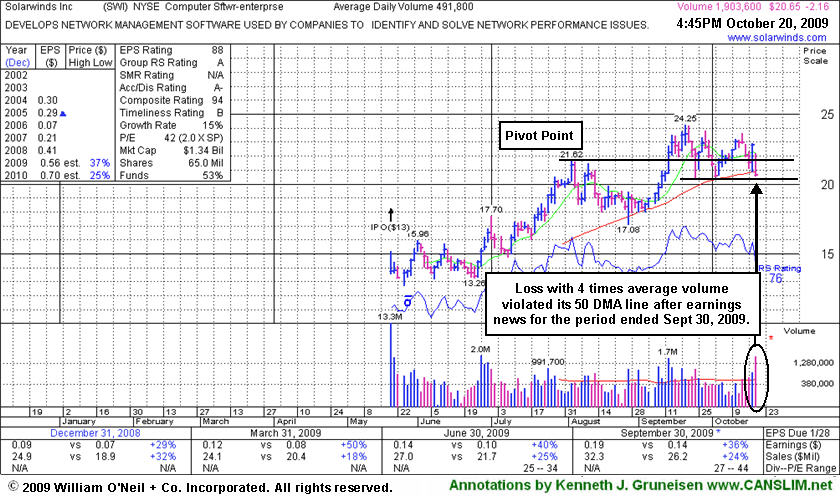
SolarWinds, Inc. (SWI -$2.11 or -9.25% or $20.70) gapped down today after reporting earnings results for the quarterly period ended Sept 30, 2009. It slumped under its old pivot point again and violated its 50 DMA line, raising concerns while closing near the session low with a considerable loss on nearly 4 times average volume. Failure to find prompt support near its short-term average and near recent chart lows in the $20.50 area would raise more serious concerns, meanwhile any further weakness could trigger a more definitive technical sell signal. This high-ranked Computer Software - Enterprise firm has had a difficult time producing gains backed by above average volume since it was recently featured in the October 2009 issue of CANSLIM.net News (read here).
|
|
|
Color Codes Explained :
Y - Better candidates highlighted by our
staff of experts.
G - Previously featured
in past reports as yellow but may no longer be buyable under the
guidelines.
***Last / Change / Volume quote data in this table corresponds with the timestamp on the note***
Symbol/Exchange
Company Name
Industry Group |
Last |
Chg. |
Vol
% DAV |
Date Featured |
Price Featured |
Latest Pivot Point
Featured |
Status |
| Latest Max Buy Price |
ARO
- NYSE
Aeropostale Inc
RETAIL - Apparel Stores
|
$41.56
|
-0.45
|
1,402,380
54% DAV
2,588,600
|
8/21/2009
(Date
Featured) |
$39.21
(Price
Featured) |
PP = $38.84 |
Y |
| MB = $40.78 |
Most Recent Note - 10/20/2009 4:07:07 PM
Y - Holding its ground quietly after distributional pressure last week pressured it near important support at its 50 DMA line. This high-ranked leader in the Retail - Clothing/shoe group's color code was changed to yellow again on 10/09/09, with a note that it is "permissible under the guidelines to accumulate shares from the first successful test of support at its short-term average line up to as much as 5% above its latest chart highs." However, a 50 DMA line violation could raise concerns and trigger a technical sell signal. The next key chart support level is prior highs in the $38 area. It was featured in yellow in the 8/21/09 Mid-Day BreakOuts Report (read here).
>>> The latest Featured Stock Update with an annotated graph appeared on 10/6/2009. click here.
|
|
C
A
S
I |
News |
Chart |
SEC
View all notes Alert
me of new notes
Company
Profile
|
ARST
-
|
$24.78
|
-0.39
|
322,080
49% DAV
661,500
|
9/1/2009
(Date
Featured) |
$19.91
(Price
Featured) |
PP = $20.90 |
G |
| MB = $21.95 |
Most Recent Note - 10/20/2009 4:08:00 PM
G - Quietly consolidating after rallying to new all-time highs last week with multiple gains on above average volume. On 10/14/09 its considerable gain backed by more than 2 times average volume helped it rally from a short "base-on-base" type pattern. ARST was first featured in yellow at $19.91 in the 9/01/09 mid-day report with an annotated daily graph (read here). As previously noted, "Recent lows may be considered an initial support level. Prior chart highs and its 50 DMA line, coinciding in the $20 area, define an important technical support level to watch on pullbacks."
>>> The latest Featured Stock Update with an annotated graph appeared on 10/2/2009. click here.
|
|
C
A
S
I |
News |
Chart |
SEC
View all notes Alert
me of new notes
Company
Profile
|
ASIA
-
|
$23.27
|
-0.32
|
1,008,215
131% DAV
768,100
|
10/14/2009
(Date
Featured) |
$23.05
(Price
Featured) |
PP = $22.19 |
Y |
| MB = $23.30 |
Most Recent Note - 10/20/2009 4:09:05 PM
Y - Gapped up today and hit a new high, then negatively reversed and dipped under its "max buy" level. Its color code was changed to yellow again, and prior chart highs in the $21-22 area are important support to watch on pullbacks. A gap up and considerable breakout gain with 5 times average volume triggered a technical buy signal on 10/14/09. It was highlighted in yellow in the 10/14/09 mid-day report (read here) as it blasted to a new 52-week high above its long-ago noted pivot point when featured in the August 2009 CANSLIM.net News (read here).
>>> The latest Featured Stock Update with an annotated graph appeared on 10/14/2009. click here.
|
|
C
A
S
I |
News |
Chart |
SEC
View all notes Alert
me of new notes
Company
Profile
|
BIDU
- NASDAQ
Baidu Inc Ads
INTERNET - Internet Information Providers
|
$408.72
|
-2.30
|
1,897,020
105% DAV
1,810,600
|
9/8/2009
(Date
Featured) |
$351.80
(Price
Featured) |
PP = $368.59 |
G |
| MB = $387.02 |
Most Recent Note - 10/20/2009 4:13:51 PM
G - Consolidating in the $400 area after recent gains challenged its 2007 all-time high of $429. It is extended from a proper buy point under the investment system guidelines. BIDU was featured in yellow in the 9/08/09 Mid-Day BreakOuts Report (read here).
>>> The latest Featured Stock Update with an annotated graph appeared on 10/7/2009. click here.
|
|
C
A
S
I |
News |
Chart |
SEC
View all notes Alert
me of new notes
Company
Profile
|
CACC
- NASDAQ
Credit Acceptance Corp
FINANCIAL SERVICES - Credit Services
|
$36.22
|
-0.54
|
15,935
36% DAV
43,800
|
9/29/2009
(Date
Featured) |
$33.48
(Price
Featured) |
PP = $32.60 |
G |
| MB = $34.23 |
Most Recent Note - 10/20/2009 4:20:10 PM
G - Quietly and stubbornly holding its ground, extended from a sound base. Prior chart highs in the $32 area are important support to watch on pullbacks. The Finance - Consumer/Commercial Loans firm has maintained a great track record of annual and quarterly sales revenues and earnings increases. It was featured on 9/29/09 in yellow in the mid-day report (read here).
>>> The latest Featured Stock Update with an annotated graph appeared on 10/15/2009. click here.
|
|
C
A
S
I |
News |
Chart |
SEC
View all notes Alert
me of new notes
Company
Profile
|
CRM
- NYSE
Salesforce.com Inc
INTERNET - Internet Software & Services
|
$62.15
|
-0.72
|
941,990
45% DAV
2,107,500
|
8/16/2009
(Date
Featured) |
$47.12
(Price
Featured) |
PP = $45.59 |
G |
| MB = $47.87 |
Most Recent Note - 10/20/2009 4:23:34 PM
G - Quietly perched at 2009 highs, stubbornly holding its recent gains while extended from any sound base. Technical support to watch now is prior chart highs in the $59 area which coincide with an upward trendline connecting its July, August and October chart lows, both just above additional support at its 50 DMA line.
>>> The latest Featured Stock Update with an annotated graph appeared on 10/5/2009. click here.
|
|
C
A
S
I |
News |
Chart |
SEC
View all notes Alert
me of new notes
Company
Profile
|
EBIX
- NASDAQ
Ebix Inc
COMPUTER SOFTWARE & SERVICES - Business Software & Services
|
$64.48
|
-0.43
|
190,633
96% DAV
199,300
|
8/28/2009
(Date
Featured) |
$45.86
(Price
Featured) |
PP = $45.35 |
G |
| MB = $47.62 |
Most Recent Note - 10/20/2009 4:26:14 PM
G - Stubbornly holding its ground after recent volume-driven gains to new all-time highs. It is very extended from any sound base, well above support at its 50 DMA line, and more than +103% above its 200 DMA line - all of which are reminders to be watchful for sell signals.
>>> The latest Featured Stock Update with an annotated graph appeared on 10/13/2009. click here.
|
|
C
A
S
I |
News |
Chart |
SEC
View all notes Alert
me of new notes
Company
Profile
|
GMCR
- NASDAQ
Green Mtn Coffee Roastrs
FOOD & BEVERAGE - Processed & Packaged Goods
|
$77.49
|
+1.49
|
1,748,030
136% DAV
1,283,100
|
10/5/2009
(Date
Featured) |
$71.11
(Price
Featured) |
PP = $75.89 |
Y |
| MB = $79.68 |
Most Recent Note - 10/20/2009 4:29:26 PM
Y - Hit another new 52-week high today with a gain backed by +36% above average volume. On 10/19/09 it rallied above is pivot point with +57% above average volume, barely meeting the minimum guideline needed to trigger a proper technical buy signal. Keep in mind this may be considered a 3rd or 4th stage base, and thus more failure prone, meanwhile its earlier breakouts were backed by far more impressive volume.
>>> The latest Featured Stock Update with an annotated graph appeared on 10/12/2009. click here.
|
|
C
A
S
I |
News |
Chart |
SEC
View all notes Alert
me of new notes
Company
Profile
|
PEGA
- NASDAQ
Pegasystems Inc
COMPUTER SOFTWARE & SERVICES - Business Software & Services
|
$34.30
|
-0.52
|
153,108
46% DAV
331,300
|
9/9/2009
(Date
Featured) |
$31.14
(Price
Featured) |
PP = $33.35 |
Y |
| MB = $35.02 |
Most Recent Note - 10/20/2009 4:32:37 PM
Y - Quietly hovering in a tight range, perched very near its all-time high. This high-ranked Computer Software - Financial firm found support near its 50 DMA line on recent pullbacks. Now that short-term average and its upward trendline are important technical support levels to watch.
>>> The latest Featured Stock Update with an annotated graph appeared on 10/8/2009. click here.
|
|
C
A
S
I |
News |
Chart |
SEC
View all notes Alert
me of new notes
Company
Profile
|
SWI
- NYSE
Solarwinds Inc
COMPUTER SOFTWARE & SERVICES - Application Software
|
$20.70
|
-2.11
|
1,920,157
396% DAV
485,100
|
9/30/2029
(Date
Featured) |
$22.03
(Price
Featured) |
PP = $21.72 |
Y |
| MB = $22.81 |
Most Recent Note - 10/20/2009 4:39:14 PM
Y - Gapped down today after reporting earnings and violated its 50 DMA line, raising concerns while closing near the session low with a considerable loss on nearly 4 times average volume. Failure to find prompt support near its short-term average and near recent chart lows in the $20.50 area would raise more serious concerns and further weakness could trigger a more definitive technical sell signal. This high-ranked Computer Software - Enterprise firm was featured in the October 2009 issue of CANSLIM.net News (read here).
>>> The latest Featured Stock Update with an annotated graph appeared on 10/20/2009. click here.
|
|
C
A
S
I |
News |
Chart |
SEC
View all notes Alert
me of new notes
Company
Profile
|
WNS
- NYSE
W N S Holdings Ltd Ads
DIVERSIFIED SERVICES - Business/Management Services
|
$16.85
|
-0.03
|
71,748
119% DAV
60,200
|
9/28/2009
(Date
Featured) |
$15.28
(Price
Featured) |
PP = $16.10 |
G |
| MB = $16.91 |
Most Recent Note - 10/20/2009 4:45:15 PM
G - Ended just below its "max buy" level today with a tiny loss. Its color code was changed to green after its recent streak of gains with above average triggered a technical buy signal while clearing stubborn $16 resistance. Recently found support at its 50 DMA line. Featured in yellow in the 9/28/09 mid-day report (read here). Quarterly earnings have been above the +25% guideline and its annual earnings history has been great, satisfying the C & A criteria. However, sales revenues growth has decelerated.
>>> The latest Featured Stock Update with an annotated graph appeared on 10/16/2009. click here.
|
|
C
A
S
I |
News |
Chart |
SEC
View all notes Alert
me of new notes
Company
Profile
|
|
|
|
THESE ARE NOT BUY RECOMMENDATIONS!
Comments contained in the body of this report are technical
opinions only. The material herein has been obtained
from sources believed to be reliable and accurate, however,
its accuracy and completeness cannot be guaranteed.
This site is not an investment advisor, hence it does
not endorse or recommend any securities or other investments.
Any recommendation contained in this report may not
be suitable for all investors and it is not to be deemed
an offer or solicitation on our part with respect to
the purchase or sale of any securities. All trademarks,
service marks and trade names appearing in this report
are the property of their respective owners, and are
likewise used for identification purposes only.
This report is a service available
only to active Paid Premium Members.
You may opt-out of receiving report notifications
at any time. Questions or comments may be submitted
by writing to Premium Membership Services 665 S.E. 10 Street, Suite 201 Deerfield Beach, FL 33441-5634 or by calling 1-800-965-8307
or 954-785-1121.
|
|
|


