You are not logged in.
This means you
CAN ONLY VIEW reports that were published prior to Tuesday, April 15, 2025.
You
MUST UPGRADE YOUR MEMBERSHIP if you want to see any current reports.
AFTER MARKET UPDATE - MONDAY, OCTOBER 19TH, 2009
Previous After Market Report Next After Market Report >>>
|
|
|
|
DOW |
+96.28 |
10,092.19 |
+0.96% |
|
Volume |
1,081,263,310 |
-22% |
|
Volume |
2,005,133,960 |
-11% |
|
NASDAQ |
+19.52 |
2,176.32 |
+0.91% |
|
Advancers |
2,236 |
72% |
|
Advancers |
1,744 |
61% |
|
S&P 500 |
+10.23 |
1,097.91 |
+0.94% |
|
Decliners |
800 |
26% |
|
Decliners |
961 |
34% |
|
Russell 2000 |
+6.16 |
622.34 |
+1.00% |
|
52 Wk Highs |
429 |
|
|
52 Wk Highs |
165 |
|
|
S&P 600 |
+3.28 |
328.66 |
+1.01% |
|
52 Wk Lows |
3 |
|
|
52 Wk Lows |
11 |
|
|
 |
Major Averages Climb Higher On Lighter Volume
Adam Sarhan, Contributing Writer,
The major averages rallied on Monday ahead of Apple Inc's (AAPL +0.96%) earnings announcement. Monday marked the 22-year anniversary of the October 1987 crash. Volume was lighter than the prior session on the NYSE and the Nasdaq exchange, which was expected since Friday was an options expiration day. Advancers led decliners by almost a 3-to-1 ratio on the NYSE and by almost a 2-to-1 ratio on the Nasdaq exchange. There were 50 high-ranked companies from the CANSLIM.net Leaders List, making a new 52-week high and appearing on the CANSLIM.net BreakOuts Page, up sharply from the 27 issues that appeared on the prior session. New 52-week highs substantially outnumbered new 52-week lows on both major exchanges.
The major averages jumped to a one-year high on better-than-expected earnings and a healthier outlook for the major averages. The US dollar continued to fall which helped send stocks and a basket of commodities higher on Monday. Analysts believe that earnings will exceed analysts’ third-quarter estimates which is believed to help extend the latest market rally. This will be a very busy week on the earnings front. The latest data shows that approximately 130 companies in the S&P 500 are scheduled to report this week. The average analyst believes that profits will rebound +65% in the last three months of the year after falling for nine straight quarters which is the longest streak since the Great Depression.
It was encouraging to see stocks rally after confidence among US homebuilders unexpectedly fell in October, and concerns are spreading that home sales will fall after government credits expire. The National Association of Home Builders/Wells Fargo confidence index fell -18% a reading of 19 in September which was the highest in more than a year, the Washington-based association said. Any reading below 50 suggests respondents view conditions as poor. So far the S&P 500 has rallied nearly +60% from its 12-year low in early March 2009.
Does Your "Expert" Portfolio Manager Have You Over-Diversified And Under-Performing?
In recent weeks we have heard from a number of investors who were frustrated to see their accounts over diversified and under performing at the hands of investment managers claiming to make their moves based on this fact-based system. To find out more about working directly with full service professionals doing it the right way, simply fill out this form and we will contact you to discuss a specific course of action that suits you best (CLICK HERE) *Accounts over $250,000 please, and serious inquiries only.
|
|
|
 |
Commodity-Linked Groups Add To Prior Week's Gains
Kenneth J. Gruneisen - Passed the CAN SLIM® Master's Exam
Commodity-linked groups added to their solid gains from the prior week and posted gains on Monday as the Gold & Silver Index ($XAU +0.88%), Integrated Oil Index ($XOI +1.08%), and Oil Services Index ($OSX +1.57%) rallied. The tech sector also had a widely positive bias as the Semiconductor Index ($SOX +1.48%), Networking Index ($NWX +1.28%), and Internet Index ($IIX +1.26%) posted gains. However, the Biotechnology Index ($BTK -0.03%) ended essentially flat even while the Healthcare Index ($HMO +0.71%) rose. The Retail Index ($RLX +1.12%) was also positive influence on the major averages, meanwhile, financial shares were mixed as the Broker/Dealer Index ($XBD +1.10%) rose but the Bank Index ($BKX -0.51%) suffered a small loss.
Charts courtesy www.stockcharts.com
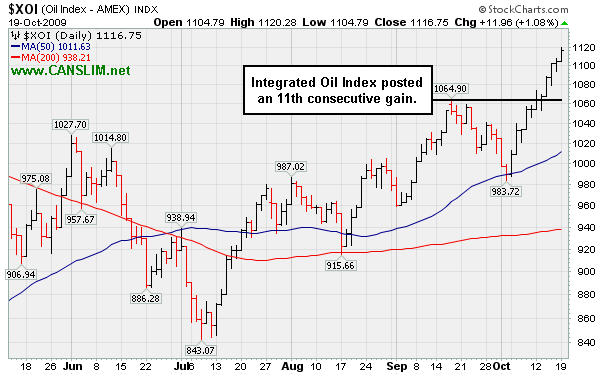
PICTURED: The Integrated Oil Index ($XOI +1.08%) posted an 11th consecutive gain, steadily rallying to new 2009 highs after bouncing at its 50-day moving average line at the start of October.
| Oil Services |
$OSX |
211.25 |
+3.27 |
+1.57% |
+74.03% |
| Healthcare |
$HMO |
1,146.22 |
+8.07 |
+0.71% |
+19.38% |
| Integrated Oil |
$XOI |
1,116.75 |
+11.96 |
+1.08% |
+13.99% |
| Semiconductor |
$SOX |
327.61 |
+4.78 |
+1.48% |
+54.41% |
| Networking |
$NWX |
242.26 |
+3.07 |
+1.28% |
+68.36% |
| Internet |
$IIX |
224.17 |
+2.80 |
+1.26% |
+67.58% |
| Broker/Dealer |
$XBD |
124.63 |
+1.35 |
+1.10% |
+60.88% |
| Retail |
$RLX |
397.45 |
+4.42 |
+1.12% |
+42.32% |
| Gold & Silver |
$XAU |
178.05 |
+1.55 |
+0.88% |
+43.76% |
| Bank |
$BKX |
47.05 |
-0.24 |
-0.51% |
+6.16% |
| Biotech |
$BTK |
930.71 |
-0.31 |
-0.03% |
+43.81% |
|
|
|
 |
Weak Technical Action Is A Worrisome Sign
Kenneth J. Gruneisen - Passed the CAN SLIM® Master's Exam
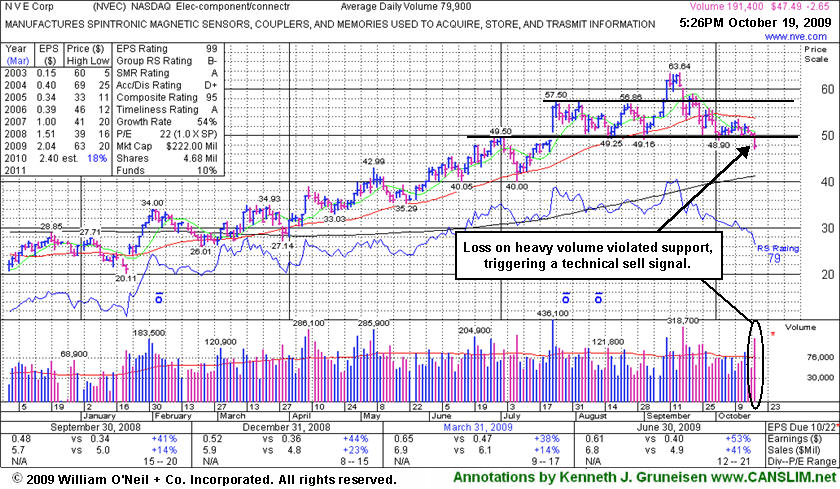
NVE Corp (NVEC -$2.65 or -5.58% to $47.49) suffered a considerable loss today on more than 2 times average volume as it violated prior chart lows in the $49 area triggered a technical sell signal. Based on the poor technical action it will be dropped from the Featured Stocks list tonight. The high-ranked leader in the Electronics - Components/Connectors group had traded up as much as +88% after first being featured in yellow at $33.85 on 3/13/09 in the mid-day report (read here). However, on 9/16/09 it appeared in this section under the headline, "Negative Reversal, Yet Still Above Max Buy Level." That negative reversal was followed by a gap down loss on heavy volume that negated its latest breakout. This makes a good example for study of how negative reversals can signal a change in trend. Not long afterward, it was noted when closes under its 50-day moving average (DMA) line raised concerns and triggered a technical sell signal. That was followed by additional analysis on 9/30/09 in this section under the headline "Negative Reversal Followed By Distributional Action."
The weak technical action is a worrisome sign, even though NVEC still has maintained a good quarterly and annual earnings growth history (C & A criteria). It even showed acceleration in the latest report for the quarter ended June 30, 2009. In that period sales revenues were up +41% and earnings were up +53%, even bigger percentage increases than prior solid (+25% or better) earnings comparisons, which is a very encouraging characteristic commonly seen in the market's biggest winners. It would need to rally above its 50 DMA line again for its outlook to improve.
|
|
|
Color Codes Explained :
Y - Better candidates highlighted by our
staff of experts.
G - Previously featured
in past reports as yellow but may no longer be buyable under the
guidelines.
***Last / Change / Volume quote data in this table corresponds with the timestamp on the note***
Symbol/Exchange
Company Name
Industry Group |
Last |
Chg. |
Vol
% DAV |
Date Featured |
Price Featured |
Latest Pivot Point
Featured |
Status |
| Latest Max Buy Price |
ARO
- NYSE
Aeropostale Inc
RETAIL - Apparel Stores
|
$41.99
|
+0.78
|
1,688,891
65% DAV
2,588,600
|
8/21/2009
(Date
Featured) |
$39.21
(Price
Featured) |
PP = $38.84 |
Y |
| MB = $40.78 |
Most Recent Note - 10/19/2009 4:11:04 PM
Y - Gain with lighter volume today. Distributional pressure last week pressured it near important support at its 50 DMA line. This high-ranked leader in the Retail - Clothing/shoe group's color code was changed to yellow again on 10/09/09, with a note that it is "permissible under the guidelines to accumulate shares from the first successful test of support at its short-term average line up to as much as 5% above its latest chart highs." However, a 50 DMA line violation could raise concerns and trigger a technical sell signal. The next key chart support level is prior highs in the $38 area. It was featured in yellow in the 8/21/09 Mid-Day BreakOuts Report (read here).
>>> The latest Featured Stock Update with an annotated graph appeared on 10/6/2009. click here.
|
|
C
A
S
I |
News |
Chart |
SEC
View all notes Alert
me of new notes
Company
Profile
|
ARST
-
|
$25.15
|
+0.05
|
548,559
83% DAV
661,500
|
9/1/2009
(Date
Featured) |
$19.91
(Price
Featured) |
PP = $20.90 |
G |
| MB = $21.95 |
Most Recent Note - 10/19/2009 4:12:30 PM
G - Holding its ground after rallying to new all-time highs last week with multiple gains on above average volume. On 10/14/09 its considerable gain backed by more than 2 times average volume helped it rally from a short "base-on-base" type pattern. ARST was first featured in yellow at $19.91 in the 9/01/09 mid-day report with an annotated daily graph (read here). As previously noted, "Recent lows may be considered an initial support level. Prior chart highs and its 50 DMA line, coinciding in the $20 area, define an important technical support level to watch on pullbacks."
>>> The latest Featured Stock Update with an annotated graph appeared on 10/2/2009. click here.
|
|
C
A
S
I |
News |
Chart |
SEC
View all notes Alert
me of new notes
Company
Profile
|
ASIA
-
|
$23.63
|
+0.37
|
1,284,900
167% DAV
768,100
|
10/14/2009
(Date
Featured) |
$23.05
(Price
Featured) |
PP = $22.19 |
G |
| MB = $23.30 |
Most Recent Note - 10/19/2009 4:14:22 PM
G - Gain with above average volume lifted it to a close above its "max buy" level. Color code is changed to green. A gap up and considerable breakout gain with 5 times average volume triggered a technical buy signal on 10/14/09. It was highlighted in yellow in the 10/14/09 mid-day report (read here) as it blasted to a new 52-week high above its long-ago noted pivot point when featured in the August 2009 CANSLIM.net News (read here).
>>> The latest Featured Stock Update with an annotated graph appeared on 10/14/2009. click here.
|
|
C
A
S
I |
News |
Chart |
SEC
View all notes Alert
me of new notes
Company
Profile
|
BIDU
- NASDAQ
Baidu Inc Ads
INTERNET - Internet Information Providers
|
$411.24
|
+15.45
|
2,054,652
113% DAV
1,810,600
|
9/8/2009
(Date
Featured) |
$351.80
(Price
Featured) |
PP = $368.59 |
G |
| MB = $387.02 |
Most Recent Note - 10/19/2009 4:16:47 PM
G - Consolidating in the $400 area after recent gains challenged its 2007 all-time high of $429. It is extended from a proper buy point under the investment system guidelines. BIDU was featured in yellow in the 9/08/09 Mid-Day BreakOuts Report (read here).
>>> The latest Featured Stock Update with an annotated graph appeared on 10/7/2009. click here.
|
|
C
A
S
I |
News |
Chart |
SEC
View all notes Alert
me of new notes
Company
Profile
|
CACC
- NASDAQ
Credit Acceptance Corp
FINANCIAL SERVICES - Credit Services
|
$36.76
|
+0.80
|
17,639
40% DAV
43,800
|
9/29/2009
(Date
Featured) |
$33.48
(Price
Featured) |
PP = $32.60 |
G |
| MB = $34.23 |
Most Recent Note - 10/19/2009 4:18:41 PM
G - Gain on very light volume today for a new high close. It is extended from a sound base now. The Finance - Consumer/Commercial Loans firm has maintained a great track record of annual and quarterly sales revenues and earnings increases. It was featured on 9/29/09 in yellow in the mid-day report (read here).
>>> The latest Featured Stock Update with an annotated graph appeared on 10/15/2009. click here.
|
|
C
A
S
I |
News |
Chart |
SEC
View all notes Alert
me of new notes
Company
Profile
|
CRM
- NYSE
Salesforce.com Inc
INTERNET - Internet Software & Services
|
$62.87
|
+0.51
|
672,626
32% DAV
2,107,500
|
8/16/2009
(Date
Featured) |
$47.12
(Price
Featured) |
PP = $45.59 |
G |
| MB = $47.87 |
Most Recent Note - 10/19/2009 4:22:37 PM
G - Still quietly perched at 2009 highs, extended from any sound base. Technical support to watch now is an upward trendline connecting its July, August and October chart lows, a line which comes into play above additional support at its 50 DMA line.
>>> The latest Featured Stock Update with an annotated graph appeared on 10/5/2009. click here.
|
|
C
A
S
I |
News |
Chart |
SEC
View all notes Alert
me of new notes
Company
Profile
|
EBIX
- NASDAQ
Ebix Inc
COMPUTER SOFTWARE & SERVICES - Business Software & Services
|
$64.91
|
+1.71
|
333,536
167% DAV
199,300
|
8/28/2009
(Date
Featured) |
$45.86
(Price
Featured) |
PP = $45.35 |
G |
| MB = $47.62 |
Most Recent Note - 10/19/2009 4:24:30 PM
G - Gain today with above average volume added to its considerable 10/16/09 gain with heavy volume for a new all-time high. It is very extended from any sound base, well above support at its 50 DMA line, and more than +103% above its 200 DMA line - all of which are reminders to be watchful for sell signals.
>>> The latest Featured Stock Update with an annotated graph appeared on 10/13/2009. click here.
|
|
C
A
S
I |
News |
Chart |
SEC
View all notes Alert
me of new notes
Company
Profile
|
GMCR
- NASDAQ
Green Mtn Coffee Roastrs
FOOD & BEVERAGE - Processed & Packaged Goods
|
$76.00
|
+2.65
|
2,018,674
157% DAV
1,283,100
|
10/5/2009
(Date
Featured) |
$71.11
(Price
Featured) |
PP = $75.89 |
Y |
| MB = $79.68 |
Most Recent Note - 10/19/2009 4:29:32 PM
Y - Gapped up today and rallied to a new 52-week high, rising above is pivot point with volume just above the minimum of +50% above average volume needed to trigger a proper technical buy signal. Keep in mind this may be considered a 3rd or 4th stage base, and thus more failure prone, meanwhile its earlier breakouts were backed by far more impressive volume.
>>> The latest Featured Stock Update with an annotated graph appeared on 10/12/2009. click here.
|
|
C
A
S
I |
News |
Chart |
SEC
View all notes Alert
me of new notes
Company
Profile
|
NVEC
- NASDAQ
N V E Corp
ELECTRONICS - Semiconductor - Specialized
|
$47.49
|
-2.65
|
191,633
N/A
|
8/26/2009
(Date
Featured) |
$55.32
(Price
Featured) |
PP = $57.60 |
|
| MB = $60.48 |
Most Recent Note - 10/19/2009
Loss today on more than 2 times average volume as it violated prior chart lows in the $49 area triggered a technical sell signal. Based on the poor technical action it will be dropped from the Featured Stocks list tonight. NVEC had traded up as much as +88% after first being featured in yellow at $33.85 on 3/13/09 in the mid-day report (read here).
>>> The latest Featured Stock Update with an annotated graph appeared on 10/19/2009. click here.
|
|
C
A
S
I |
News |
Chart |
SEC
View all notes Alert
me of new notes
Company
Profile
|
PEGA
- NASDAQ
Pegasystems Inc
COMPUTER SOFTWARE & SERVICES - Business Software & Services
|
$34.82
|
+0.02
|
206,095
62% DAV
331,300
|
9/9/2009
(Date
Featured) |
$31.14
(Price
Featured) |
PP = $33.35 |
Y |
| MB = $35.02 |
Most Recent Note - 10/19/2009 4:43:13 PM
Y - Quietly hovering in a tight range, perched less than -3% from its all-time high. This high-ranked Computer Software - Financial firm found support near its 50 DMA line on recent pullbacks. The 50 DMA and upward trendline are important support levels to watch now.
>>> The latest Featured Stock Update with an annotated graph appeared on 10/8/2009. click here.
|
|
C
A
S
I |
News |
Chart |
SEC
View all notes Alert
me of new notes
Company
Profile
|
SWI
- NYSE
Solarwinds Inc
COMPUTER SOFTWARE & SERVICES - Application Software
|
$22.81
|
+1.27
|
730,030
150% DAV
485,100
|
9/30/2029
(Date
Featured) |
$22.03
(Price
Featured) |
PP = $21.72 |
Y |
| MB = $22.81 |
Most Recent Note - 10/19/2009 4:47:39 PM
Y - Positively reversed today after a pullback near its 50 DMA line, then this high-ranked Computer Software - Enterprise firm reported decent results for the quarter ended Sep 30, 2009 after the close. Volume and volatility are often greater around earnings announcements. SWI was featured in the October 2009 issue of CANSLIM.net News (read here).
>>> The latest Featured Stock Update with an annotated graph appeared on 9/30/2009. click here.
|
|
C
A
S
I |
News |
Chart |
SEC
View all notes Alert
me of new notes
Company
Profile
|
WNS
- NYSE
W N S Holdings Ltd Ads
DIVERSIFIED SERVICES - Business/Management Services
|
$16.88
|
+0.18
|
113,080
188% DAV
60,200
|
9/28/2009
(Date
Featured) |
$15.28
(Price
Featured) |
PP = $16.10 |
Y |
| MB = $16.91 |
Most Recent Note - 10/19/2009 4:49:24 PM
Y - Hit a new 52-week high today with its second consecutive gain on above average volume, closing near its "max buy" level. Its 10/16/09 gain on more than 2 times average volume helped it trade and close above its pivot point, triggering a technical buy signal while clearing stubborn resistance. Recently found support at its 50 DMA line. Featured in yellow in the 9/28/09 mid-day report (read here). Quarterly earnings have been above the +25% guideline and its annual earnings history has been great, satisfying the C & A criteria. However, sales revenues growth has decelerated.
>>> The latest Featured Stock Update with an annotated graph appeared on 10/16/2009. click here.
|
|
C
A
S
I |
News |
Chart |
SEC
View all notes Alert
me of new notes
Company
Profile
|
|
|
|
THESE ARE NOT BUY RECOMMENDATIONS!
Comments contained in the body of this report are technical
opinions only. The material herein has been obtained
from sources believed to be reliable and accurate, however,
its accuracy and completeness cannot be guaranteed.
This site is not an investment advisor, hence it does
not endorse or recommend any securities or other investments.
Any recommendation contained in this report may not
be suitable for all investors and it is not to be deemed
an offer or solicitation on our part with respect to
the purchase or sale of any securities. All trademarks,
service marks and trade names appearing in this report
are the property of their respective owners, and are
likewise used for identification purposes only.
This report is a service available
only to active Paid Premium Members.
You may opt-out of receiving report notifications
at any time. Questions or comments may be submitted
by writing to Premium Membership Services 665 S.E. 10 Street, Suite 201 Deerfield Beach, FL 33441-5634 or by calling 1-800-965-8307
or 954-785-1121.
|
|
|


