You are not logged in.
This means you
CAN ONLY VIEW reports that were published prior to Monday, April 14, 2025.
You
MUST UPGRADE YOUR MEMBERSHIP if you want to see any current reports.
AFTER MARKET UPDATE - WEDNESDAY, OCTOBER 19TH, 2011
Previous After Market Report Next After Market Report >>>
|
|
|
|
DOW |
-72.43 |
11,504.62 |
-0.63% |
|
Volume |
963,942,050 |
-11% |
|
Volume |
1,925,999,780 |
+2% |
|
NASDAQ |
-53.39 |
2,604.04 |
-2.01% |
|
Advancers |
821 |
26% |
|
Advancers |
618 |
23% |
|
S&P 500 |
-15.50 |
1,209.88 |
-1.26% |
|
Decliners |
2,204 |
71% |
|
Decliners |
1,944 |
74% |
|
Russell 2000 |
-14.97 |
694.37 |
-2.11% |
|
52 Wk Highs |
47 |
|
|
52 Wk Highs |
35 |
|
|
S&P 600 |
-7.53 |
382.45 |
-1.93% |
|
52 Wk Lows |
11 |
|
|
52 Wk Lows |
32 |
|
|
 |
Afternoon Slump Sends Major Averages Lower With Negative Breadth
Kenneth J. Gruneisen - Passed the CAN SLIM® Master's Exam
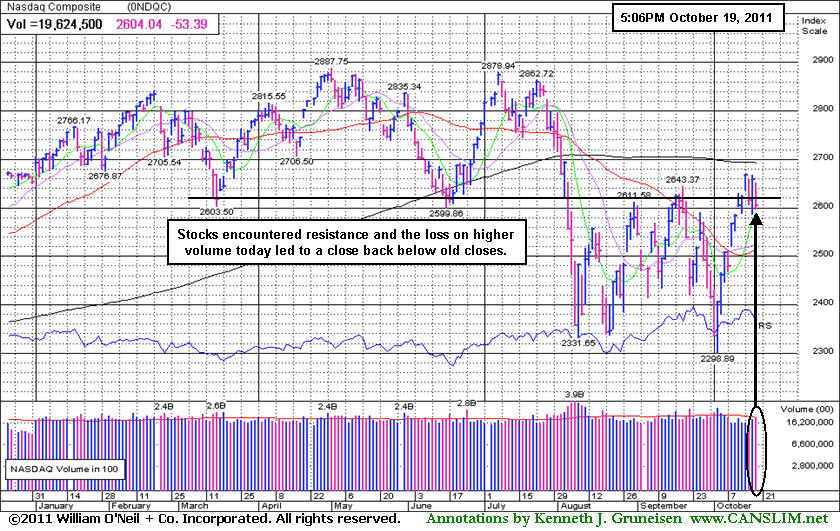
The major averages were on their way to a mixed session through the morning and early-afternoon, but broad-based weakness on Wednesday afternoon led to a unanimously lower close. The trading volume total reported on the NYSE was slightly lower while volume was slightly higher on the Nasdaq exchange versus the prior session. Declining issues led advancing issues by 11-4 on the NYSE and 3-1 on the Nasdaq exchange. New 52-week highs outnumbered new 52-week lows on the NYSE and on the Nasdaq exchange. There were 26 high-ranked companies from the CANSLIM.net Leaders List that made new 52-week highs and appeared on the CANSLIM.net BreakOuts Page, up meaningfully from the prior session total of 10 stocks. There were gains for only 2 of the 8 high-ranked companies currently included on the Featured Stocks Page.
A Federal Reserve survey of regional economic conditions gave the markets no help. The Fed said the economy maintained its expansion, but companies had less certain outlooks for business conditions. A separate report showed September housing starts jumped 15%, the most since April 2010, on rising demand for apartments and condominiums.
Stocks gave back some of their gains from Tuesday's rally on worries a debt solution in Europe may not be imminent before next week's summit of government leaders. A rare earnings disappointment by Apple Inc (AAPL -5.6%) also weighed on stocks after the tech leader's profits missed analyst estimates for the first time in six years. Dow component Intel Corp (INTC +3.7%) rose to a new 52-week high after reporting sales exceeded some forecasts. The Travelers Companies Inc (TRV +5.69%) took the high road in the financial sector. The insurance company signaled it is making progress on raising prices. Abbott Laboratories (ABT +1.54%) rose after announcing it will split into two companies.
The October 2011 issue of our monthly newsletter CANSLIM.net News will be published soon. The Q3 2011 Webcast (aired on September 28th) is now available "ON DEMAND" - (CLICK HERE) It provides an informative review of current market conditions, leading groups, and best buy candidates. All upgraded members are eligible to access the webcast presentation at no additional cost! Via the Premium Member Homepage links to all prior reports and webcasts are always available.
PICTURED: The Nasdaq Composite Index encountered resistance and slumped to a weak finish below its old closes which were an earlier support level.
|
 Kenneth J. Gruneisen started out as a licensed stockbroker in August 1987, a couple of months prior to the historic stock market crash that took the Dow Jones Industrial Average down -22.6% in a single day. He has published daily fact-based fundamental and technical analysis on high-ranked stocks online for two decades. Through FACTBASEDINVESTING.COM, Kenneth provides educational articles, news, market commentary, and other information regarding proven investment systems that work in good times and bad.
Comments contained in the body of this report are technical opinions only and are not necessarily those of Gruneisen Growth Corp. The material herein has been obtained from sources believed to be reliable and accurate, however, its accuracy and completeness cannot be guaranteed. Our firm, employees, and customers may effect transactions, including transactions contrary to any recommendation herein, or have positions in the securities mentioned herein or options with respect thereto. Any recommendation contained in this report may not be suitable for all investors and it is not to be deemed an offer or solicitation on our part with respect to the purchase or sale of any securities. |
|
 |
Gold and Silver Index Led Declining Groups
Kenneth J. Gruneisen - Passed the CAN SLIM® Master's Exam
The Gold & Silver Index ($XAU -5.39%) was the hardest hit group on Wednesday's widely negative session. Financial shares had a negative influence on the major average as the Bank Index ($BKX -3.07%) and Broker/Dealer Index ($XBD -3.06%) suffered large losses. The Retail Index ($RLX -1.90%) fell, and the Networking Index ($NWX -4.50%) sagged the worst in the tech sector while the Internet Index ($IIX -2.44%), Semiconductor Index ($SOX -2.24%), and Biotechnology Index ($BTK -0.95%) also slumped. The Oil Services Index ($OSX -2.58%) fell harder than the Integrated Oil Index ($XOI -0.76%), and the Healthcare Index ($HMO -0.16%) finished slightly lower on the day.
Charts courtesy www.stockcharts.com
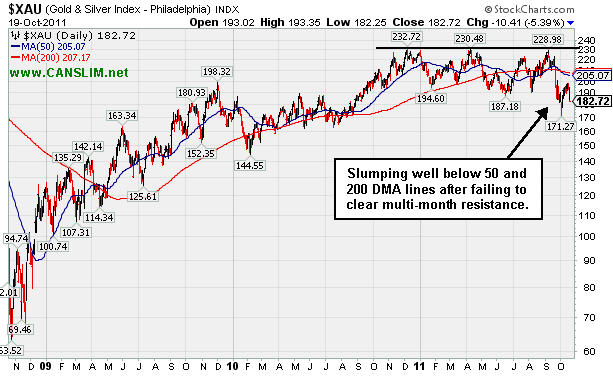
PICTURED: The 3-year graph of the Gold & Silver Index ($XAU -5.39%) shows it slumping below its 50-day and 200-day moving average lines after failing to clear multi-month resistance on the latest rally attempt.
| Oil Services |
$OSX |
212.00 |
-5.61 |
-2.58% |
-13.51% |
| Healthcare |
$HMO |
1,905.70 |
-2.97 |
-0.16% |
+12.63% |
| Integrated Oil |
$XOI |
1,172.22 |
-8.99 |
-0.76% |
-3.38% |
| Semiconductor |
$SOX |
370.16 |
-8.50 |
-2.24% |
-10.12% |
| Networking |
$NWX |
228.15 |
-10.76 |
-4.50% |
-18.68% |
| Internet |
$IIX |
286.77 |
-7.16 |
-2.44% |
-6.81% |
| Broker/Dealer |
$XBD |
84.49 |
-2.67 |
-3.06% |
-30.46% |
| Retail |
$RLX |
531.71 |
-10.28 |
-1.90% |
+4.59% |
| Gold & Silver |
$XAU |
182.72 |
-10.41 |
-5.39% |
-19.36% |
| Bank |
$BKX |
37.55 |
-1.19 |
-3.07% |
-28.08% |
| Biotech |
$BTK |
1,109.39 |
-10.59 |
-0.95% |
-14.51% |
|
|
|
 |
Breakaway Gap Triggered Fresh Technical Buy Signal
Kenneth J. Gruneisen - Passed the CAN SLIM® Master's Exam
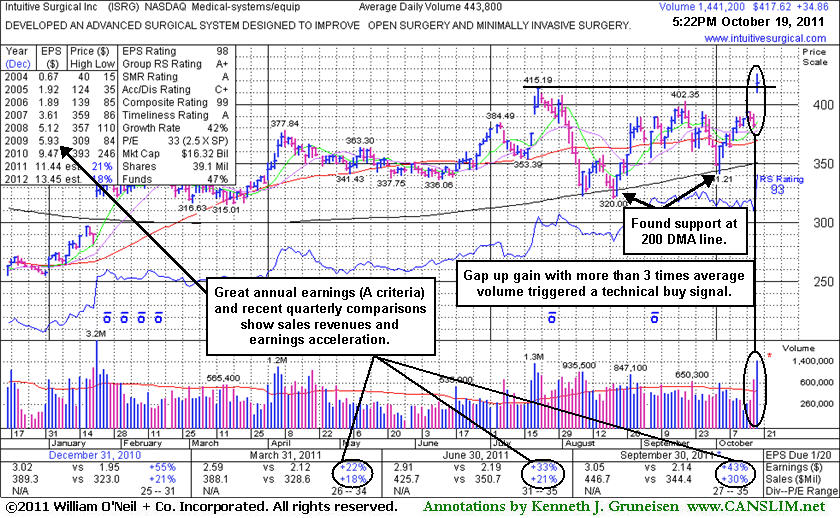
Intuitive Surgical Inc's (ISRG +34.86 or +9.11% to $417.62) color code was changed to yellow with pivot point cited based on its 52-week high plus 10 cents in the mid-day report earlier today. Its breakaway gap today for a new 52-week and all-time high was backed my more than 3 times average volume, triggering a technical buy signal. The strong action came after reporting earnings +43% on +30% sales revenues for the quarter ended September 30, 2011 versus the year ago period. Accelerating sales revenues and earnings increases in recent quarterly comparisons are a reassuring sign, and it has a great annual earnings (A criteria) history.
Some investors may dismiss such a "high-priced" stock as if it lacks the potential to produce big gains, but experienced investors and institutional investors know that the price of the shares has no bearing on their upside potential. More often, higher priced stocks are actually superior buy candidates, and the market has priced the companies' shares at highs for legitimate reasons, not by accident. This company's small supply (S criteria) of only 39.1 million shares outstanding can lead to greater volatility in the event of any abrupt institutional buying or selling. The number of top-rated funds owning its shares actually dipped from 1190 in Mar '11 to 1160 in Sep '11. Its powerful rally to new high territory is recognized as a fresh and reassuring sign of institutional accumulation (the investment system's I criteria). Its annual earnings history (the A criteria) has been very impressive.
Technically, it found support near its 200-day moving average (DMA) line during its choppy consolidation since noted in the 7/28/11 mid-day report following the previously noted "breakaway gap" and volume-driven gains to new high territory. Difficult market conditions hurt its chances and negated that breakout during the summer, demonstrating what the M criteria tells us - that 3 out of 4 stocks typically go in the direction of the major averages! Broader market action will largely determine whether this latest breakout is followed by a sustained advance.
ISRG's last appearance in this FSU section was on 5/03/10 with an annotated graph included under the headline, "Sales Revenues And Earnings Showed Acceleration In Latest Quarter". That report stated - "Subsequent violations of its recent chart low or 50-day moving average (DMA) line could raise more serious concerns and trigger sell signals." Soon afterward those violations occurred, and based on the weak action it was dropped from the Featured Stocks list on 5/07/10. It went through a long deep consolidation before rebounding impressively. It has continued to show impressive sales revenues and earnings growth. Long time members may recall that ISRG was first featured in yellow in CANSLIM.net reports in the summer of 2004 and it traded up more than 13-fold within a three and a half year time span after that initial appearance as a noteworthy buy candidate.
|
|
|
Color Codes Explained :
Y - Better candidates highlighted by our
staff of experts.
G - Previously featured
in past reports as yellow but may no longer be buyable under the
guidelines.
***Last / Change / Volume data in this table is the closing quote data***
Symbol/Exchange
Company Name
Industry Group |
PRICE |
CHANGE
(%Change) |
Day High |
Volume
(% DAV)
(% 50 day avg vol) |
52 Wk Hi
% From Hi |
Featured
Date |
Price
Featured |
Pivot Featured |
|
Max Buy |
AAPL
-
NASDAQ
Apple Inc
COMPUTER HARDWARE - Personal Computers
|
$398.62
|
-23.62
-5.59% |
$408.42
|
39,372,061
176.73% of 50 DAV
50 DAV is 22,278,600
|
$426.70
-6.58%
|
9/16/2011
|
$399.14
|
PP = $404.60
|
|
MB = $424.83
|
 Most Recent Note - 10/19/2011 12:06:54 PM
G - Gapped down today after reporting earnings +52% on +39% sales revenues for the quarter ended September 30, 2011 versus the year ago period, marking the tech leader's weakest increases in sales and earnings in any quarter since the Dec '09. It has not formed a sound base pattern.
>>> The latest Featured Stock Update with an annotated graph appeared on 10/6/2011. Click here.
View all notes |
Alert me of new notes |
CANSLIM.net Company Profile |
SEC |
Zacks Reports |
StockTalk |
News |
Chart |
Request a new note
C
A N
S L
I M


|
ALXN
-
NASDAQ
Alexion Pharmaceuticals
DRUGS - Drug Manufacturers - Other
|
$66.06
|
-0.66
-0.99% |
$67.82
|
1,071,990
66.78% of 50 DAV
50 DAV is 1,605,200
|
$70.20
-5.90%
|
9/15/2011
|
$63.20
|
PP = $60.81
|
|
MB = $63.85
|
Most Recent Note - 10/18/2011 4:27:03 PM
G - Still hovering in a tight range near its all-time high with volume totals recently cooling. This high-ranked Medical - Biomed/Biotech group leader is extended from its prior base. Support to watch includes prior resistance in the $59-60 area and its upwardly tilted 50 DMA line.
>>> The latest Featured Stock Update with an annotated graph appeared on 10/18/2011. Click here.
View all notes |
Alert me of new notes |
CANSLIM.net Company Profile |
SEC |
Zacks Reports |
StockTalk |
News |
Chart |
Request a new note
C
A N
S L
I M
|
CELG
-
NASDAQ
Celgene Corp
DRUGS - Drug Manufacturers - Major
|
$65.31
|
-0.56
-0.85% |
$66.10
|
2,446,263
60.57% of 50 DAV
50 DAV is 4,038,500
|
$67.01
-2.54%
|
9/16/2011
|
$61.21
|
PP = $62.59
|
|
MB = $65.72
|
Most Recent Note - 10/18/2011 4:39:13 PM
G - Color code is changed to green after rising back above its "max buy" level today. Historic studies showed that investors' odds of success were best when buying stocks as they were rising rather than when they were pulling back.
>>> The latest Featured Stock Update with an annotated graph appeared on 10/14/2011. Click here.
View all notes |
Alert me of new notes |
CANSLIM.net Company Profile |
SEC |
Zacks Reports |
StockTalk |
News |
Chart |
Request a new note
C
A N
S L
I M
|
ISRG
-
NASDAQ
Intuitive Surgical Inc
HEALTH SERVICES - Medical Appliances and Equipment
|
$417.62
|
+34.86
9.11% |
$425.49
|
1,442,396
325.01% of 50 DAV
50 DAV is 443,800
|
$415.19
0.59%
|
10/19/2011
|
$424.69
|
PP = $415.29
|
|
MB = $436.05
|
Most Recent Note - 10/19/2011 6:13:03 PM
Y - Color code was changed to yellow in the mid-day report earlier today with a pivot point cited based on its 52-week high plus 10 cents. Its breakaway gap for new 52-week and all-time highs was backed by more than 3 times average volume, triggering a technical buy signal. It reported earnings +43% on +30% sales revenues for the quarter ended September 30, 2011 versus the year ago period. Accelerating sales revenues and earnings increases are a reassuring sign, and it has a great annual earnings (A criteria) history. Small supply (S criteria) of only 39.1 million shares can lead to greater volatility. Found support near its 200 DMA line during its choppy consolidation since noted in the 7/28/11 mid-day report following the previously noted "breakaway gap" and volume-driven gains to new high territory. See the latest FSU analysis for more details and a new annotated graph.
>>> The latest Featured Stock Update with an annotated graph appeared on 10/19/2011. Click here.
View all notes |
Alert me of new notes |
CANSLIM.net Company Profile |
SEC |
Zacks Reports |
StockTalk |
News |
Chart |
Request a new note
C
A N
S L
I M
|
LABL
-
NASDAQ
Multi Color Corp
CONSUMER NON-DURABLES - Packaging and Containers
|
$26.11
|
-1.10
-4.04% |
$27.22
|
45,874
75.33% of 50 DAV
50 DAV is 60,900
|
$28.00
-6.75%
|
10/17/2011
|
$27.81
|
PP = $28.10
|
|
MB = $29.51
|
Most Recent Note - 10/19/2011 4:17:08 PM
Y - Closed near the session low today with a second consecutive loss on below average volume, finishing -6.8% off its 52-week high. During a choppy 10-week consolidation its 200 DMA line acted as support. Little overhead supply remains to act as resistance. Subsequent volume-driven gains into new high ground may trigger a technical buy signal. Annual earnings (A criteria) history included a slight dip in FY '09 earnings.
>>> The latest Featured Stock Update with an annotated graph appeared on 10/17/2011. Click here.
View all notes |
Alert me of new notes |
CANSLIM.net Company Profile |
SEC |
Zacks Reports |
StockTalk |
News |
Chart |
Request a new note
C
A N
S L
I M
|
Symbol/Exchange
Company Name
Industry Group |
PRICE |
CHANGE
(%Change) |
Day High |
Volume
(% DAV)
(% 50 day avg vol) |
52 Wk Hi
% From Hi |
Featured
Date |
Price
Featured |
Pivot Featured |
|
Max Buy |
MG
-
NYSE
Mistras Group Inc
DIVERSIFIED SERVICES - Bulding and Faci;ity Management Services
|
$22.69
|
+0.21
0.93% |
$23.28
|
270,436
111.29% of 50 DAV
50 DAV is 243,000
|
$23.00
-1.35%
|
8/10/2011
|
$17.89
|
PP = $17.58
|
|
MB = $18.46
|
Most Recent Note - 10/19/2011 12:33:46 PM
G - Inching up to yet another new all-time high today, getting more extended from its prior base. Prior highs in the $20-21 area define initial chart support to watch above its 50 DMA line.
>>> The latest Featured Stock Update with an annotated graph appeared on 10/12/2011. Click here.
View all notes |
Alert me of new notes |
CANSLIM.net Company Profile |
SEC |
Zacks Reports |
StockTalk |
News |
Chart |
Request a new note
C
A N
S L
I M
|
OPNT
-
NASDAQ
Opnet Technologies
INTERNET - Internet Software and Services
|
$38.80
|
-0.04
-0.10% |
$39.39
|
109,801
67.86% of 50 DAV
50 DAV is 161,800
|
$42.51
-8.73%
|
10/11/2011
|
$38.45
|
PP = $42.02
|
|
MB = $44.12
|
Most Recent Note - 10/18/2011 4:42:43 PM
Y - Still holding its ground stubbornly with volume totals cooling after encountering distributional pressure last week. Disciplined investors would wait to see subsequent gains above its pivot point trigger a technical buy signal before taking action.
>>> The latest Featured Stock Update with an annotated graph appeared on 10/11/2011. Click here.
View all notes |
Alert me of new notes |
CANSLIM.net Company Profile |
SEC |
Zacks Reports |
StockTalk |
News |
Chart |
Request a new note
C
A N
S L
I M
|
V
-
NYSE
Visa Inc Cl A
DIVERSIFIED SERVICES - Business/Management Services
|
$90.08
|
-3.83
-4.08% |
$94.48
|
5,413,226
93.67% of 50 DAV
50 DAV is 5,778,900
|
$94.75
-4.93%
|
9/20/2011
|
$93.91
|
PP = $90.93
|
|
MB = $95.48
|
Most Recent Note - 10/18/2011 4:24:04 PM
G - Gain today with lighter than average volume leaves it perched near its all-time high. Choppy action in recent weeks is not recognized as a sound base pattern.
>>> The latest Featured Stock Update with an annotated graph appeared on 10/10/2011. Click here.
View all notes |
Alert me of new notes |
CANSLIM.net Company Profile |
SEC |
Zacks Reports |
StockTalk |
News |
Chart |
Request a new note
C
A N
S L
I M
|
|
|
|
THESE ARE NOT BUY RECOMMENDATIONS!
Comments contained in the body of this report are technical
opinions only. The material herein has been obtained
from sources believed to be reliable and accurate, however,
its accuracy and completeness cannot be guaranteed.
This site is not an investment advisor, hence it does
not endorse or recommend any securities or other investments.
Any recommendation contained in this report may not
be suitable for all investors and it is not to be deemed
an offer or solicitation on our part with respect to
the purchase or sale of any securities. All trademarks,
service marks and trade names appearing in this report
are the property of their respective owners, and are
likewise used for identification purposes only.
This report is a service available
only to active Paid Premium Members.
You may opt-out of receiving report notifications
at any time. Questions or comments may be submitted
by writing to Premium Membership Services 665 S.E. 10 Street, Suite 201 Deerfield Beach, FL 33441-5634 or by calling 1-800-965-8307
or 954-785-1121.
|
|
|

