Symbol/Exchange
Company Name
Industry Group |
PRICE |
CHANGE
(%Change) |
Day High |
Volume
(% DAV)
(% 50 day avg vol) |
52 Wk Hi
% From Hi |
Featured
Date |
Price
Featured |
Pivot Featured |
|
Max Buy |
ABV
-
NYSE
Comp De Bebidas Adr
FOOD and BEVERAGE - Beverages - Brewers
|
$140.87
|
+0.73
0.52% |
$141.97
|
845,492
139.66% of 50 DAV
50 DAV is 605,400
|
$140.07
0.57%
|
6/29/2010
|
$104.74
|
PP = $109.33
|
|
MB = $114.80
|
 Most Recent Note - 10/18/2010 4:23:04 PM
G - This Brazil-based beverage firm hit yet another new all-time high today with 12th consecutive gain. It is very extended from a sound base, and its 50 DMA line ($114.33 now) defines support.
>>> The latest Featured Stock Update with an annotated graph appeared on 10/11/2010. Click here.
View all notes |
Alert me of new notes |
CANSLIM.net Company Profile |
SEC |
Zacks Reports |
StockTalk |
News |
Chart |
Request a new note
C
A N
S L
I M


|
ARUN
-
NASDAQ
Aruba Networks Inc
COMPUTER HARDWARE - Networking andamp; Communication Dev
|
$20.09
|
-0.17
-0.84% |
$20.52
|
1,426,068
60.25% of 50 DAV
50 DAV is 2,367,000
|
$22.80
-11.89%
|
8/30/2010
|
$18.12
|
PP = $18.51
|
|
MB = $19.44
|
Most Recent Note - 10/15/2010 3:17:39 PM
G - Reversed into the red again today after a small gap up. Its 50 DMA line and low of $18.35 on 10/07/10 define important support.
>>> The latest Featured Stock Update with an annotated graph appeared on 9/2/2010. Click here.
View all notes |
Alert me of new notes |
CANSLIM.net Company Profile |
SEC |
Zacks Reports |
StockTalk |
News |
Chart |
Request a new note
C
A N
S L
I M
|
BIDU
-
NASDAQ
Baidu Inc Ads
INTERNET - Internet Information Providers
|
$103.40
|
+4.74
4.80% |
$105.58
|
24,248,909
248.98% of 50 DAV
50 DAV is 9,739,300
|
$107.19
-3.54%
|
9/17/2010
|
$85.73
|
PP = $88.42
|
|
MB = $92.84
|
Most Recent Note - 10/18/2010 12:11:28 PM
G - After 3 very tight weekly closes, today's gain with above average volume has it poised for a possible new high close. Recent lows define chart support above prior highs and its 50 DMA line.
>>> The latest Featured Stock Update with an annotated graph appeared on 10/7/2010. Click here.
View all notes |
Alert me of new notes |
CANSLIM.net Company Profile |
SEC |
Zacks Reports |
StockTalk |
News |
Chart |
Request a new note
C
A N
S L
I M
|
CACC
-
NASDAQ
Credit Acceptance Corp
FINANCIAL SERVICES - Credit Services
|
$58.64
|
+0.13
0.22% |
$58.71
|
14,835
42.14% of 50 DAV
50 DAV is 35,200
|
$63.45
-7.58%
|
7/29/2010
|
$52.04
|
PP = $54.07
|
|
MB = $56.77
|
Most Recent Note - 10/13/2010 5:51:07 PM
G - The recent chart low ($55.07 on 10/04/10) is the nearest chart support level to watch above its long ago chart highs ($53.97). Its 50 DMA line has been acting as resistance since last noted on 10/07/10 that - "A convincing rebound above it would help its outlook improve."
>>> The latest Featured Stock Update with an annotated graph appeared on 9/30/2010. Click here.
View all notes |
Alert me of new notes |
CANSLIM.net Company Profile |
SEC |
Zacks Reports |
StockTalk |
News |
Chart |
Request a new note
C
A N
S L
I M
|
CMG
-
NYSE
Chipotle Mexican Grill
LEISURE - Restaurants
|
$183.69
|
+1.82
1.00% |
$184.47
|
585,236
97.78% of 50 DAV
50 DAV is 598,500
|
$182.96
0.40%
|
9/1/2010
|
$158.31
|
PP = $155.52
|
|
MB = $163.30
|
Most Recent Note - 10/12/2010 5:11:00 PM
G - Inching to new all-time highs with average volume behind recent gains. Its 50 DMA line (now $161.49) defines chart support above its prior highs in the $155 area.
>>> The latest Featured Stock Update with an annotated graph appeared on 9/1/2010. Click here.
View all notes |
Alert me of new notes |
CANSLIM.net Company Profile |
SEC |
Zacks Reports |
StockTalk |
News |
Chart |
Request a new note
C
A N
S L
I M
|
Symbol/Exchange
Company Name
Industry Group |
PRICE |
CHANGE
(%Change) |
Day High |
Volume
(% DAV)
(% 50 day avg vol) |
52 Wk Hi
% From Hi |
Featured
Date |
Price
Featured |
Pivot Featured |
|
Max Buy |
CTRP
-
NASDAQ
Ctrip.Com Intl Ltd Adr
LEISURE - Resorts and Casinos
|
$50.78
|
+1.04
2.09% |
$50.97
|
1,875,602
108.31% of 50 DAV
50 DAV is 1,731,700
|
$49.23
3.14%
|
9/24/2010
|
$46.75
|
PP = $47.11
|
|
MB = $49.47
|
Most Recent Note - 10/18/2010 4:13:56 PM
G - Hit another new all-time high today, rallying further above its "max buy" level. Prior highs in the $47 area define support to watch above its 50 DMA line.
>>> The latest Featured Stock Update with an annotated graph appeared on 9/28/2010. Click here.
View all notes |
Alert me of new notes |
CANSLIM.net Company Profile |
SEC |
Zacks Reports |
StockTalk |
News |
Chart |
Request a new note
C
A N
S L
I M
|
EBIX
-
NASDAQ
Ebix Inc
COMPUTER SOFTWARE and SERVICES - Business Software and Services
|
$23.69
|
+0.17
0.72% |
$23.79
|
284,359
47.33% of 50 DAV
50 DAV is 600,800
|
$25.61
-7.50%
|
9/23/2010
|
$21.78
|
PP = $22.74
|
|
MB = $23.88
|
Most Recent Note - 10/15/2010 3:15:03 PM
Y - Color code is changed to yellow as it continues its healthy consolidation since its negative reversal on 10/06/10. Tight closes in the past 3 weeks (best viewed on its weekly chart) are not considered an advanced "3-weeks tight" type pattern due to its lack of significant progress above the pivot point recently cited. (JOBS was recently noted as a better example of a "3 weeks tight" pattern.)
>>> The latest Featured Stock Update with an annotated graph appeared on 9/24/2010. Click here.
View all notes |
Alert me of new notes |
CANSLIM.net Company Profile |
SEC |
Zacks Reports |
StockTalk |
News |
Chart |
Request a new note
C
A N
S L
I M
|
EGO
-
NYSE
Eldorado Gold Corp
METALS and MINING - Gold
|
$18.03
|
-0.17
-0.93% |
$18.05
|
4,103,710
87.61% of 50 DAV
50 DAV is 4,684,100
|
$20.23
-10.87%
|
8/19/2010
|
$18.25
|
PP = $19.17
|
|
MB = $20.13
|
Most Recent Note - 10/15/2010 3:19:01 PM
G - Volume totals have been cooling while consolidating. Color code is changed to green while it is slumping under its 50 DMA line. Its recent low ($17.65) defines an important chart support level.
>>> The latest Featured Stock Update with an annotated graph appeared on 10/12/2010. Click here.
View all notes |
Alert me of new notes |
CANSLIM.net Company Profile |
SEC |
Zacks Reports |
StockTalk |
News |
Chart |
Request a new note
C
A N
S L
I M
|
FFIV
-
NASDAQ
F 5 Networks Inc
INTERNET - Internet Software and Services
|
$93.17
|
-4.03
-4.15% |
$97.45
|
3,352,683
160.40% of 50 DAV
50 DAV is 2,090,200
|
$112.05
-16.85%
|
6/16/2010
|
$74.50
|
PP = $74.10
|
|
MB = $77.81
|
Most Recent Note - 10/18/2010 11:51:35 AM
G - Slumping back below its 50 DMA line again today. Recent lows in the $90 area define the nearest support below that important short-term average.
>>> The latest Featured Stock Update with an annotated graph appeared on 9/13/2010. Click here.
View all notes |
Alert me of new notes |
CANSLIM.net Company Profile |
SEC |
Zacks Reports |
StockTalk |
News |
Chart |
Request a new note
C
A N
S L
I M
|
FOSL
-
NASDAQ
Fossil Inc
CONSUMER DURABLES - Recreational Goods, Other
|
$53.81
|
-0.09
-0.17% |
$54.24
|
281,702
34.04% of 50 DAV
50 DAV is 827,600
|
$55.51
-3.06%
|
8/10/2010
|
$45.54
|
PP = $42.69
|
|
MB = $44.82
|
Most Recent Note - 10/14/2010 4:39:40 PM
G - Gain today with lighter volume after testing the upward trendline previously noted as initial support to watch after it has been repeatedly noted as "extended from any sound base." The next chart support level is its 50 DMA line.
>>> The latest Featured Stock Update with an annotated graph appeared on 10/5/2010. Click here.
View all notes |
Alert me of new notes |
CANSLIM.net Company Profile |
SEC |
Zacks Reports |
StockTalk |
News |
Chart |
Request a new note
C
A N
S L
I M
|
Symbol/Exchange
Company Name
Industry Group |
PRICE |
CHANGE
(%Change) |
Day High |
Volume
(% DAV)
(% 50 day avg vol) |
52 Wk Hi
% From Hi |
Featured
Date |
Price
Featured |
Pivot Featured |
|
Max Buy |
HMSY
-
NASDAQ
H M S Holdings Corp
COMPUTER SOFTWARE and SERVICES - Healthcare Information Service
|
$61.35
|
+0.04
0.07% |
$61.55
|
126,999
75.01% of 50 DAV
50 DAV is 169,300
|
$61.98
-1.02%
|
9/27/2010
|
$57.97
|
PP = $58.36
|
|
MB = $61.28
|
Most Recent Note - 10/15/2010 1:15:51 PM
G - Reversed into the red after early gains today for a new high. In recent sessions it dipped below its "max buy" level and continued inching higher without great volume conviction behind gains since 9/27/10 when featured in yellow.
>>> The latest Featured Stock Update with an annotated graph appeared on 9/27/2010. Click here.
View all notes |
Alert me of new notes |
CANSLIM.net Company Profile |
SEC |
Zacks Reports |
StockTalk |
News |
Chart |
Request a new note
C
A N
S L
I M
|
HS
-
NYSE
Healthspring Inc
HEALTH SERVICES - Health Care Plans
|
$27.37
|
+0.60
2.24% |
$27.49
|
525,329
75.24% of 50 DAV
50 DAV is 698,200
|
$27.10
1.00%
|
8/27/2010
|
$19.91
|
PP = $19.75
|
|
MB = $20.74
|
Most Recent Note - 10/18/2010 4:15:02 PM
G - Gain today with light volume for a new all-time high. Support to watch is prior chart highs in the $19-20 area.
>>> The latest Featured Stock Update with an annotated graph appeared on 8/27/2010. Click here.
View all notes |
Alert me of new notes |
CANSLIM.net Company Profile |
SEC |
Zacks Reports |
StockTalk |
News |
Chart |
Request a new note
C
A N
S L
I M
|
IGTE
-
NASDAQ
Igate Corp
COMPUTER SOFTWARE and SERVICES - Information Technology Service
|
$18.64
|
+0.20
1.08% |
$18.73
|
367,781
81.10% of 50 DAV
50 DAV is 453,500
|
$19.45
-4.16%
|
9/8/2010
|
$17.29
|
PP = $18.26
|
|
MB = $19.17
|
Most Recent Note - 10/13/2010 11:00:12 AM
Y - Gapped up again today and quickly reversed into the red, volatile and actively trading after another strong earnings report. Last week it ended by rallying from important chart support at its 50 DMA line back to near its pivot point. More damaging losses would raise concerns and trigger technical sell signals.
>>> The latest Featured Stock Update with an annotated graph appeared on 9/10/2010. Click here.
View all notes |
Alert me of new notes |
CANSLIM.net Company Profile |
SEC |
Zacks Reports |
StockTalk |
News |
Chart |
Request a new note
C
A N
S L
I M
|
JOBS
-
NASDAQ
Fifty One Job Inc Ads
DIVERSIFIED SERVICES - Staffing and; Outsourcing Service
|
$44.69
|
+1.29
2.97% |
$44.74
|
234,397
131.31% of 50 DAV
50 DAV is 178,500
|
$46.48
-3.85%
|
10/13/2010
|
$42.07
|
PP = $40.60
|
|
MB = $42.63
|
Most Recent Note - 10/18/2010 12:28:46 PM
G - Rallying back for gains after a small gap down today led to brief trading below its "max buy" level.
>>> The latest Featured Stock Update with an annotated graph appeared on 9/16/2010. Click here.
View all notes |
Alert me of new notes |
CANSLIM.net Company Profile |
SEC |
Zacks Reports |
StockTalk |
News |
Chart |
Request a new note
C
A N
S L
I M
|
LFT
-
NYSE
Longtop Financl Tech Ads
COMPUTER SOFTWARE and SERVICES - Business Software and Services
|
$39.84
|
+0.84
2.15% |
$40.00
|
480,561
106.20% of 50 DAV
50 DAV is 452,500
|
$41.77
-4.62%
|
10/14/2010
|
$39.97
|
PP = $41.87
|
|
MB = $43.96
|
Most Recent Note - 10/18/2010 4:17:30 PM
Y - Up with average volume today after finding prompt support near its 50 DMA line on 10/15/10 following a gap down. It has formed a 10-month long flat base and maintained a very strong sales revenues and earnings track record. It returned to the Featured Stocks list on 10/14/10 and was noted - "Patient and disciplined investors will resist the urge to get in 'early' and wait for a proper buy signal."
>>> The latest Featured Stock Update with an annotated graph appeared on 10/14/2010. Click here.
View all notes |
Alert me of new notes |
CANSLIM.net Company Profile |
SEC |
Zacks Reports |
StockTalk |
News |
Chart |
Request a new note
C
A N
S L
I M
|
Symbol/Exchange
Company Name
Industry Group |
PRICE |
CHANGE
(%Change) |
Day High |
Volume
(% DAV)
(% 50 day avg vol) |
52 Wk Hi
% From Hi |
Featured
Date |
Price
Featured |
Pivot Featured |
|
Max Buy |
LULU
-
NASDAQ
Lululemon Athletica
MANUFACTURING - Textile Manufacturing
|
$45.59
|
-0.44
-0.96% |
$45.87
|
1,107,511
100.39% of 50 DAV
50 DAV is 1,103,200
|
$48.45
-5.90%
|
10/8/2010
|
$47.66
|
PP = $46.67
|
|
MB = $49.00
|
Most Recent Note - 10/14/2010 2:44:03 PM
Y - Volume totals have been near average while consolidating near its prior highs since its 10/08/10 technical breakout with heavier volume was noted. Prior highs in the $45-46 area define initial chart support to watch.
>>> The latest Featured Stock Update with an annotated graph appeared on 10/8/2010. Click here.
View all notes |
Alert me of new notes |
CANSLIM.net Company Profile |
SEC |
Zacks Reports |
StockTalk |
News |
Chart |
Request a new note
C
A N
S L
I M
|
MELI
-
NASDAQ
Mercadolibre Inc
INTERNET - Internet Software and; Services
|
$62.94
|
-2.32
-3.56% |
$65.48
|
885,388
99.05% of 50 DAV
50 DAV is 893,900
|
$76.81
-18.06%
|
5/13/2010
|
$54.21
|
PP = $55.85
|
|
MB = $58.64
|
Most Recent Note - 10/18/2010 2:22:59 PM
G - Today's loss has it -18% off its 52-week high and poised to possibly close below its 8/25/10, which would be another sign of weakness and technical deterioration.
>>> The latest Featured Stock Update with an annotated graph appeared on 8/26/2010. Click here.
View all notes |
Alert me of new notes |
CANSLIM.net Company Profile |
SEC |
Zacks Reports |
StockTalk |
News |
Chart |
Request a new note
C
A N
S L
I M
|
MRX
-
NYSE
Medicis Pharmaceut Cl A
DRUGS - Biotechnology
|
$30.36
|
+0.50
1.67% |
$30.43
|
1,000,286
86.41% of 50 DAV
50 DAV is 1,157,600
|
$30.94
-1.87%
|
8/12/2010
|
$26.88
|
PP = $26.71
|
|
MB = $28.05
|
Most Recent Note - 10/14/2010 4:42:17 PM
G - Consolidating from its 52-week high reached on the prior session, today it closed near the previously noted upward trendline, the initial chart support level to watch above its 50 DMA line and its recent chart lows.
>>> The latest Featured Stock Update with an annotated graph appeared on 10/4/2010. Click here.
View all notes |
Alert me of new notes |
CANSLIM.net Company Profile |
SEC |
Zacks Reports |
StockTalk |
News |
Chart |
Request a new note
C
A N
S L
I M
|
MWIV
-
NASDAQ
M W I Veterinary Supply
HEALTH SERVICES - Medical Instruments and; Supplies
|
$57.00
|
+0.17
0.30% |
$57.75
|
53,275
84.83% of 50 DAV
50 DAV is 62,800
|
$59.50
-4.20%
|
7/29/2010
|
$52.05
|
PP = $52.09
|
|
MB = $54.69
|
Most Recent Note - 10/15/2010 1:31:43 PM
G - Enduring mild distributional pressure this week, it remains perched near its 52-week high. No overhead supply remains to act as resistance. Its nearby 50 DMA line defines chart support.
>>> The latest Featured Stock Update with an annotated graph appeared on 9/7/2010. Click here.
View all notes |
Alert me of new notes |
CANSLIM.net Company Profile |
SEC |
Zacks Reports |
StockTalk |
News |
Chart |
Request a new note
C
A N
S L
I M
|
NEM
-
NYSE
Newmont Mining Corp
METALS and MINING - Gold
|
$62.49
|
+0.61
0.99% |
$62.81
|
5,375,203
87.91% of 50 DAV
50 DAV is 6,114,500
|
$65.50
-4.60%
|
8/31/2010
|
$61.32
|
PP = $63.48
|
|
MB = $66.65
|
Most Recent Note - 10/15/2010 3:20:29 PM
Y - Gapped down today. Despite recent strength in the Mining - Gold/Silver/Gems group (L criteria), NEM's Relative Strength rank (77) and RS line have been waning for several weeks, a recently noted concern.
>>> The latest Featured Stock Update with an annotated graph appeared on 9/14/2010. Click here.
View all notes |
Alert me of new notes |
CANSLIM.net Company Profile |
SEC |
Zacks Reports |
StockTalk |
News |
Chart |
Request a new note
C
A N
S L
I M
|
Symbol/Exchange
Company Name
Industry Group |
PRICE |
CHANGE
(%Change) |
Day High |
Volume
(% DAV)
(% 50 day avg vol) |
52 Wk Hi
% From Hi |
Featured
Date |
Price
Featured |
Pivot Featured |
|
Max Buy |
NEOG
-
NASDAQ
Neogen Corp
DRUGS - Diagnostic Substances
|
$36.19
|
+0.64
1.80% |
$36.21
|
50,218
48.38% of 50 DAV
50 DAV is 103,800
|
$35.50
1.94%
|
9/1/2010
|
$30.79
|
PP = $30.49
|
|
MB = $32.01
|
Most Recent Note - 10/18/2010 4:19:43 PM
G - Gain today with below average volume for a new high close. Prior highs in the $30 area define initial support to watch.
>>> The latest Featured Stock Update with an annotated graph appeared on 10/13/2010. Click here.
View all notes |
Alert me of new notes |
CANSLIM.net Company Profile |
SEC |
Zacks Reports |
StockTalk |
News |
Chart |
Request a new note
C
A N
S L
I M
|
NFLX
-
NASDAQ
Netflix Inc
SPECIALTY RETAIL - Music and Video Stores
|
$153.00
|
-2.72
-1.75% |
$156.65
|
2,853,456
50.30% of 50 DAV
50 DAV is 5,673,000
|
$174.40
-12.27%
|
8/10/2010
|
$124.05
|
PP = $124.00
|
|
MB = $130.20
|
Most Recent Note - 10/18/2010 4:08:08 PM
G - Continuing its consolidation in a tight range with volume totals continuing to cool in the weeks following the "negative reversal" at its all-time high on 9/30/10. Its recent chart low ($148.05) and 50 DMA line are the next chart support levels to watch.
>>> The latest Featured Stock Update with an annotated graph appeared on 10/1/2010. Click here.
View all notes |
Alert me of new notes |
CANSLIM.net Company Profile |
SEC |
Zacks Reports |
StockTalk |
News |
Chart |
Request a new note
C
A N
S L
I M
|
NTAP
-
NASDAQ
Netapp Inc
COMPUTER HARDWARE - Data Storage Devices
|
$50.30
|
-0.03
-0.06% |
$50.35
|
5,187,640
60.21% of 50 DAV
50 DAV is 8,616,600
|
$51.40
-2.14%
|
9/8/2010
|
$46.98
|
PP = $44.99
|
|
MB = $47.24
|
Most Recent Note - 10/13/2010 5:35:29 PM
G - Consolidating above its 50 DMA line and prior highs that now coincide to define chart support in the $45 area.
>>> The latest Featured Stock Update with an annotated graph appeared on 9/8/2010. Click here.
View all notes |
Alert me of new notes |
CANSLIM.net Company Profile |
SEC |
Zacks Reports |
StockTalk |
News |
Chart |
Request a new note
C
A N
S L
I M
|
ORCL
-
NASDAQ
Oracle Corp
COMPUTER SOFTWARE and SERVICES - Application Software
|
$29.23
|
+0.33
1.14% |
$29.23
|
35,789,772
94.20% of 50 DAV
50 DAV is 37,994,700
|
$28.91
1.11%
|
9/20/2010
|
$27.32
|
PP = $26.73
|
|
MB = $28.07
|
Most Recent Note - 10/15/2010 6:28:00 PM
G - Gains today and Wednesday with greater volume conviction have it now extended slightly beyond its "max buy" level.
>>> The latest Featured Stock Update with an annotated graph appeared on 9/20/2010. Click here.
View all notes |
Alert me of new notes |
CANSLIM.net Company Profile |
SEC |
Zacks Reports |
StockTalk |
News |
Chart |
Request a new note
C
A N
S L
I M
|
PAY
-
NYSE
Verifone Systems Inc
COMPUTER HARDWARE - Transaction Automation Systems
|
$29.20
|
+0.31
1.07% |
$29.27
|
821,233
57.05% of 50 DAV
50 DAV is 1,439,400
|
$31.40
-7.01%
|
8/25/2010
|
$24.30
|
PP = $23.74
|
|
MB = $24.93
|
Most Recent Note - 10/12/2010 5:07:06 PM
G - Closed near the session high today with a 4th consecutive gain on light volume. Consolidating above support at its 50 DMA line (now $25.78) after recent distributional pressure.
>>> The latest Featured Stock Update with an annotated graph appeared on 8/30/2010. Click here.
View all notes |
Alert me of new notes |
CANSLIM.net Company Profile |
SEC |
Zacks Reports |
StockTalk |
News |
Chart |
Request a new note
C
A N
S L
I M
|
Symbol/Exchange
Company Name
Industry Group |
PRICE |
CHANGE
(%Change) |
Day High |
Volume
(% DAV)
(% 50 day avg vol) |
52 Wk Hi
% From Hi |
Featured
Date |
Price
Featured |
Pivot Featured |
|
Max Buy |
PRGO
-
NASDAQ
Perrigo Co
DRUGS - Drug Related Products
|
$64.67
|
-0.36
-0.55% |
$65.39
|
1,123,689
121.43% of 50 DAV
50 DAV is 925,400
|
$67.94
-4.81%
|
9/15/2010
|
$63.73
|
PP = $64.76
|
|
MB = $68.00
|
Most Recent Note - 10/12/2010 5:17:54 PM
Y - Gain today with light volume led to its best ever close by just a few cents. Its action has been healthy and volume totals have cooled in recent weeks while it has consolidated in a tight range between its pivot point and "max buy" levels
>>> The latest Featured Stock Update with an annotated graph appeared on 9/15/2010. Click here.
View all notes |
Alert me of new notes |
CANSLIM.net Company Profile |
SEC |
Zacks Reports |
StockTalk |
News |
Chart |
Request a new note
C
A N
S L
I M
|
RAX
-
NYSE
Rackspace Hosting Inc
INTERNET - Internet Software and; Services
|
$23.48
|
-0.11
-0.47% |
$24.06
|
952,721
39.00% of 50 DAV
50 DAV is 2,442,700
|
$26.50
-11.40%
|
9/21/2010
|
$22.84
|
PP = $23.61
|
|
MB = $24.79
|
Most Recent Note - 10/14/2010 2:14:48 PM
Y - Pulling back today, trading near recent low closes. Color code was changed to yellow while rebounding following its damaging gap down on 10/06/10. Recent lows in the $22.40 area define chart support above its 50 DMA line.
>>> The latest Featured Stock Update with an annotated graph appeared on 9/21/2010. Click here.
View all notes |
Alert me of new notes |
CANSLIM.net Company Profile |
SEC |
Zacks Reports |
StockTalk |
News |
Chart |
Request a new note
C
A N
S L
I M
|
ROVI
-
NASDAQ
Rovi Corp
COMPUTER SOFTWARE andamp; SERVICES - Security Software andamp; Services
|
$49.20
|
-0.30
-0.61% |
$49.50
|
576,123
38.38% of 50 DAV
50 DAV is 1,501,100
|
$53.00
-7.17%
|
8/31/2010
|
$43.31
|
PP = $45.06
|
|
MB = $47.31
|
Most Recent Note - 10/12/2010 5:35:40 PM
G - Volume totals have been cooling recently while consolidating in a healthy fashion well above support at prior highs and its 50 DMA line coinciding in the $45 area.
>>> The latest Featured Stock Update with an annotated graph appeared on 8/24/2010. Click here.
View all notes |
Alert me of new notes |
CANSLIM.net Company Profile |
SEC |
Zacks Reports |
StockTalk |
News |
Chart |
Request a new note
C
A N
S L
I M
|
SHOO
-
NASDAQ
Steven Madden Limited
CONSUMER NON-DURABLES - Textile - Apparel Footwear
|
$43.71
|
+0.06
0.14% |
$43.78
|
113,635
28.30% of 50 DAV
50 DAV is 401,600
|
$44.85
-2.54%
|
9/15/2010
|
$38.94
|
PP = $40.27
|
|
MB = $42.28
|
Most Recent Note - 10/15/2010 6:34:20 PM
G - Hovering near its 52-week high, stubbornly holding its ground with volume totals cooling. Prior highs in the $40 area define chart support to watch now.
>>> The latest Featured Stock Update with an annotated graph appeared on 9/29/2010. Click here.
View all notes |
Alert me of new notes |
CANSLIM.net Company Profile |
SEC |
Zacks Reports |
StockTalk |
News |
Chart |
Request a new note
C
A N
S L
I M
|
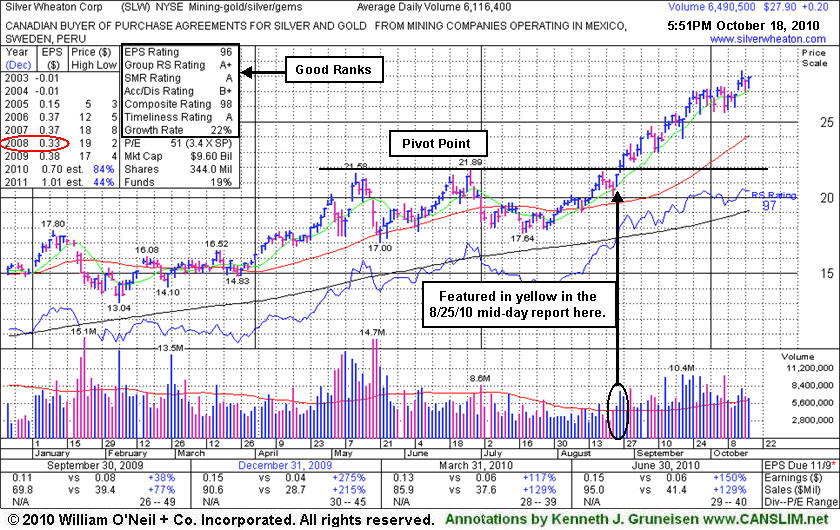
SLW
-
NYSE
Silver Wheaton Corp
METALS and; MINING - Silver
|
$27.90
|
+0.20
0.72% |
$27.90
|
6,519,504
107.98% of 50 DAV
50 DAV is 6,037,900
|
$27.71
0.69%
|
8/25/2010
|
$21.40
|
PP = $21.99
|
|
MB = $23.09
|
Most Recent Note - 10/14/2010 1:19:14 PM
G - Hit another new all-time high today, quietly wedging higher after a short consolidation. Its 50 DMA line defines chart support to watch.
>>> The latest Featured Stock Update with an annotated graph appeared on 10/18/2010. Click here.
View all notes |
Alert me of new notes |
CANSLIM.net Company Profile |
SEC |
Zacks Reports |
StockTalk |
News |
Chart |
Request a new note
C
A N
S L
I M
|
Symbol/Exchange
Company Name
Industry Group |
PRICE |
CHANGE
(%Change) |
Day High |
Volume
(% DAV)
(% 50 day avg vol) |
52 Wk Hi
% From Hi |
Featured
Date |
Price
Featured |
Pivot Featured |
|
Max Buy |
SVR
-
NYSE
Syniverse Holdings Inc
TELECOMMUNICATIONS - Diversified Communication Serv
|
$23.69
|
+0.31
1.33% |
$23.76
|
338,098
46.07% of 50 DAV
50 DAV is 733,900
|
$24.24
-2.27%
|
9/22/2010
|
$23.60
|
PP = $23.87
|
|
MB = $25.06
|
Most Recent Note - 10/15/2010 6:37:53 PM
Y - Perched -3.6% off its 52-week high today, its color code was changed to yellow after recovering with recent light volume gains since finding prompt support near its 50 DMA line. Confirming gains for a new high close with heavy volume would be a bullish sign, meanwhile the recent chart low ($21.47) defines important support to watch.
>>> The latest Featured Stock Update with an annotated graph appeared on 9/22/2010. Click here.
View all notes |
Alert me of new notes |
CANSLIM.net Company Profile |
SEC |
Zacks Reports |
StockTalk |
News |
Chart |
Request a new note
C
A N
S L
I M
|
UA
-
NYSE
Under Armour Inc Cl A
CONSUMER NON-DURABLES - Textile - Apparel Clothing
|
$46.23
|
+0.61
1.34% |
$46.28
|
395,418
54.41% of 50 DAV
50 DAV is 726,700
|
$48.00
-3.69%
|
9/9/2010
|
$39.99
|
PP = $40.10
|
|
MB = $42.11
|
Most Recent Note - 10/15/2010 3:21:51 PM
G - Hovering near its 52-week high with volume totals cooling after volume-driven gains. Company is due to report earnings on Oct 26th.
>>> The latest Featured Stock Update with an annotated graph appeared on 9/9/2010. Click here.
View all notes |
Alert me of new notes |
CANSLIM.net Company Profile |
SEC |
Zacks Reports |
StockTalk |
News |
Chart |
Request a new note
C
A N
S L
I M
|
UFPT
-
NASDAQ
U F P Tech Inc
CONSUMER NON-DURABLES - Packaging and Containers
|
$12.99
|
+0.04
0.27% |
$13.32
|
106,825
180.45% of 50 DAV
50 DAV is 59,200
|
$13.28
-2.18%
|
9/16/2010
|
$11.20
|
PP = $11.69
|
|
MB = $12.27
|
Most Recent Note - 10/18/2010 4:22:11 PM
G - Touched a new 52-week high today then erased most of its gain and closed near the session low. Prior highs in the $11 area define chart support to watch.
>>> The latest Featured Stock Update with an annotated graph appeared on 9/17/2010. Click here.
View all notes |
Alert me of new notes |
CANSLIM.net Company Profile |
SEC |
Zacks Reports |
StockTalk |
News |
Chart |
Request a new note
C
A N
S L
I M
|
ULTA
-
NASDAQ
Ulta Salon Cosm & Frag
SPECIALTY RETAIL - Specialty Retail, Other
|
$31.66
|
+0.65
2.10% |
$31.73
|
498,043
75.32% of 50 DAV
50 DAV is 661,200
|
$31.56
0.32%
|
9/3/2010
|
$26.36
|
PP = $25.89
|
|
MB = $27.18
|
Most Recent Note - 10/18/2010 4:18:49 PM
G - Gain with light volume today for a new 52-week high. Prior highs and its 50 DMA line coincide in the $26 area defining support to watch. No overhead supply remains to act as resistance.
>>> The latest Featured Stock Update with an annotated graph appeared on 9/3/2010. Click here.
View all notes |
Alert me of new notes |
CANSLIM.net Company Profile |
SEC |
Zacks Reports |
StockTalk |
News |
Chart |
Request a new note
C
A N
S L
I M
|
VIT
-
NYSE
Vanceinfo Tech Inc Ads
COMPUTER SOFTWARE and SERVICES - Business Software and Services
|
$34.75
|
+0.39
1.14% |
$34.93
|
315,303
47.46% of 50 DAV
50 DAV is 664,300
|
$34.40
1.02%
|
7/8/2010
|
$25.20
|
PP = $26.58
|
|
MB = $27.91
|
Most Recent Note - 10/15/2010 6:39:25 PM
G - Gain today with light volume for another new all-time high, wedging up without great volume conviction. Its 50 DMA line defines chart support to watch.
>>> The latest Featured Stock Update with an annotated graph appeared on 8/31/2010. Click here.
View all notes |
Alert me of new notes |
CANSLIM.net Company Profile |
SEC |
Zacks Reports |
StockTalk |
News |
Chart |
Request a new note
C
A N
S L
I M
|
Symbol/Exchange
Company Name
Industry Group |
PRICE |
CHANGE
(%Change) |
Day High |
Volume
(% DAV)
(% 50 day avg vol) |
52 Wk Hi
% From Hi |
Featured
Date |
Price
Featured |
Pivot Featured |
|
Max Buy |
WCRX
-
NASDAQ
Warner Chilcott Plc
DRUGS - Drug Manufacturers - Other
|
$24.11
|
-0.40
-1.63% |
$24.63
|
1,815,183
62.09% of 50 DAV
50 DAV is 2,923,700
|
$30.57
-21.13%
|
8/23/2010
|
$21.04
|
PP = $20.84
|
|
MB = $21.88
|
Most Recent Note - 10/18/2010 4:24:45 PM
G - Quietly consolidating after a burst of buying last week drove it to all-time highs. Prior highs near $23.50 define near-term support above its 50 DMA line.
>>> The latest Featured Stock Update with an annotated graph appeared on 10/15/2010. Click here.
View all notes |
Alert me of new notes |
CANSLIM.net Company Profile |
SEC |
Zacks Reports |
StockTalk |
News |
Chart |
Request a new note
C
A N
S L
I M
|