You are not logged in.
This means you
CAN ONLY VIEW reports that were published prior to Monday, April 14, 2025.
You
MUST UPGRADE YOUR MEMBERSHIP if you want to see any current reports.
AFTER MARKET UPDATE - MONDAY, OCTOBER 17TH, 2011
Previous After Market Report Next After Market Report >>>
|
|
|
|
DOW |
-246.81 |
11,397.68 |
-2.12% |
|
Volume |
905,583,970 |
+7% |
|
Volume |
1,633,480,290 |
+1% |
|
NASDAQ |
-52.93 |
2,614.92 |
-1.98% |
|
Advancers |
572 |
18% |
|
Advancers |
464 |
18% |
|
S&P 500 |
-23.71 |
1,200.87 |
-1.94% |
|
Decliners |
2,456 |
79% |
|
Decliners |
2,076 |
78% |
|
Russell 2000 |
-23.86 |
688.60 |
-3.35% |
|
52 Wk Highs |
19 |
|
|
52 Wk Highs |
19 |
|
|
S&P 600 |
-12.65 |
379.82 |
-3.22% |
|
52 Wk Lows |
14 |
|
|
52 Wk Lows |
33 |
|
|
 |
Major Averages Endure Distributional Pressure Again
Kenneth J. Gruneisen - Passed the CAN SLIM® Master's Exam
On Monday the major averages lost ground in the morning and slumped lower throughout the session. The trading volume totals reported on the NYSE and Nasdaq exchanges were slightly higher than the prior session, whereas lighter volume pullbacks would be a healthier sign. Declining issues led advancing issues by more than 4-1 on the NYSE and on the Nasdaq exchange. New 52-week highs outnumbered new 52-week lows on the NYSE but not on the Nasdaq exchange. There were 11 high-ranked companies from the CANSLIM.net Leaders List that made new 52-week highs and appeared on the CANSLIM.net BreakOuts Page, down from the prior session total of 19 stocks. There were losses for 6 of the 7 high-ranked companies currently included on the Featured Stocks Page.
The market lost ground in early trading after comments from a German government spokesman lowered expectations for a swift resolution to the European debt crisis. Germany said European Union leaders won't provide a complete fix to the euro-area debt crisis at a summit of leaders planned for October 23.
A weaker-than-expected reading of New York region manufacturing also took a toll on the U.S. market. The Empire State manufacturing index for October was minus -8.5, a greater-than-expected contraction. At the same time, September industrial production increased 0.2%, suggesting the U.S. economy is avoiding a recession.
Banks and the energy sector were in focus. Citigroup (C -1.65%) reversed its early gains and finished the session with a loss after earnings beat expectations. El Paso Corp (EP +24.81%) spiked higher after it and Kinder Morgan Inc (KMI +4.83%) planned to combine in a $21 billion transaction that will create the largest U.S. natural-gas pipeline network. Shares of BP Plc (BP +0.73%) edged higher after BP said Anadarko Petroleum Corp (APC +5.48%) will pay $4 billion to settle all claims over last year's Gulf of Mexico oil spill disaster. Lowe's Companies Inc (LOW +0.48%) the home improvement retailer announced it will close 20 under-performing stores, affecting almost 2,000 workers.
Friday's expansion in new highs totals suggested that the market is in the process of producing a healthier crop of strong performing companies which may be a source of leadership to fuel a sustainable rally, but Monday's weakness has quickly put the new uptrend under pressure.
The October 2011 issue of our monthly newsletter CANSLIM.net News will be published soon. The Q3 2011 Webcast (aired on September 28th) is now available "ON DEMAND" - (CLICK HERE) It provides an informative review of current market conditions, leading groups, and best buy candidates. All upgraded members are eligible to access the webcast presentation at no additional cost! Via the Premium Member Homepage links to all prior reports and webcasts are always available.
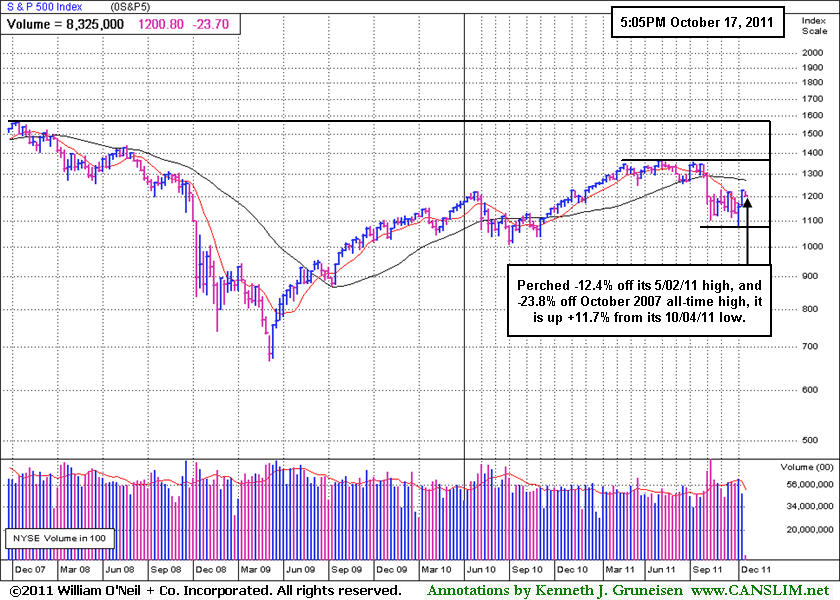
PICTURED: Even with Monday's drop of 23 points, the S&P 500 Index remains near the top of a two-month trading range and +11.7% from its 10/04/11 low. It is perched -12.4% off its 5/02/11 high and -23.8% off its October 2007 all-time high.
|
 Kenneth J. Gruneisen started out as a licensed stockbroker in August 1987, a couple of months prior to the historic stock market crash that took the Dow Jones Industrial Average down -22.6% in a single day. He has published daily fact-based fundamental and technical analysis on high-ranked stocks online for two decades. Through FACTBASEDINVESTING.COM, Kenneth provides educational articles, news, market commentary, and other information regarding proven investment systems that work in good times and bad.
Comments contained in the body of this report are technical opinions only and are not necessarily those of Gruneisen Growth Corp. The material herein has been obtained from sources believed to be reliable and accurate, however, its accuracy and completeness cannot be guaranteed. Our firm, employees, and customers may effect transactions, including transactions contrary to any recommendation herein, or have positions in the securities mentioned herein or options with respect thereto. Any recommendation contained in this report may not be suitable for all investors and it is not to be deemed an offer or solicitation on our part with respect to the purchase or sale of any securities. |
|
 |
Financial, Tech, Energy, and Defensive Groups Fell
Kenneth J. Gruneisen - Passed the CAN SLIM® Master's Exam
Financial shares were among Monday's worst laggards as the Bank Index ($BKX -3.92%) and Broker/Dealer Index ($XBD -2.85%) slid. The Networking Index ($NWX -3.82%), Semiconductor Index ($SOX -2.77%), Biotechnology Index ($BTK -2.59%), and Internet Index ($IIX -2.03%) suffered unanimous losses. The Healthcare Index ($HMO -2.73%) and Gold & Silver Index ($XAU -2.50%) gave defensive investors no reward. Energy-related shares had a negative bias as the Oil Services Index ($OSX -3.77%) outpaced the Integrated Oil Index ($XOI -1.15%) to the downside. The Retail Index ($RLX -1.31%) held up better than most groups, but it also faced pressure on the widely negative session.
Charts courtesy www.stockcharts.com
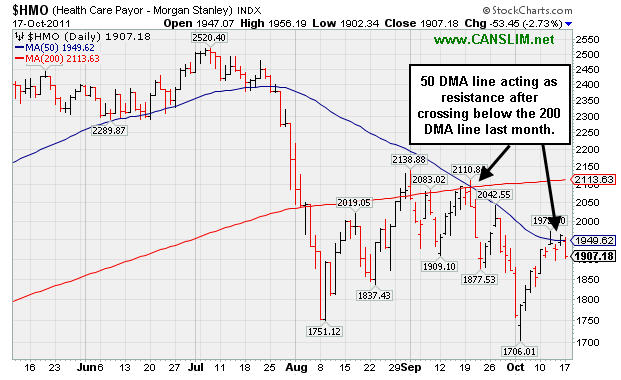
PICTURED: The Healthcare Index's ($HMO -2.73%) 50-day moving average (DMA) line has been acting as resistance after crossing below the 200 DMA line last month.
| Oil Services |
$OSX |
210.21 |
-8.23 |
-3.77% |
-14.24% |
| Healthcare |
$HMO |
1,907.18 |
-53.45 |
-2.73% |
+12.72% |
| Integrated Oil |
$XOI |
1,146.76 |
-13.37 |
-1.15% |
-5.47% |
| Semiconductor |
$SOX |
370.31 |
-10.55 |
-2.77% |
-10.08% |
| Networking |
$NWX |
232.55 |
-9.24 |
-3.82% |
-17.11% |
| Internet |
$IIX |
289.64 |
-6.01 |
-2.03% |
-5.88% |
| Broker/Dealer |
$XBD |
83.85 |
-2.46 |
-2.85% |
-31.00% |
| Retail |
$RLX |
532.33 |
-7.04 |
-1.31% |
+4.71% |
| Gold & Silver |
$XAU |
192.83 |
-4.94 |
-2.50% |
-14.90% |
| Bank |
$BKX |
36.51 |
-1.49 |
-3.92% |
-30.07% |
| Biotech |
$BTK |
1,116.20 |
-29.67 |
-2.59% |
-13.98% |
|
|
|
 |
Flaws Call For Extra Caution Without Powerful Burst Of Buying
Kenneth J. Gruneisen - Passed the CAN SLIM® Master's Exam
Often, when a leading stock is setting up to breakout of a solid base, it is highlighted in CANSLIM.net's Mid-Day Breakouts Report. The most relevant factors are noted in the report which allows prudent CANSLIM oriented investors to place the issue in their watch list. After doing any necessary backup research, the investor is prepared to act if and when the stock triggers a technical buy signal (breaks above its pivot point on more than +50% average turnover). In the event the stock fails to trigger a technical buy signal and its price declines then it will simply be removed from the watch list.
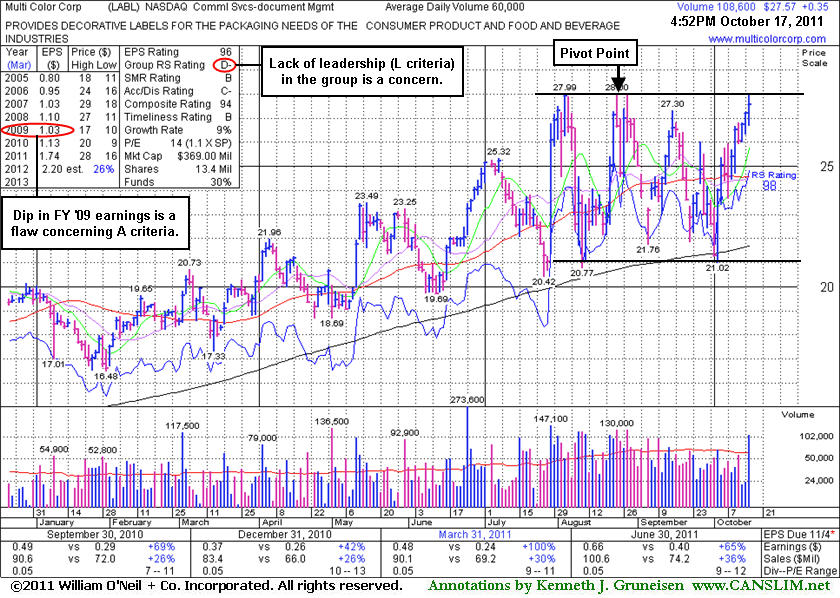
Multi Color Corp (LABL +$0.35 or +1.29% to $27.57) is perched near its 52-week high today after a choppy 10-week consolidation during which its 200-day moving average (DMA) line acted as support. No overhead supply remains to act as resistance. In the mid-day report earlier today (read here) its color code was changed to yellow with pivot point cited based on its 52-week high plus 10 cents.
Subsequent volume-driven gains into new high ground may trigger a technical buy signal. It reported earnings +65% on +36% sales revenues for the quarter ended June 30, 2011. Annual earnings (A criteria) history included a slight dip in FY '09 earnings, a fundamental flaw. The lack of leadership (L criteria) in the Commercial Services - Document Management group is also a concern. Those noted shortcomings call for caution, especially after its rally stright up from the bottom of its choppy base. A powerful volume-driven breakout could signal that institutional (I criteria) buyers are accumulating shares, but without that fresh proof disciplined investors know to wait and watch. Pyramiding can also be a helpful tactic to let the subsequent market action dictate how heavily invested one may get.
|
|
|
Color Codes Explained :
Y - Better candidates highlighted by our
staff of experts.
G - Previously featured
in past reports as yellow but may no longer be buyable under the
guidelines.
***Last / Change / Volume data in this table is the closing quote data***
Symbol/Exchange
Company Name
Industry Group |
PRICE |
CHANGE
(%Change) |
Day High |
Volume
(% DAV)
(% 50 day avg vol) |
52 Wk Hi
% From Hi |
Featured
Date |
Price
Featured |
Pivot Featured |
|
Max Buy |
AAPL
-
NASDAQ
Apple Inc
COMPUTER HARDWARE - Personal Computers
|
$419.99
|
-2.01
-0.48% |
$426.70
|
24,460,598
107.11% of 50 DAV
50 DAV is 22,836,300
|
$422.86
-0.68%
|
9/16/2011
|
$399.14
|
PP = $404.60
|
|
MB = $424.83
|
Most Recent Note - 10/14/2011 3:07:29 PM
G - On track for a 5th consecutive gain and poised to finish at a best-ever close after gapping up today. It has not formed a sound base pattern.
>>> The latest Featured Stock Update with an annotated graph appeared on 10/6/2011. Click here.
View all notes |
Alert me of new notes |
CANSLIM.net Company Profile |
SEC |
Zacks Reports |
StockTalk |
News |
Chart |
Request a new note
C
A N
S L
I M


|
ALXN
-
NASDAQ
Alexion Pharmaceuticals
DRUGS - Drug Manufacturers - Other
|
$66.21
|
-0.59
-0.88% |
$67.79
|
634,312
37.91% of 50 DAV
50 DAV is 1,673,400
|
$70.20
-5.68%
|
9/15/2011
|
$63.20
|
PP = $60.81
|
|
MB = $63.85
|
Most Recent Note - 10/14/2011 3:08:50 PM
G - Hovering near its all-time high with volume totals recently cooling. This high-ranked Medical - Biomed/Biotech group leader is extended from its prior base. Support to watch includes prior resistance in the $59-60 area and its upwardly tilted 50 DMA line.
>>> The latest Featured Stock Update with an annotated graph appeared on 10/5/2011. Click here.
View all notes |
Alert me of new notes |
CANSLIM.net Company Profile |
SEC |
Zacks Reports |
StockTalk |
News |
Chart |
Request a new note
C
A N
S L
I M
|
CELG
-
NASDAQ
Celgene Corp
DRUGS - Drug Manufacturers - Major
|
$64.85
|
-1.45
-2.19% |
$66.27
|
3,277,640
77.67% of 50 DAV
50 DAV is 4,220,200
|
$67.01
-3.22%
|
9/16/2011
|
$61.21
|
PP = $62.59
|
|
MB = $65.72
|
 Most Recent Note - 10/17/2011 4:06:12 PM
Y - Color code is changed to yellow after dipping under its "max buy" level today, pulling back from its 52-week high with below average volume. No resistance remains due to overhead supply after a 10/10/11 gap up.
>>> The latest Featured Stock Update with an annotated graph appeared on 10/14/2011. Click here.
View all notes |
Alert me of new notes |
CANSLIM.net Company Profile |
SEC |
Zacks Reports |
StockTalk |
News |
Chart |
Request a new note
C
A N
S L
I M
|
LABL
-
NASDAQ
Multi Color Corp
CONSUMER NON-DURABLES - Packaging and Containers
|
$27.57
|
+0.35
1.29% |
$28.00
|
108,636
181.06% of 50 DAV
50 DAV is 60,000
|
$28.00
-1.54%
|
10/17/2011
|
$27.81
|
PP = $28.10
|
|
MB = $29.51
|
Most Recent Note - 10/17/2011 5:34:47 PM
Y - Perched near its 52-week high after today's gain with above average volume. During a choppy 10-week consolidation its 200 DMA line acted as support. No overhead supply remains to act as resistance. In the mid-day report its color code was changed to yellow with pivot point cited based on its 52-week high plus 10 cents. Subsequent volume-driven gains into new high ground may trigger a technical buy signal. Reported earnings +65% on +36% sales revenues for the quarter ended June 30, 2011. Annual earnings (A criteria) history included a slight dip in FY '09 earnings. See the latest FSU analysis for more details and an annotated graph.
>>> The latest Featured Stock Update with an annotated graph appeared on 10/17/2011. Click here.
View all notes |
Alert me of new notes |
CANSLIM.net Company Profile |
SEC |
Zacks Reports |
StockTalk |
News |
Chart |
Request a new note
C
A N
S L
I M
|
MG
-
NYSE
Mistras Group Inc
DIVERSIFIED SERVICES - Bulding and Faci;ity Management Services
|
$22.15
|
-0.61
-2.68% |
$22.75
|
157,143
64.40% of 50 DAV
50 DAV is 244,000
|
$23.00
-3.70%
|
8/10/2011
|
$17.89
|
PP = $17.58
|
|
MB = $18.46
|
Most Recent Note - 10/17/2011 4:07:55 PM
G - Pulled back on lighter volume today after 4 consecutive gains with higher volume. No resistance remains due to overhead supply as it hovers near its all-time high. Recently reported earnings +83% on +34% sales revenues for the quarter ended August 31, 2011 versus the year ago period.
>>> The latest Featured Stock Update with an annotated graph appeared on 10/12/2011. Click here.
View all notes |
Alert me of new notes |
CANSLIM.net Company Profile |
SEC |
Zacks Reports |
StockTalk |
News |
Chart |
Request a new note
C
A N
S L
I M
|
Symbol/Exchange
Company Name
Industry Group |
PRICE |
CHANGE
(%Change) |
Day High |
Volume
(% DAV)
(% 50 day avg vol) |
52 Wk Hi
% From Hi |
Featured
Date |
Price
Featured |
Pivot Featured |
|
Max Buy |
OPNT
-
NASDAQ
Opnet Technologies
INTERNET - Internet Software and Services
|
$38.45
|
-0.63
-1.61% |
$38.82
|
116,428
68.41% of 50 DAV
50 DAV is 170,200
|
$42.51
-9.55%
|
10/11/2011
|
$38.45
|
PP = $42.02
|
|
MB = $44.12
|
Most Recent Note - 10/17/2011 4:08:47 PM
Y - Holding its ground with volume totals cooling after encountering distributional pressure last week. Disciplined investors would wait to see subsequent gains above its pivot point trigger a technical buy signal before taking action.
>>> The latest Featured Stock Update with an annotated graph appeared on 10/11/2011. Click here.
View all notes |
Alert me of new notes |
CANSLIM.net Company Profile |
SEC |
Zacks Reports |
StockTalk |
News |
Chart |
Request a new note
C
A N
S L
I M
|
V
-
NYSE
Visa Inc Cl A
DIVERSIFIED SERVICES - Business/Management Services
|
$91.19
|
-2.73
-2.91% |
$93.92
|
3,460,680
56.75% of 50 DAV
50 DAV is 6,098,500
|
$94.75
-3.76%
|
9/20/2011
|
$93.91
|
PP = $90.93
|
|
MB = $95.48
|
Most Recent Note - 10/17/2011 4:09:40 PM
G - Pulled back quietly today after 5 consecutive gains with lighter than average volume. Choppy action in recent weeks is not recognized as a sound base pattern.
>>> The latest Featured Stock Update with an annotated graph appeared on 10/10/2011. Click here.
View all notes |
Alert me of new notes |
CANSLIM.net Company Profile |
SEC |
Zacks Reports |
StockTalk |
News |
Chart |
Request a new note
C
A N
S L
I M
|
|
|
|
THESE ARE NOT BUY RECOMMENDATIONS!
Comments contained in the body of this report are technical
opinions only. The material herein has been obtained
from sources believed to be reliable and accurate, however,
its accuracy and completeness cannot be guaranteed.
This site is not an investment advisor, hence it does
not endorse or recommend any securities or other investments.
Any recommendation contained in this report may not
be suitable for all investors and it is not to be deemed
an offer or solicitation on our part with respect to
the purchase or sale of any securities. All trademarks,
service marks and trade names appearing in this report
are the property of their respective owners, and are
likewise used for identification purposes only.
This report is a service available
only to active Paid Premium Members.
You may opt-out of receiving report notifications
at any time. Questions or comments may be submitted
by writing to Premium Membership Services 665 S.E. 10 Street, Suite 201 Deerfield Beach, FL 33441-5634 or by calling 1-800-965-8307
or 954-785-1121.
|
|
|

