You are not logged in.
This means you
CAN ONLY VIEW reports that were published prior to Wednesday, April 9, 2025.
You
MUST UPGRADE YOUR MEMBERSHIP if you want to see any current reports.
AFTER MARKET UPDATE - FRIDAY, OCTOBER 14TH, 2011
Previous After Market Report Next After Market Report >>>
|
|
|
|
DOW |
+166.36 |
11,644.49 |
+1.45% |
|
Volume |
847,188,340 |
-6% |
|
Volume |
1,620,494,570 |
-1% |
|
NASDAQ |
+47.61 |
2,667.85 |
+1.82% |
|
Advancers |
2,528 |
82% |
|
Advancers |
1,897 |
71% |
|
S&P 500 |
+20.92 |
1,224.58 |
+1.74% |
|
Decliners |
494 |
16% |
|
Decliners |
632 |
24% |
|
Russell 2000 |
+13.64 |
712.46 |
+1.95% |
|
52 Wk Highs |
21 |
|
|
52 Wk Highs |
31 |
|
|
S&P 600 |
+6.85 |
392.47 |
+1.78% |
|
52 Wk Lows |
10 |
|
|
52 Wk Lows |
23 |
|
|
 |
New Rally Encouragingly Produces More New Highs
Kenneth J. Gruneisen - Passed the CAN SLIM® Master's Exam
Wall Street finished a banner week with another big rally after retail sales beat estimates and European officials began beefing up plans to attack the debt crisis. For the week, the Dow Jones Industrial Average rose 541 points, or +4.9%. The S&P 500 Index gained 69 points, or +6.0%, its best week since July 2009. The Nasdaq was up 188 points, or +7.6%. On Friday the trading volume totals on the NYSE and Nasdaq exchanges were slightly lower than the prior session while advancing issues beat decliners by 5-1 on the NYSE and by 3-1 on the Nasdaq exchange. New 52-week highs outnumbered new 52-week lows on the Nasdaq exchange and the NYSE, marking the first time that new highs outnumbered new lows on both exchanges since August 31st. There were 19 high-ranked companies from the CANSLIM.net Leaders List that made new 52-week highs and appeared on the CANSLIM.net BreakOuts Page, up from the prior session total of 5 stocks. There were gains for 4 of the 6 high-ranked companies currently included on the Featured Stocks Page.
The Dow Jones Industrial Average posted a third weekly gain, its longest streak since April. The S&P 500 capped off its first back-to-back weekly advance since July. The news from Europe was positive for stocks as a bank rescue plan took shape. European markets added to early gains as officials outlined a rescue plan that may include deeper investor losses on Greek bonds, higher bank capital levels and increased firepower for bailouts and the International Monetary Fund. The plan's elements emerged as finance ministers and central bankers from the Group of 20 began talks in Paris.
September retail sales gained 1.1%, the biggest increase since February, and August sales were revised higher. That report offset a lower-than-expected reading of consumer sentiment. The University of Michigan preliminary October index of consumer sentiment fell to 57.5 from 59.4 a month earlier. Analysts had been expecting a reading above 60.
Rallies in world markets boosted commodity prices. Commodities tallied their biggest weekly increase in six months. Crude oil for November delivery was up more than $2 per barrel in New York, reaching a three-week high. Oil and gas and mining stocks led the broad rally as commodity prices climbed.
Google Inc (GOOG +5.9%) gapped up after demand for online advertising pushed third quarter sales past analysts' estimates. Apple Inc (AAPL +3.3%) finished at its highest ever close as the new iPhone went on sale. Analysts say as many as 4 million units may be sold around the world this weekend.
Thursday's commentary, under the headline, "New Market 'Uptrend' Label Surprises Many", provided details concerning the current market environment (M criteria) which is now considered to be back in a confirmed uptrend. Friday's expansion in new highs totals further suggested that the market is in the process of producing a healthier crop of strong performing companies which may be a source of leadership to fuel a sustainable rally.
The October 2011 issue of our monthly newsletter CANSLIM.net News will be published soon. The Q3 2011 Webcast (aired on September 28th) is now available "ON DEMAND" - (CLICK HERE) It provides an informative review of current market conditions, leading groups, and best buy candidates. All upgraded members are eligible to access the webcast presentation at no additional cost! Via the Premium Member Homepage links to all prior reports and webcasts are always available.
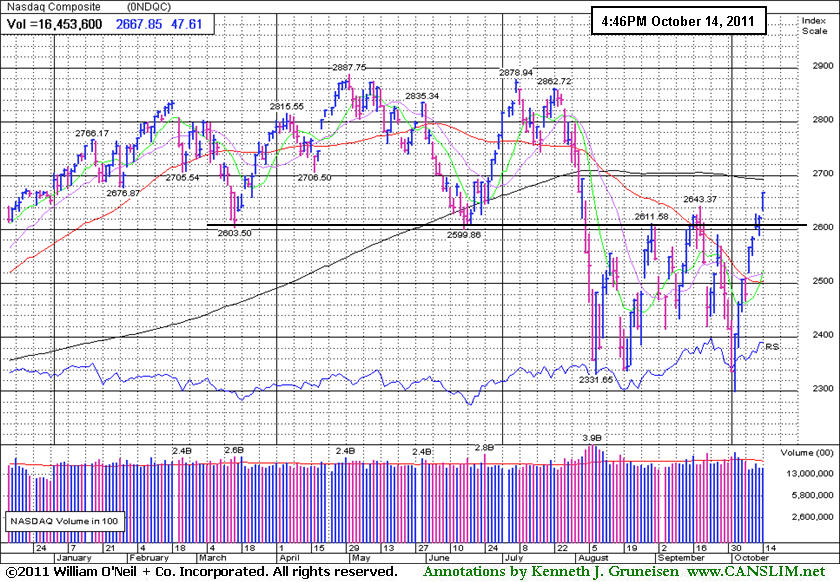
PICTURED: The Nasdaq Composite Index finished near the session high on Friday as it tallied its 8th gain in the span of 9 sessions since hitting its 2011 low which had it -13.3% for the year-to-date (YTD). Gains this week were all on below average volume, however the tech-heavy index has now rallied above its September high. At Friday's close it is +0.57% YTD. Renewed strength in the tech sector has helped it quickly make progress toward its longer-term 200-day moving average (DMA) line.
|
 Kenneth J. Gruneisen started out as a licensed stockbroker in August 1987, a couple of months prior to the historic stock market crash that took the Dow Jones Industrial Average down -22.6% in a single day. He has published daily fact-based fundamental and technical analysis on high-ranked stocks online for two decades. Through FACTBASEDINVESTING.COM, Kenneth provides educational articles, news, market commentary, and other information regarding proven investment systems that work in good times and bad.
Comments contained in the body of this report are technical opinions only and are not necessarily those of Gruneisen Growth Corp. The material herein has been obtained from sources believed to be reliable and accurate, however, its accuracy and completeness cannot be guaranteed. Our firm, employees, and customers may effect transactions, including transactions contrary to any recommendation herein, or have positions in the securities mentioned herein or options with respect thereto. Any recommendation contained in this report may not be suitable for all investors and it is not to be deemed an offer or solicitation on our part with respect to the purchase or sale of any securities. |
|
 |
Commodity-Linked Groups Led Widespread Gains
Kenneth J. Gruneisen - Passed the CAN SLIM® Master's Exam
Commodity-linked groups led Friday's rally as the Gold & Silver Index ($XAU +3.30%), Integrated Oil Index ($XOI +3.32%), and Oil Services Index ($OSX +4.43%) each registered large gains. The tech sector also provided the major averages some substantial lift as the Internet Index ($IIX +2.24%) and Networking Index ($NWX +3.21%) powered up. The Semiconductor Index ($SOX +1.13%) and Biotechnology Index ($BTK +0.50%) followed with smaller gains. There were gains from the Healthcare Index ($HMO +1.84%) and the Retail Index ($RLX +1.99%) too. Financial stocks were the session's laggards, however, as the Bank Index ($BKX +0.56%) and Broker/Dealer Index ($XBD +0.64%) edged higher.
Charts courtesy www.stockcharts.com
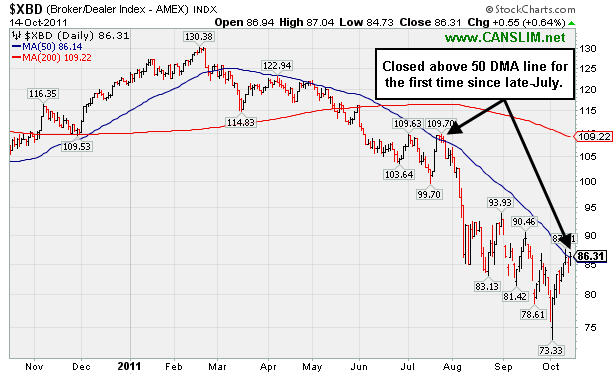
PICTURED 1: The Broker/Dealer Index ($XBD +0.64%) closed above its 50-day moving average (DMA) line for the first time since late-July.
Charts courtesy www.stockcharts.com
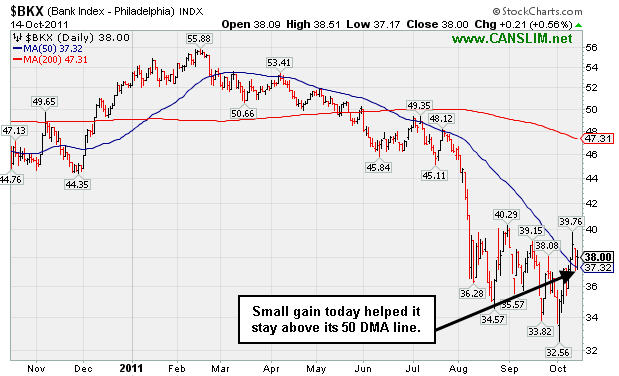
PICTURED 2: The Bank Index 's($BKX +0.56%) small gain helped it stay above its 50 DMA line.
| Oil Services |
$OSX |
218.44 |
+9.26 |
+4.43% |
-10.88% |
| Healthcare |
$HMO |
1,960.63 |
+35.41 |
+1.84% |
+15.88% |
| Integrated Oil |
$XOI |
1,160.13 |
+37.27 |
+3.32% |
-4.37% |
| Semiconductor |
$SOX |
380.86 |
+4.26 |
+1.13% |
-7.52% |
| Networking |
$NWX |
241.79 |
+7.53 |
+3.21% |
-13.82% |
| Internet |
$IIX |
295.65 |
+6.48 |
+2.24% |
-3.92% |
| Broker/Dealer |
$XBD |
86.31 |
+0.55 |
+0.64% |
-28.97% |
| Retail |
$RLX |
539.37 |
+10.52 |
+1.99% |
+6.10% |
| Gold & Silver |
$XAU |
197.77 |
+6.32 |
+3.30% |
-12.72% |
| Bank |
$BKX |
38.00 |
+0.21 |
+0.56% |
-27.22% |
| Biotech |
$BTK |
1,145.87 |
+5.66 |
+0.50% |
-11.69% |
|
|
|
 |
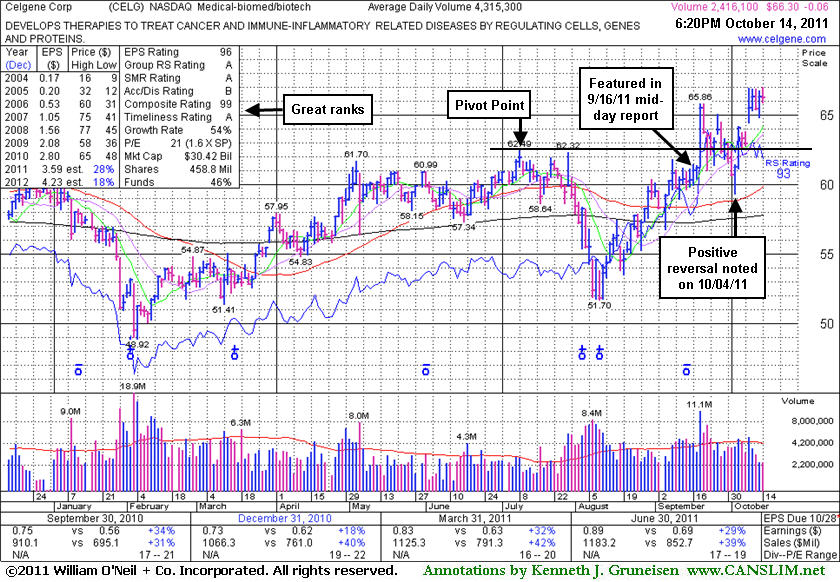
Leader is Slightly Extended Following Latest Gap Up
Kenneth J. Gruneisen - Passed the CAN SLIM® Master's Exam
Celgene Corp (CELG +$0.61 or +1.00% to $61.31) is extended from its prior base, hovering near its 52-week high with volume totals recently cooling. No resistance remains due to overhead supply. Its last appearance in this FSU section was on 10/04/11 with an annotated graph under the headline, "Slumped to Close in Prior Base Following Recent Breakout". That session marked a positive reversal after initially slumping near its 50-day moving average (DMA) line. Healthy stocks do not ordinarily pull back more than -7% below their pivot point, and in this case the stock did not, however, it was noted that disciplined investors may likely have been prompted to sell after a pullback of more than -7% from their purchase price. Worrisome market conditions (M criteria) at the time also called for caution, without question, as was noted in the daily market commentary.
After a 10/10/11 gap up, CELG's color code was changed to green and it was noted because it had rallied beyond the previously cited "max buy" level. Keep in mind that a new confirmed rally has also now been acknowledged and the market (M criteria) is again considered to be in a confirmed uptrend. That means that new buying efforts may be justified under the fact-based system's guidelines. It is not a huge stretch to look at it now, but a new rally is not an excuse to make sloppy buys. In a confirmed rally investors' odds are most favorable when buying fresh breakouts rather than chasing a stock too far above the most ideal buying range. A hearty bull market produces many high-ranked leaders that break out from sound bases, producing valid opportunities where disciplined buying efforts are justified within the guidelines of the fact-based system. Early leaders in a new leg up like this one can be kept on a watchlist of worthy buy candidates if they appear to be getting away, and they may possibly be noted again when new bases or secondary buy points present themselves.
|
|
|
Color Codes Explained :
Y - Better candidates highlighted by our
staff of experts.
G - Previously featured
in past reports as yellow but may no longer be buyable under the
guidelines.
***Last / Change / Volume data in this table is the closing quote data***
Symbol/Exchange
Company Name
Industry Group |
PRICE |
CHANGE
(%Change) |
Day High |
Volume
(% DAV)
(% 50 day avg vol) |
52 Wk Hi
% From Hi |
Featured
Date |
Price
Featured |
Pivot Featured |
|
Max Buy |
AAPL
-
NASDAQ
Apple Inc
COMPUTER HARDWARE - Personal Computers
|
$422.00
|
+13.57
3.32% |
$422.00
|
20,455,013
88.75% of 50 DAV
50 DAV is 23,049,200
|
$422.86
-0.20%
|
9/16/2011
|
$399.14
|
PP = $404.60
|
|
MB = $424.83
|
 Most Recent Note - 10/14/2011 3:07:29 PM
G - On track for a 5th consecutive gain and poised to finish at a best-ever close after gapping up today. It has not formed a sound base pattern.
>>> The latest Featured Stock Update with an annotated graph appeared on 10/6/2011. Click here.
View all notes |
Alert me of new notes |
CANSLIM.net Company Profile |
SEC |
Zacks Reports |
StockTalk |
News |
Chart |
Request a new note
C
A N
S L
I M


|
ALXN
-
NASDAQ
Alexion Pharmaceuticals
DRUGS - Drug Manufacturers - Other
|
$66.80
|
-0.58
-0.86% |
$68.18
|
927,533
54.48% of 50 DAV
50 DAV is 1,702,500
|
$70.20
-4.84%
|
9/15/2011
|
$63.20
|
PP = $60.81
|
|
MB = $63.85
|
Most Recent Note - 10/14/2011 3:08:50 PM
G - Hovering near its all-time high with volume totals recently cooling. This high-ranked Medical - Biomed/Biotech group leader is extended from its prior base. Support to watch includes prior resistance in the $59-60 area and its upwardly tilted 50 DMA line.
>>> The latest Featured Stock Update with an annotated graph appeared on 10/5/2011. Click here.
View all notes |
Alert me of new notes |
CANSLIM.net Company Profile |
SEC |
Zacks Reports |
StockTalk |
News |
Chart |
Request a new note
C
A N
S L
I M
|
CELG
-
NASDAQ
Celgene Corp
DRUGS - Drug Manufacturers - Major
|
$66.30
|
-0.06
-0.09% |
$67.01
|
2,426,670
56.23% of 50 DAV
50 DAV is 4,315,300
|
$66.98
-1.02%
|
9/16/2011
|
$61.21
|
PP = $62.59
|
|
MB = $65.72
|
Most Recent Note - 10/14/2011 3:10:37 PM
G - Extended from its prior base, it is hovering near its 52-week high with volume totals recently cooling. No resistance remains due to overhead supply after a 10/10/11 gap up.
>>> The latest Featured Stock Update with an annotated graph appeared on 10/14/2011. Click here.
View all notes |
Alert me of new notes |
CANSLIM.net Company Profile |
SEC |
Zacks Reports |
StockTalk |
News |
Chart |
Request a new note
C
A N
S L
I M
|
MG
-
NYSE
Mistras Group Inc
DIVERSIFIED SERVICES - Bulding and Faci;ity Management Services
|
$22.76
|
+0.66
2.99% |
$23.00
|
282,683
117.20% of 50 DAV
50 DAV is 241,200
|
$22.20
2.51%
|
8/10/2011
|
$17.89
|
PP = $17.58
|
|
MB = $18.46
|
Most Recent Note - 10/14/2011 3:12:18 PM
G - On track for a 4th consecutive gain today, and no resistance remains due to overhead supply as it hits new all-time highs. Recently reported earnings +83% on +34% sales revenues for the quarter ended August 31, 2011 versus the year ago period. See the latest FSU analysis for more details and a new annotated graph.
>>> The latest Featured Stock Update with an annotated graph appeared on 10/12/2011. Click here.
View all notes |
Alert me of new notes |
CANSLIM.net Company Profile |
SEC |
Zacks Reports |
StockTalk |
News |
Chart |
Request a new note
C
A N
S L
I M
|
OPNT
-
NASDAQ
Opnet Technologies
INTERNET - Internet Software and Services
|
$39.08
|
+1.40
3.72% |
$39.11
|
93,312
54.00% of 50 DAV
50 DAV is 172,800
|
$42.51
-8.07%
|
10/11/2011
|
$38.45
|
PP = $42.02
|
|
MB = $44.12
|
Most Recent Note - 10/14/2011 3:15:16 PM
Y - Holding its ground with volume totals cooling after encountering distributional pressure earlier in the week. Disciplined investors would wait to see subsequent gains above its pivot point trigger a technical buy signal before taking action. See the latest FSU analysis for more details and an annotated weekly graph.
>>> The latest Featured Stock Update with an annotated graph appeared on 10/11/2011. Click here.
View all notes |
Alert me of new notes |
CANSLIM.net Company Profile |
SEC |
Zacks Reports |
StockTalk |
News |
Chart |
Request a new note
C
A N
S L
I M
|
Symbol/Exchange
Company Name
Industry Group |
PRICE |
CHANGE
(%Change) |
Day High |
Volume
(% DAV)
(% 50 day avg vol) |
52 Wk Hi
% From Hi |
Featured
Date |
Price
Featured |
Pivot Featured |
|
Max Buy |
V
-
NYSE
Visa Inc Cl A
DIVERSIFIED SERVICES - Business/Management Services
|
$93.92
|
+1.32
1.43% |
$94.65
|
3,950,160
63.57% of 50 DAV
50 DAV is 6,213,700
|
$94.75
-0.88%
|
9/20/2011
|
$93.91
|
PP = $90.93
|
|
MB = $95.48
|
Most Recent Note - 10/14/2011 3:18:02 PM
G - Up again today for a 5th consecutive gain with lighter than average volume, poised for a best-ever close. Choppy action in recent weeks is not recognized as a sound base pattern.
>>> The latest Featured Stock Update with an annotated graph appeared on 10/10/2011. Click here.
View all notes |
Alert me of new notes |
CANSLIM.net Company Profile |
SEC |
Zacks Reports |
StockTalk |
News |
Chart |
Request a new note
C
A N
S L
I M
|
|
 |
| Subscriber Question: |
October 13, 2011 |
Dear Ken,
Can you please tell me what you mean by no resistance remains due to overhead supply when adding notes to a stock? Thanks so much for your time.
Doug |
| Ken's Response: |
October 14, 2011 |
Dear Doug,
Thanks for writing in with your question. The index in the 4th edition of "How to Make Money in Stocks" refers us to pages 149-150 for insight into the question, "What Is Overhead Supply?" It is explained that, "A critically important concept to learn in analyzing price movements is the principle of overhead supply. Overhead supply is when there are significant areas of price resistance in a stock as it moves up after experiencing a downtrend."
Human nature typically prevails, and many times investors who bought a stock at higher prices are motivated to sell when they can finally get out of it somewhere near their break-even point after having been down a large amount. These investors are a source of resistance as a stock tries to advance.
Good chartists do not make the mistake of buying a stock that has a large amount of recent overhead supply. Of course, a stock that has just broken out into new high ground for the first time has no overhead supply to contend with, which adds to its appeal.
Best regards,

Kenneth J. Gruneisen
Founder & Contributing Writer for CANSLIM.net
www.canslim.net |
|
|
|
THESE ARE NOT BUY RECOMMENDATIONS!
Comments contained in the body of this report are technical
opinions only. The material herein has been obtained
from sources believed to be reliable and accurate, however,
its accuracy and completeness cannot be guaranteed.
This site is not an investment advisor, hence it does
not endorse or recommend any securities or other investments.
Any recommendation contained in this report may not
be suitable for all investors and it is not to be deemed
an offer or solicitation on our part with respect to
the purchase or sale of any securities. All trademarks,
service marks and trade names appearing in this report
are the property of their respective owners, and are
likewise used for identification purposes only.
This report is a service available
only to active Paid Premium Members.
You may opt-out of receiving report notifications
at any time. Questions or comments may be submitted
by writing to Premium Membership Services 665 S.E. 10 Street, Suite 201 Deerfield Beach, FL 33441-5634 or by calling 1-800-965-8307
or 954-785-1121.
|
|
|

