***Last / Change / Volume data in this table is the closing quote data***
Symbol/Exchange
Company Name
Industry Group |
PRICE |
CHANGE
(%Change) |
Day High |
Volume
(% DAV)
(% 50 day avg vol) |
52 Wk Hi
% From Hi |
Featured
Date |
Price
Featured |
Pivot Featured |
|
Max Buy |
AVG
-
NYSE
A V G Technologies N.V.
INTERNET - Internet Software and Services
|
$24.28
|
+0.02
0.08% |
$24.74
|
720,301
84.76% of 50 DAV
50 DAV is 849,800
|
$26.56
-8.57%
|
9/13/2013
|
$23.06
|
PP = $23.88
|
|
MB = $25.07
|
Most Recent Note - 10/10/2013 7:06:46 PM
Y - The prompt rebound above its 50 DMA line helped its outlook and its color code is changed to yellow. Rebounded above prior highs in the $23 area and its 50 DMA line with gains on lighter volume after triggering technical sell signals with volume-driven losses.
>>> FEATURED STOCK ARTICLE : Rallying Near Pivot Point With Greater Volume Conviction - 9/13/2013
View all notes |
Set NEW NOTE alert |
CANSLIM.net Company Profile |
SEC
News |
Chart |
Request a new note
C
A N
S L
I M


|
BITA
-
NYSE
Bitauto Hldgs Ltd Ads
INTERNET - Internet Information Providers
|
$23.54
|
+1.99
9.23% |
$23.88
|
880,964
139.04% of 50 DAV
50 DAV is 633,600
|
$22.67
3.84%
|
9/24/2013
|
$16.40
|
PP = $17.31
|
|
MB = $18.18
|
 Most Recent Note - 10/16/2013 12:27:05 PM
G - Hitting new all-time highs today, getting more extended from its prior base. Prior highs in the $18 area define initial support to watch on pullbacks.
>>> FEATURED STOCK ARTICLE : Volume-Driven Gains Cleared Latest Pivot Point - 10/2/2013
View all notes |
Set NEW NOTE alert |
CANSLIM.net Company Profile |
SEC
News |
Chart |
Request a new note
C
A N
S L
I M
|
BLOX
-
NYSE
Infoblox Inc
COMPUTER HARDWARE - Networking and Communication Dev
|
$46.04
|
+2.73
6.30% |
$46.63
|
1,226,870
170.30% of 50 DAV
50 DAV is 720,400
|
$45.50
1.19%
|
10/11/2013
|
$43.02
|
PP = $45.60
|
|
MB = $47.88
|
Most Recent Note - 10/16/2013 12:28:40 PM
Y - Hitting a new 52-week high today with volume running at an above average pace while rising above its pivot point. Highlighted in yellow while building on a flat base in the 10/11/13 mid-day report (read here) and noted - "Subsequent volume-driven gains for new highs may trigger a technical buy signal."
>>> FEATURED STOCK ARTICLE : Finished Another Week Higher With Volume Behind Gains - 10/11/2013
View all notes |
Set NEW NOTE alert |
CANSLIM.net Company Profile |
SEC
News |
Chart |
Request a new note
C
A N
S L
I M
|
CELG
-
NASDAQ
Celgene Corp
DRUGS - Drug Manufacturers - Major
|
$158.33
|
+3.08
1.98% |
$158.44
|
2,470,178
96.12% of 50 DAV
50 DAV is 2,569,800
|
$157.95
0.24%
|
9/12/2013
|
$149.50
|
PP = $150.02
|
|
MB = $157.52
|
Most Recent Note - 10/11/2013 6:13:07 PM
Y - Posted gains on lighter volume after finding support at its 50 DMA line this week. The recent low ($143.13 on 10/09/13) defines important near-term support where a subsequent violation may trigger a more worrisome technical sell signal.
>>> FEATURED STOCK ARTICLE : Volume-Driven Gain Challenging New Pivot Point - 9/20/2013
View all notes |
Set NEW NOTE alert |
CANSLIM.net Company Profile |
SEC
News |
Chart |
Request a new note
C
A N
S L
I M
|
EGBN
-
NASDAQ
Eagle Bancorp Inc
BANKING - Regional - Mid-Atlantic Banks
|
$29.54
|
+0.81
2.82% |
$29.92
|
77,347
111.93% of 50 DAV
50 DAV is 69,100
|
$29.80
-0.87%
|
9/16/2013
|
$27.48
|
PP = $27.77
|
|
MB = $29.16
|
Most Recent Note - 10/16/2013 6:56:17 PM
G - Hit a new 52-week high today with a considerable gain backed by only +11% above average volume. Color code is changed to green while getting extended from the prior base. Recent lows and 50 DMA line define near-term support.
>>> FEATURED STOCK ARTICLE : Finished Lower After "Negative Reversal" - 9/16/2013
View all notes |
Set NEW NOTE alert |
CANSLIM.net Company Profile |
SEC
News |
Chart |
Request a new note
C
A N
S L
I M
|
Symbol/Exchange
Company Name
Industry Group |
PRICE |
CHANGE
(%Change) |
Day High |
Volume
(% DAV)
(% 50 day avg vol) |
52 Wk Hi
% From Hi |
Featured
Date |
Price
Featured |
Pivot Featured |
|
Max Buy |
FLT
-
NYSE
Fleetcor Technologies
DIVERSIFIED SERVICES - Business/Management Services
|
$110.41
|
+3.62
3.39% |
$111.33
|
660,437
95.37% of 50 DAV
50 DAV is 692,500
|
$113.68
-2.88%
|
8/19/2013
|
$99.01
|
PP = $100.97
|
|
MB = $106.02
|
Most Recent Note - 10/16/2013 6:57:58 PM
G - Rebounded further above its 50 DMA line today. A prompt rebound above that important short-term average last week was noted as a sign of support that helped its outlook.
>>> FEATURED STOCK ARTICLE : Extended After 13 Weekly Gains in Span of 14 Weeks - 10/7/2013
View all notes |
Set NEW NOTE alert |
CANSLIM.net Company Profile |
SEC
News |
Chart |
Request a new note
C
A N
S L
I M
|
GNRC
-
NYSE
Generac Hldgs Inc
CONSUMER DURABLES - Electronic Equipment
|
$40.32
|
+0.37
0.93% |
$40.89
|
581,686
85.28% of 50 DAV
50 DAV is 682,100
|
$44.30
-8.98%
|
9/12/2013
|
$41.40
|
PP = $43.27
|
|
MB = $45.43
|
Most Recent Note - 10/15/2013 6:55:09 PM
G - Still sputtering below its 50 DMA line yet holding its ground above prior lows in $39 area defining important near-term support. Disciplined investors limit losses by selling if any stock falls more than -7% from their purchase price.
>>> FEATURED STOCK ARTICLE : Pullback Following Friday's Technical Buy Signal - 9/23/2013
View all notes |
Set NEW NOTE alert |
CANSLIM.net Company Profile |
SEC
News |
Chart |
Request a new note
C
A N
S L
I M
|
JAZZ
-
NASDAQ
Jazz Pharmaceuticals Plc
DRUGS - Biotechnology
|
$82.89
|
+0.27
0.33% |
$84.00
|
721,008
99.59% of 50 DAV
50 DAV is 724,000
|
$93.84
-11.67%
|
9/30/2013
|
$93.20
|
PP = $89.10
|
|
MB = $93.56
|
Most Recent Note - 10/15/2013 7:02:43 PM
G- Consolidating below its 50 DMA line, and a subsequent rebound is needed to help its outlook. That important short-term average acted as resistance after a damaging loss and technical sell signal on 10/08/13. Disciplined investors limit losses if any stock falls more than -7% from their purchase price.
>>> FEATURED STOCK ARTICLE : Strong Finish With High Volume Indicative of Accumulation - 9/30/2013
View all notes |
Set NEW NOTE alert |
CANSLIM.net Company Profile |
SEC
News |
Chart |
Request a new note
C
A N
S L
I M
|
KORS
-
NYSE
Michael Kors Hldgs Ltd
RETAIL - Apparel Stores
|
$74.32
|
+1.27
1.74% |
$75.13
|
2,513,920
77.85% of 50 DAV
50 DAV is 3,229,000
|
$78.62
-5.47%
|
8/6/2013
|
$69.66
|
PP = $66.28
|
|
MB = $69.59
|
Most Recent Note - 10/15/2013 6:59:12 PM
G - Consolidating near its 50 DMA line, finding prompt support near that short-term average after a damaging loss on 10/08/13 triggered a technical sell signal. Recent low ($70.59 on 10/09/13) defines the next important near-term support area above prior highs in the $66 area.
>>> FEATURED STOCK ARTICLE : Extended From Base After Additional Volume-Driven Gains - 9/27/2013
View all notes |
Set NEW NOTE alert |
CANSLIM.net Company Profile |
SEC
News |
Chart |
Request a new note
C
A N
S L
I M
|
LOPE
-
NASDAQ
Grand Canyon Education
DIVERSIFIED SERVICES - Education and; Training Services
|
$41.49
|
+0.82
2.02% |
$42.18
|
611,298
191.93% of 50 DAV
50 DAV is 318,500
|
$41.33
0.39%
|
6/19/2013
|
$31.47
|
PP = $34.17
|
|
MB = $35.88
|
Most Recent Note - 10/16/2013 12:50:22 PM
G - Gapped up today hitting new all-time highs. Fundamental concerns remain while technical action has been reassuring.
>>> FEATURED STOCK ARTICLE : Formed Advanced Base But Fundamental Concerns Remain - 10/14/2013
View all notes |
Set NEW NOTE alert |
CANSLIM.net Company Profile |
SEC
News |
Chart |
Request a new note
C
A N
S L
I M
|
Symbol/Exchange
Company Name
Industry Group |
PRICE |
CHANGE
(%Change) |
Day High |
Volume
(% DAV)
(% 50 day avg vol) |
52 Wk Hi
% From Hi |
Featured
Date |
Price
Featured |
Pivot Featured |
|
Max Buy |
MRLN
-
NASDAQ
Marlin Business Services
DIVERSIFIED SERVICES - Rental and Leasing Services
|
$25.55
|
+0.42
1.67% |
$25.64
|
7,568
22.26% of 50 DAV
50 DAV is 34,000
|
$26.96
-5.23%
|
9/9/2013
|
$23.75
|
PP = $24.03
|
|
MB = $25.23
|
Most Recent Note - 10/11/2013 6:15:09 PM
G - Finished near the session high with a solid gain while rallying from support at its 50 DMA line. Subsequent losses below the recent low ($23.25) would trigger a more worrisome technical sell signal.
>>> FEATURED STOCK ARTICLE : Faring Better Than Others While Testing 50-Day Average Line - 10/8/2013
View all notes |
Set NEW NOTE alert |
CANSLIM.net Company Profile |
SEC
News |
Chart |
Request a new note
C
A N
S L
I M
|
NOAH
-
NYSE
Noah Holdings Ltd Ads
FINANCIAL SERVICES - Asset Management
|
$21.55
|
+1.76
8.89% |
$22.21
|
1,705,065
248.91% of 50 DAV
50 DAV is 685,000
|
$20.34
5.95%
|
10/15/2013
|
$19.10
|
PP = $18.33
|
|
MB = $19.25
|
Most Recent Note - 10/16/2013 12:53:36 PM
G - Hitting another new 52-week high today with heavy volume behind its 2nd consecutive big gain. Color code is changed to green after rallying beyond its "max buy" level. Prior highs in the $18 area define initial support to watch on pullbacks. See the latest FSU analysis for more details with annotated daily and weekly graphs.
>>> FEATURED STOCK ARTICLE : Finished Strong With Gain on 4 Times Average Volume - 10/15/2013
View all notes |
Set NEW NOTE alert |
CANSLIM.net Company Profile |
SEC
News |
Chart |
Request a new note
C
A N
S L
I M
|
OII
-
NYSE
Oceaneering Intl Inc
ENERGY - Oil and Gas Drilling and Explorati
|
$82.79
|
+0.85
1.04% |
$83.16
|
906,271
154.13% of 50 DAV
50 DAV is 588,000
|
$84.64
-2.19%
|
10/16/2013
|
$83.08
|
PP = $84.74
|
|
MB = $88.98
|
Most Recent Note - 10/16/2013 12:58:25 PM
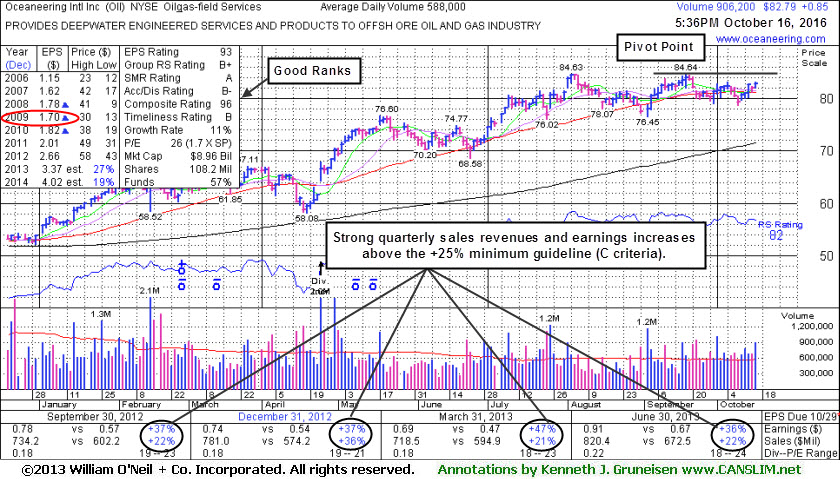
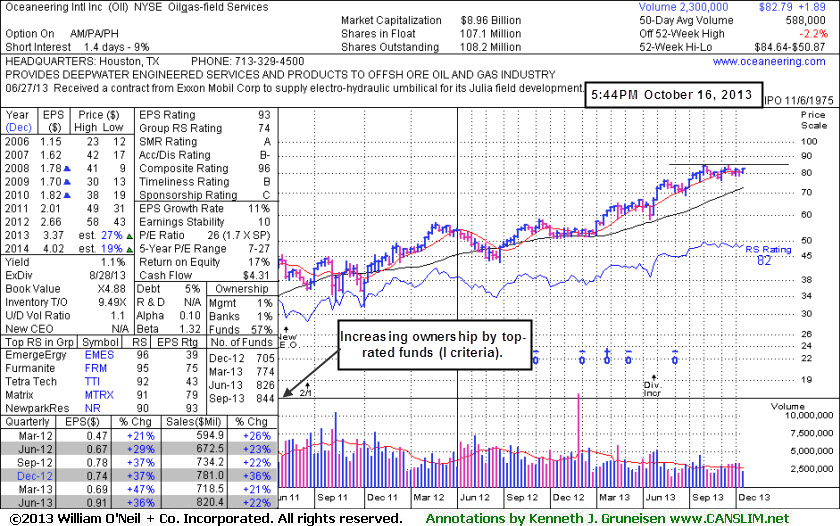
Y - Color code is changed to yellow while building an orderly base with pivot point based on its 9/18/13 high plus 10 cents. Subsequent volume-driven gains above the pivot point may trigger a technical buy signal. Perched -2.3% off its 52-week high, consolidating near its 50 DMA line. Reported earnings +36% on +22% sales revenues for the quarter ended Jun 30, 2013 versus the year ago period, its 5th consecutive quarter with earnings increasing above the +25% minimum guideline (C criteria). Annual earnings (A criteria) history has been improving following a downturn in FY '09.
>>> FEATURED STOCK ARTICLE : Forming Set-Up Above 50-Day Moving Average Line - 10/16/2013
View all notes |
Set NEW NOTE alert |
CANSLIM.net Company Profile |
SEC
News |
Chart |
Request a new note
C
A N
S L
I M
|
PCLN
-
NASDAQ
Priceline.Com Inc
INTERNET - Internet Software and Services
|
$1,035.20
|
+13.69
1.34% |
$1,039.00
|
395,900
63.94% of 50 DAV
50 DAV is 619,200
|
$1,074.89
-3.69%
|
9/13/2013
|
$966.82
|
PP = $995.08
|
|
MB = $1,044.83
|
Most Recent Note - 10/16/2013 7:00:34 PM
Y - Found support near its 50 DMA line after enduring damaging distributional losses last week. Disciplined investors limit losses by selling if any stock falls more than -7% from their purchase price.
>>> FEATURED STOCK ARTICLE : Wedging to New Highs With Gains Lacking Volume Conviction - 9/19/2013
View all notes |
Set NEW NOTE alert |
CANSLIM.net Company Profile |
SEC
News |
Chart |
Request a new note
C
A N
S L
I M
|
PRAA
-
NASDAQ
Portfolio Recovery Assoc
DIVERSIFIED SERVICES - Business/Management Services
|
$60.18
|
+0.99
1.67% |
$60.29
|
402,227
83.76% of 50 DAV
50 DAV is 480,200
|
$61.60
-2.31%
|
7/31/2013
|
$51.43
|
PP = $54.72
|
|
MB = $57.46
|
Most Recent Note - 10/14/2013 6:17:55 PM
G - Up today for a 4th consecutive small gain on below average volume. It is extended from a proper base.
>>> FEATURED STOCK ARTICLE : Wedging to New Highs With Gains Lacking Volume Conviction - 9/26/2013
View all notes |
Set NEW NOTE alert |
CANSLIM.net Company Profile |
SEC
News |
Chart |
Request a new note
C
A N
S L
I M
|
Symbol/Exchange
Company Name
Industry Group |
PRICE |
CHANGE
(%Change) |
Day High |
Volume
(% DAV)
(% 50 day avg vol) |
52 Wk Hi
% From Hi |
Featured
Date |
Price
Featured |
Pivot Featured |
|
Max Buy |
PRLB
-
NYSE
Proto Labs Inc
MANUFACTURING - Small Tools and Accessories
|
$77.69
|
-0.98
-1.25% |
$79.45
|
206,771
56.33% of 50 DAV
50 DAV is 367,100
|
$80.91
-3.98%
|
7/29/2013
|
$64.86
|
PP = $67.50
|
|
MB = $70.88
|
Most Recent Note - 10/10/2013 7:08:17 PM
G - Posted a gain on lighter volume today. Found prompt support at its 50 DMA line. More damaging losses would raise greater concerns.
>>> FEATURED STOCK ARTICLE : Extended Following Additional Volume-Driven Gains - 9/25/2013
View all notes |
Set NEW NOTE alert |
CANSLIM.net Company Profile |
SEC
News |
Chart |
Request a new note
C
A N
S L
I M
|
SFUN
-
NYSE
Soufun Hldgs Ltd Ads A
INTERNET - Internet Information Providers
|
$52.13
|
+0.90
1.76% |
$52.21
|
1,370,211
106.25% of 50 DAV
50 DAV is 1,289,600
|
$53.77
-3.05%
|
7/16/2013
|
$29.54
|
PP = $27.90
|
|
MB = $29.30
|
Most Recent Note - 10/10/2013 6:41:00 PM
G - Rallied from its 50 DMA line for a 2nd consecutive solid gain. Subsequent violations of the 50 DMA line and recent lows may trigger technical sell signals.
>>> FEATURED STOCK ARTICLE : Following Great Rally No New Base Has Been Formed - 10/1/2013
View all notes |
Set NEW NOTE alert |
CANSLIM.net Company Profile |
SEC
News |
Chart |
Request a new note
C
A N
S L
I M
|
SSNC
-
NASDAQ
S S & C Technologies
COMPUTER SOFTWARE and SERVICES - Application Software
|
$37.53
|
+0.69
1.87% |
$37.62
|
287,266
67.09% of 50 DAV
50 DAV is 428,200
|
$39.94
-6.03%
|
9/5/2013
|
$36.01
|
PP = $38.90
|
|
MB = $40.85
|
Most Recent Note - 10/15/2013 7:04:07 PM
G - Consolidating near its 50 DMA line with gains on light volume after losses on higher volume triggered a technical sell signal. Completed a Secondary Offering on 9/20/13 while perched at all-time highs.
>>> FEATURED STOCK ARTICLE : Finding Support Near 50-Day Average After Secondary Offering - 10/4/2013
View all notes |
Set NEW NOTE alert |
CANSLIM.net Company Profile |
SEC
News |
Chart |
Request a new note
C
A N
S L
I M
|
SSYS
-
NASDAQ
Stratasys Ltd
COMPUTER HARDWARE - Computer Peripherals
|
$109.72
|
+2.21
2.06% |
$109.86
|
1,501,399
124.70% of 50 DAV
50 DAV is 1,204,000
|
$113.49
-3.32%
|
10/11/2013
|
$102.94
|
PP = $105.38
|
|
MB = $110.65
|
Most Recent Note - 10/15/2013 7:12:00 PM
Y - Rallied further above its 50 DMA line today and traded +27% above average volume while wedging above the pivot point of its "double bottom" base. Gains must have at least +40% above average volume to trigger a proper technical buy signal, so confirming gains with higher volume would be a welcome reassurance in the days to come.
>>> FEATURED STOCK ARTICLE : Faltering and Relative Strength Waning After Offering - 10/9/2013
View all notes |
Set NEW NOTE alert |
CANSLIM.net Company Profile |
SEC
News |
Chart |
Request a new note
C
A N
S L
I M
|
STMP
-
NASDAQ
Stamps.Com Inc
INTERNET - Internet Software and Services
|
$45.01
|
+0.42
0.94% |
$45.75
|
63,863
61.76% of 50 DAV
50 DAV is 103,400
|
$46.80
-3.82%
|
9/24/2013
|
$45.54
|
PP = $46.57
|
|
MB = $48.90
|
Most Recent Note - 10/15/2013 7:06:20 PM
Y - Rebounded further above its 50 DMA line with today's 5th consecutive gain. Very little resistance remains due to overhead supply.
>>> FEATURED STOCK ARTICLE : Forming New Set-Up After 50-Day Average Acted as Support - 9/24/2013
View all notes |
Set NEW NOTE alert |
CANSLIM.net Company Profile |
SEC
News |
Chart |
Request a new note
C
A N
S L
I M
|
Symbol/Exchange
Company Name
Industry Group |
PRICE |
CHANGE
(%Change) |
Day High |
Volume
(% DAV)
(% 50 day avg vol) |
52 Wk Hi
% From Hi |
Featured
Date |
Price
Featured |
Pivot Featured |
|
Max Buy |
TBBK
-
NASDAQ
Bancorp Inc
BANKING - Regional - Mid-Atlantic Banks
|
$18.56
|
+0.13
0.71% |
$18.83
|
151,381
85.43% of 50 DAV
50 DAV is 177,200
|
$18.99
-2.26%
|
9/4/2013
|
$16.26
|
PP = $16.79
|
|
MB = $17.63
|
Most Recent Note - 10/15/2013 7:07:51 PM
G - Pulled back today on lighter volume following 4 consecutive gains. Recent lows in the $17.25 area define near-term support above its 50 DMA line ($16.78).
>>> FEATURED STOCK ARTICLE : Encountering Distributional Pressure While Consolidating Above Prior Highs - 10/3/2013
View all notes |
Set NEW NOTE alert |
CANSLIM.net Company Profile |
SEC
News |
Chart |
Request a new note
C
A N
S L
I M
|
TNGO
-
NASDAQ
Tangoe Inc
COMPUTER SOFTWARE and SERVICES - Technical and System Software
|
$24.87
|
+1.07
4.50% |
$25.31
|
1,100,763
188.78% of 50 DAV
50 DAV is 583,100
|
$25.19
-1.27%
|
9/12/2013
|
$21.30
|
PP = $23.15
|
|
MB = $24.31
|
Most Recent Note - 10/16/2013 6:54:13 PM
G - Rallied with +89% above average volume today and clinched a technical buy signal while also ending above its "max buy" level. Color code is changed to green while getting extended more than +5% above the pivot point previously cited based on its May 2012 high.
>>> FEATURED STOCK ARTICLE : Gains Today Lacked Volume Conviction of Institutional Demand - 9/17/2013
View all notes |
Set NEW NOTE alert |
CANSLIM.net Company Profile |
SEC
News |
Chart |
Request a new note
C
A N
S L
I M
|
ULTI
-
NASDAQ
Ultimate Software Group
INTERNET - Internet Software and Services
|
$142.53
|
+4.72
3.43% |
$144.21
|
215,022
163.76% of 50 DAV
50 DAV is 131,300
|
$151.08
-5.66%
|
10/16/2013
|
$142.95
|
PP = $151.18
|
|
MB = $158.74
|
Most Recent Note - 10/16/2013 1:21:10 PM
Y - Color code is changed to yellow with pivot point cited based on its 9/19/13 high plus 10 cents. Encountering recent distributional pressure yet finding support near prior lows in the $138 area. Subsequent volume-driven gains above the pivot point may trigger a technical buy signal. Gains above its 50 DMA line ($144.23) are needed to help its outlook, meanwhile that short-term average has been acting as resistance. Prior reports noted - "Reported earnings +62% on +23% sales revenues for the Jun '13 quarter, continuing its strong earnings history satisfying the C and A criteria. Found support near its 200 DMA line then rebounded during its orderly consolidation since dropped from the Featured Stocks list on 11/07/12."
>>> FEATURED STOCK ARTICLE : Following Strong Quarterly Results it Rallied Above 50-Day Moving Average - 10/31/2012
View all notes |
Set NEW NOTE alert |
CANSLIM.net Company Profile |
SEC
News |
Chart |
Request a new note
C
A N
S L
I M
|
VRX
-
NYSE
Valeant Pharmaceuticals
DRUGS - Drug Manufacturers - Other
|
$110.63
|
+0.90
0.82% |
$111.11
|
624,338
52.68% of 50 DAV
50 DAV is 1,185,200
|
$113.79
-2.78%
|
9/11/2013
|
$100.26
|
PP = $105.50
|
|
MB = $110.78
|
Most Recent Note - 10/10/2013 6:31:32 PM
Y- Found support above prior highs defining important support in the $105 area. See latest FSU analysis for more details and a new annotated graph.
>>> FEATURED STOCK ARTICLE : Found Support Above Prior Highs on Pullback - 10/10/2013
View all notes |
Set NEW NOTE alert |
CANSLIM.net Company Profile |
SEC
News |
Chart |
Request a new note
C
A N
S L
I M
|
YNDX
-
NASDAQ
Yandex N V Class A
INTERNET - Internet Information Providers
|
$39.31
|
+0.72
1.87% |
$39.70
|
2,633,837
114.07% of 50 DAV
50 DAV is 2,308,900
|
$39.44
-0.33%
|
9/5/2013
|
$34.24
|
PP = $34.79
|
|
MB = $36.53
|
Most Recent Note - 10/11/2013 1:03:07 PM
G - Perched within close striking distance of its 52-week high. Found prompt support above prior highs in the $34 area and its 50 DMA line while dipping below its "max buy" level earlier this week.
>>> FEATURED STOCK ARTICLE : Gains Lacked Volume Conviction While Hitting New Highs - 9/18/2013
View all notes |
Set NEW NOTE alert |
CANSLIM.net Company Profile |
SEC
News |
Chart |
Request a new note
C
A N
S L
I M
|
Symbol/Exchange
Company Name
Industry Group |
PRICE |
CHANGE
(%Change) |
Day High |
Volume
(% DAV)
(% 50 day avg vol) |
52 Wk Hi
% From Hi |
Featured
Date |
Price
Featured |
Pivot Featured |
|
Max Buy |