You are not logged in.
This means you
CAN ONLY VIEW reports that were published prior to Monday, April 14, 2025.
You
MUST UPGRADE YOUR MEMBERSHIP if you want to see any current reports.
AFTER MARKET UPDATE - FRIDAY, OCTOBER 16TH, 2009
Previous After Market Report Next After Market Report >>>
|
|
|
|
DOW |
-67.03 |
9,995.91 |
-0.67% |
|
Volume |
1,385,973,140 |
+2% |
|
Volume |
2,256,406,450 |
-0% |
|
NASDAQ |
-16.49 |
2,156.80 |
-0.76% |
|
Advancers |
1,039 |
33% |
|
Advancers |
860 |
30% |
|
S&P 500 |
-8.88 |
1,087.68 |
-0.81% |
|
Decliners |
1,964 |
63% |
|
Decliners |
1,842 |
65% |
|
Russell 2000 |
-7.16 |
616.18 |
-1.15% |
|
52 Wk Highs |
202 |
|
|
52 Wk Highs |
101 |
|
|
S&P 600 |
-3.68 |
325.38 |
-1.12% |
|
52 Wk Lows |
3 |
|
|
52 Wk Lows |
4 |
|
|
 |
Indices Consolidate After Week's Earlier Gains Showed Expanding Leadership
Adam Sarhan, Contributing Writer,
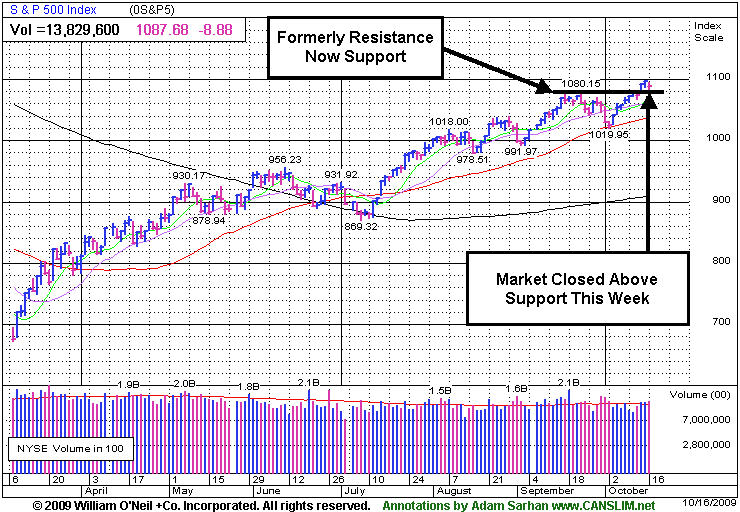
The major averages ended lower on Friday but higher for the week after the Dow Jones Industrial Average rallied above the psychologically important 10,000 mark for the first time since October 2008. On Friday, volume was higher than the prior session on the NYSE and near the prior session total on the Nasdaq exchange as a series of options expired. Decliners trumped advancers by about a 2-to-1 ratio on the NYSE and on the Nasdaq exchange. There were 27 high-ranked companies from the CANSLIM.net Leaders List, making a new 52-week high and appearing on the CANSLIM.net BreakOuts Page, less than the 48 issues that appeared on the prior session. On Wednesday there were 74 high-ranked companies (39% of the total) from the list that hit new highs, evidence of a healthy crop of strong leaders that bodes well concerning the M criteria. New 52-week highs substantially outnumbered new 52-week lows on both major exchanges, and new lows were again in the single digits.
The major averages closed mixed and without any great changes after central banks, flush with record reserves, announced that they are moving away from the US dollar and into the euro and the yen. Policy makers across the globe announced record reserves during the third quarter. Bloomberg.com reported that foreign currency holdings grew by $413 billion last quarter, which is the highest reading since 2003, to $7.3 trillion. Central banks which reported currency breakdowns put +63% of the new cash into euros and yen in the third quarter according to Barclays Capital. That is the highest percentage in any quarter, with more than an $80 billion increase. The US currency has lost -10.3% on a trade-weighted basis over the past six months, which is the largest decline since 1991. The report showed the US dollar’s 37% share of new reserves fell from about a +63% average since 1999.
On Tuesday, the major averages ended mixed causing the S&P 500 Index to snap a 6-day winning streak. So far, earnings season has been lackluster at best. Analysts believe that the average company in the S&P 500 Index will report a ninth consecutive quarter of declining profits which will be the longest losing streak since the Great Depression. Wall Street believes that earnings growth will resume in the fourth quarter of this year. Remember that over the next few weeks as companies continue reporting in droves expect that data to play a pivotal role on what happens to this mature rally. On Wednesday, stocks surged on heavy volume, sending the Dow Jones Industrial Average above the psychologically important 10,000 level and a fresh batch of high ranked stocks triggered fresh technical buy signals.
On Thursday, the market erased earlier losses and ended higher shrugging off disappointing earnings from Citigroup Inc. (C -3.37%) and Goldman Sachs Group Inc. (GS -2.26%) Elsewhere, a slew of oil-related companies rallied after crude oil jumped above $77 a barrel on an unexpected decline in US gasoline inventories. The Labor Department said inflation will not be a threat as the economy emerges from the worst recession since the Great Depression. A separate report showed that jobless claims decreased more than forecast which was the latest round of data from the jobs market.
On Friday, stocks ended lower after General Electric (GE -4.23%) and Bank of America (BAC -4.64%) released lackluster earnings reports which weighed on the market. The market fell after the Reuters/University of Michigan preliminary index of consumer confidence was released. The index fell to 69.4 from 73.5 in September which was the largest decline in more than a year. The current rally remains intact as it finished its 32nd week from the March 12, 2009 follow-through day, and the market deserves the bullish benefit of the doubt until support (50-day moving average lines on major averages) is breached. So far, the Federal Reserve has helped the rally as they have kept rates near historic lows. The latest survey from Bloomberg (of 54 economists) shows that they believe the Fed will lift its overnight lending rate to 1.25% by the end of 2010. A separate poll shows that the European Central Bank (ECB) will increase its benchmark rate by half a percentage point to 1.5%. Economists believe that America’s economy will grow +2.4% in 2010, compared with +0.95% in the euro-zone, and +1% in Japan, median predictions show.
PICTURED: The S&P 500 closed above near term support this week!
Does Your "Expert" Portfolio Manager Have You Over-Diversified And Under-Performing?
In recent weeks we have heard from a number of investors who were frustrated to see their accounts over diversified and under performing at the hands of investment managers claiming to make their moves based on this fact-based system. To find out more about working directly with full service professionals doing it the right way, simply fill out this form and we will contact you to discuss a specific course of action that suits you best (CLICK HERE) *Accounts over $250,000 please, and serious inquiries only.
|
|
|
 |
Commodity-Linked Areas Rise While Financials Sink To Weekly Losses
Kenneth J. Gruneisen - Passed the CAN SLIM® Master's Exam
There were slight gains for the Integrated Oil Index ($XOI +0.20%) and the Gold & Silver Index ($XAU +0.31%), but a modest loss for Oil Services Index ($OSX -0.66%) on Friday, while commodity linked areas held onto big gains for the week. Most groups pulled back from the week's earlier highs including the very influential Bank Index ($BKX -3.21%) and Broker/Dealer Index ($XBD -1.56%), both or which had weekly losses. The Healthcare Index ($HMO -1.56%) slumped for a -2.85% weekly loss, with healthcare "reform" efforts failing to stimulate buying demand. The Retail Index ($RLX -0.75%) fell slightly, but still ended with a +1.34% weekly gain. The Semiconductor Index ($SOX -2.11%) slumped into losing territory for the week after being poised to post a weekly gain. Meanwhile, the Biotechnology Index ($BTK -0.02%) ended flat, but up for the week, and both tech sector indexes below also finished slightly higher for the week.
Charts courtesy www.stockcharts.com
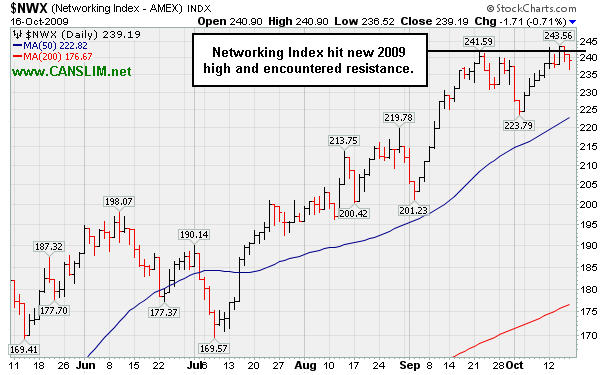
PICTURED 1: The Networking Index ($NWX -0.71%) hit new 2009 highs and encountered resistance this week.
Charts courtesy www.stockcharts.com
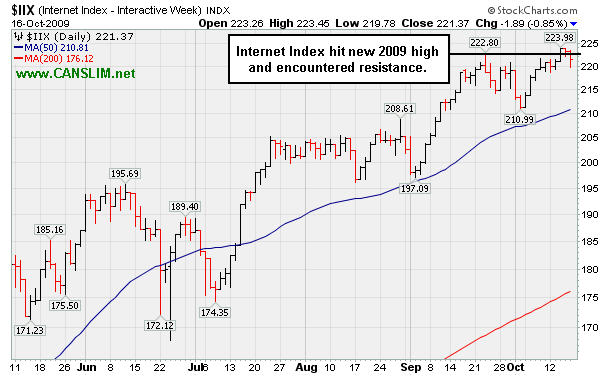
PICTURED 2: The Internet Index ($IIX -0.85%) hit new 2009 highs and encountered resistance this week.
| Oil Services |
$OSX |
207.98 |
-1.39 |
-0.66% |
+71.33% |
| Healthcare |
$HMO |
1,138.15 |
-17.98 |
-1.56% |
+18.54% |
| Integrated Oil |
$XOI |
1,104.79 |
+2.17 |
+0.20% |
+12.77% |
| Semiconductor |
$SOX |
322.83 |
-6.95 |
-2.11% |
+52.16% |
| Networking |
$NWX |
239.19 |
-1.71 |
-0.71% |
+66.23% |
| Internet |
$IIX |
221.37 |
-1.89 |
-0.85% |
+65.49% |
| Broker/Dealer |
$XBD |
123.28 |
-1.96 |
-1.56% |
+59.13% |
| Retail |
$RLX |
393.03 |
-2.97 |
-0.75% |
+40.74% |
| Gold & Silver |
$XAU |
176.50 |
+0.54 |
+0.31% |
+42.51% |
| Bank |
$BKX |
47.29 |
-1.57 |
-3.21% |
+6.70% |
| Biotech |
$BTK |
931.02 |
-0.15 |
-0.02% |
+43.86% |
|
|
|
 |
Technical BreakOut With Above Average Volume
Kenneth J. Gruneisen - Passed the CAN SLIM® Master's Exam
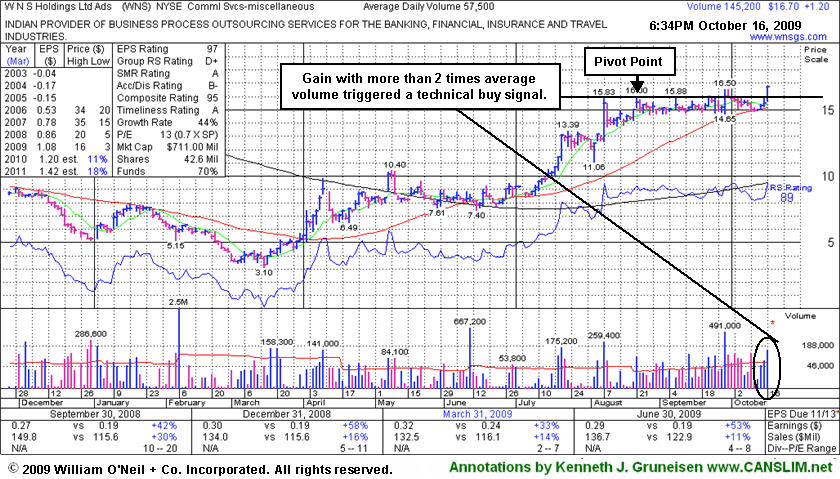
W N S Holdings Ltd Ads (WNS +$1.20 or +7.20% to $16.70) posted a considerable gain today on more than 2 times average volume which helped it trade and close above its pivot point, triggering a technical buy signal while clearing stubborn resistance. Since featured at $15.28 in yellow in the 9/28/09 mid-day report (read here) it had encountered resistance in the $16 area while consolidating just above important support at its 50-day moving average (DMA) line. Quarterly earnings have been above the +25% guideline and its annual earnings history has been great, satisfying the C & A criteria. However, sales revenues growth has decelerated, raising some concerns. Only 14.5 million shares are in the public float, which is considered a good characteristic concerning the S criteria, and could contribute to greater volatility in the event of any heavier institutional buying or selling that may come.
For now, the high-ranked Indian Commercial Services might be an ideal candidate for investors' to accumulate, while disciplined investors would avoid chasing the stock more than +5% above its pivot point. Meanwhile, any deterioration back into its prior base would raise concerns, especially if it negates its breakout with a close under $16 again. Recent lows and its 50 DMA line are important support now, where violations would trigger technical sell signals.
|
|
|
Color Codes Explained :
Y - Better candidates highlighted by our
staff of experts.
G - Previously featured
in past reports as yellow but may no longer be buyable under the
guidelines.
***Last / Change / Volume quote data in this table corresponds with the timestamp on the note***
Symbol/Exchange
Company Name
Industry Group |
Last |
Chg. |
Vol
% DAV |
Date Featured |
Price Featured |
Latest Pivot Point
Featured |
Status |
| Latest Max Buy Price |
ARO
- NYSE
Aeropostale Inc
RETAIL - Apparel Stores
|
$41.21
|
-0.54
|
2,939,928
112% DAV
2,631,200
|
8/21/2009
(Date
Featured) |
$39.21
(Price
Featured) |
PP = $38.84 |
Y |
| MB = $40.78 |
Most Recent Note - 10/16/2009 6:04:13 PM
Y - Loss with higher volume today indicates distributional pressure while it is consolidating just above important support at its 50 DMA line. This high-ranked leader in the Retail - Clothing/shoe group's color code was changed to yellow again on 10/09/09, with a note that it is "permissible under the guidelines to accumulate shares from the first successful test of support at its short-term average line up to as much as 5% above its latest chart highs." However, a 50 DMA line violation could raise concerns and trigger a technical sell signal. The next key chart support level is prior highs in the $38 area. It was featured in yellow in the 8/21/09 Mid-Day BreakOuts Report (read here).
>>> The latest Featured Stock Update with an annotated graph appeared on 10/6/2009. click here.
|
|
C
A
S
I |
News |
Chart |
SEC
View all notes Alert
me of new notes
Company
Profile
|
ARST
-
|
$25.10
|
-0.71
|
405,422
61% DAV
663,000
|
9/1/2009
(Date
Featured) |
$19.91
(Price
Featured) |
PP = $20.90 |
G |
| MB = $21.95 |
Most Recent Note - 10/16/2009 6:12:42 PM
G - Small loss today after rallying to new all-time highs with multiple gains on above average volume. On 10/14/09 its considerable gain backed by more than 2 times average volume helped it rally from a short "base-on-base" type pattern. ARST was first featured in yellow at $19.91 in the 9/01/09 mid-day report with an annotated daily graph (read here). As previously noted, "Recent lows may be considered an initial support level. Prior chart highs and its 50 DMA line, coinciding in the $20 area, define an important technical support level to watch on pullbacks."
>>> The latest Featured Stock Update with an annotated graph appeared on 10/2/2009. click here.
|
|
C
A
S
I |
News |
Chart |
SEC
View all notes Alert
me of new notes
Company
Profile
|
ASIA
-
|
$23.26
|
+0.24
|
1,231,766
163% DAV
753,400
|
10/14/2009
(Date
Featured) |
$23.05
(Price
Featured) |
PP = $22.19 |
Y |
| MB = $23.30 |
Most Recent Note - 10/16/2009 6:19:32 PM
Y - Consolidating near its "max buy" level after a gap up and considerable breakout gain with 5 times average volume triggered a technical buy signal on 10/14/09. It was highlighted in yellow in the 10/14/09 mid-day report (read here) as it blasted to a new 52-week high above its long-ago noted pivot point when featured in the August 2009 CANSLIM.net News (read here).
>>> The latest Featured Stock Update with an annotated graph appeared on 10/14/2009. click here.
|
|
C
A
S
I |
News |
Chart |
SEC
View all notes Alert
me of new notes
Company
Profile
|
BIDU
- NASDAQ
Baidu Inc Ads
INTERNET - Internet Information Providers
|
$395.79
|
-4.11
|
1,632,403
90% DAV
1,804,700
|
9/8/2009
(Date
Featured) |
$351.80
(Price
Featured) |
PP = $368.59 |
G |
| MB = $387.02 |
Most Recent Note - 10/16/2009 6:21:01 PM
G - Pulling back under prior chart highs in the $400 area since recent gains for new 2009 highs challenged its 2007 all-time high of $429. It is extended from a proper buy point under the investment system guidelines. BIDU was featured in yellow in the 9/08/09 Mid-Day BreakOuts Report (read here).
>>> The latest Featured Stock Update with an annotated graph appeared on 10/7/2009. click here.
|
|
C
A
S
I |
News |
Chart |
SEC
View all notes Alert
me of new notes
Company
Profile
|
CACC
- NASDAQ
Credit Acceptance Corp
FINANCIAL SERVICES - Credit Services
|
$35.96
|
-0.54
|
14,673
33% DAV
44,800
|
9/29/2009
(Date
Featured) |
$33.48
(Price
Featured) |
PP = $32.60 |
G |
| MB = $34.23 |
Most Recent Note - 10/16/2009 6:23:28 PM
G - Today's small loss on light volume broke a streak of 10 consecutive gains. Too extended from a sound base now to be buyable under the guidelines. The Finance - Consumer/Commercial Loans firm has maintained a great track record of annual and quarterly sales revenues and earnings increases. It was featured on 9/29/09 in yellow in the mid-day report (read here).
>>> The latest Featured Stock Update with an annotated graph appeared on 10/15/2009. click here.
|
|
C
A
S
I |
News |
Chart |
SEC
View all notes Alert
me of new notes
Company
Profile
|
CRM
- NYSE
Salesforce.com Inc
INTERNET - Internet Software & Services
|
$62.36
|
-0.62
|
1,010,706
48% DAV
2,113,900
|
8/16/2009
(Date
Featured) |
$47.12
(Price
Featured) |
PP = $45.59 |
G |
| MB = $47.87 |
Most Recent Note - 10/16/2009 6:24:26 PM
G - Quietly perched at 2009 highs, but extended from any sound base. Technical support to watch now is an upward trendline connecting its July, August and October chart lows, a line which comes into play above additional support at its 50 DMA line.
>>> The latest Featured Stock Update with an annotated graph appeared on 10/5/2009. click here.
|
|
C
A
S
I |
News |
Chart |
SEC
View all notes Alert
me of new notes
Company
Profile
|
EBIX
- NASDAQ
Ebix Inc
COMPUTER SOFTWARE & SERVICES - Business Software & Services
|
$63.20
|
+2.83
|
473,506
246% DAV
192,300
|
8/28/2009
(Date
Featured) |
$45.86
(Price
Featured) |
PP = $45.35 |
G |
| MB = $47.62 |
Most Recent Note - 10/16/2009 6:26:48 PM
G - Considerable gain with heavy volume for a new all-time high today, leaving it very extended from any sound base. Well above support at its 50 DMA line, and more than +91% above its 200 DMA line, which are reminders to be watchful for sell signals.
>>> The latest Featured Stock Update with an annotated graph appeared on 10/13/2009. click here.
|
|
C
A
S
I |
News |
Chart |
SEC
View all notes Alert
me of new notes
Company
Profile
|
GMCR
- NASDAQ
Green Mtn Coffee Roastrs
FOOD & BEVERAGE - Processed & Packaged Goods
|
$73.35
|
+0.01
|
743,256
57% DAV
1,302,300
|
10/5/2009
(Date
Featured) |
$71.11
(Price
Featured) |
PP = $75.89 |
Y |
| MB = $79.68 |
Most Recent Note - 10/16/2009 6:28:02 PM
Y - Still trading in a tight range above prior highs since its big gain on 9/28/09 with heavy volume. Disciplined investors will watch for volume-driven gains to trigger a new technical buy signal before making any initial buys or add-on purchases.
>>> The latest Featured Stock Update with an annotated graph appeared on 10/12/2009. click here.
|
|
C
A
S
I |
News |
Chart |
SEC
View all notes Alert
me of new notes
Company
Profile
|
NVEC
- NASDAQ
N V E Corp
ELECTRONICS - Semiconductor - Specialized
|
$50.14
|
-0.69
|
46,572
57% DAV
81,400
|
8/26/2009
(Date
Featured) |
$55.32
(Price
Featured) |
PP = $57.60 |
G |
| MB = $60.48 |
Most Recent Note - 10/16/2009 6:29:39 PM
G - Again testing prior chart lows in the $49 area, as previously noted, "an important support level now, and further deterioration may completely negate its 7/23/09 breakaway gap and raise more serious concerns (especially if on heavy volume) and trigger worrisome technical sell signals." Concerns increase the longer it struggles below its 50 DMA line. That short-term average is now downward sloping and has acted as a resistance level while it has been consolidating.
>>> The latest Featured Stock Update with an annotated graph appeared on 9/30/2009. click here.
|
|
C
A
S
I |
News |
Chart |
SEC
View all notes Alert
me of new notes
Company
Profile
|
PEGA
- NASDAQ
Pegasystems Inc
COMPUTER SOFTWARE & SERVICES - Business Software & Services
|
$34.80
|
+0.18
|
216,019
64% DAV
340,000
|
9/9/2009
(Date
Featured) |
$31.14
(Price
Featured) |
PP = $33.35 |
Y |
| MB = $35.02 |
Most Recent Note - 10/16/2009 6:30:14 PM
Y - This high-ranked Computer Software - Financial firm is still quietly hovering in a tight range, perched less than -3% from its all-time high. Important support to watch now is its 50 DMA line, where a violation would trigger a technical sell signal.
>>> The latest Featured Stock Update with an annotated graph appeared on 10/8/2009. click here.
|
|
C
A
S
I |
News |
Chart |
SEC
View all notes Alert
me of new notes
Company
Profile
|
SWI
- NYSE
Solarwinds Inc
COMPUTER SOFTWARE & SERVICES - Application Software
|
$21.54
|
-0.45
|
561,463
117% DAV
480,300
|
9/30/2029
(Date
Featured) |
$22.03
(Price
Featured) |
PP = $21.72 |
Y |
| MB = $22.81 |
Most Recent Note - 10/16/2009 6:31:55 PM
Y - Today's loss on higher volume was another indication of distributional pressure after a negative reversal on 10/14/09 following a gap up. Color code was changed to yellow while consolidating near its previously cited pivot point. Important support to watch is at its 50 DMA line. It was featured in the October 2009 issue of CANSLIM.net News (read here).
>>> The latest Featured Stock Update with an annotated graph appeared on 9/30/2009. click here.
|
|
C
A
S
I |
News |
Chart |
SEC
View all notes Alert
me of new notes
Company
Profile
|
WNS
- NYSE
W N S Holdings Ltd Ads
DIVERSIFIED SERVICES - Business/Management Services
|
$16.70
|
+1.20
|
145,214
253% DAV
57,500
|
9/28/2009
(Date
Featured) |
$15.28
(Price
Featured) |
PP = $16.10 |
Y |
| MB = $16.91 |
Most Recent Note - 10/16/2009 6:33:50 PM
Y - Gain today on more than 2 times average volume helped it trade and close above its pivot point, triggering a technical buy signal while clearing stubborn resistance. Recently found support at its 50 DMA line. Featured in yellow in the 9/28/09 mid-day report (read here). Quarterly earnings have been above the +25% guideline and its annual earnings history has been great, satisfying the C & A criteria. However, sales revenues growth has decelerated.
>>> The latest Featured Stock Update with an annotated graph appeared on 10/16/2009. click here.
|
|
C
A
S
I |
News |
Chart |
SEC
View all notes Alert
me of new notes
Company
Profile
|
|
|
|
THESE ARE NOT BUY RECOMMENDATIONS!
Comments contained in the body of this report are technical
opinions only. The material herein has been obtained
from sources believed to be reliable and accurate, however,
its accuracy and completeness cannot be guaranteed.
This site is not an investment advisor, hence it does
not endorse or recommend any securities or other investments.
Any recommendation contained in this report may not
be suitable for all investors and it is not to be deemed
an offer or solicitation on our part with respect to
the purchase or sale of any securities. All trademarks,
service marks and trade names appearing in this report
are the property of their respective owners, and are
likewise used for identification purposes only.
This report is a service available
only to active Paid Premium Members.
You may opt-out of receiving report notifications
at any time. Questions or comments may be submitted
by writing to Premium Membership Services 665 S.E. 10 Street, Suite 201 Deerfield Beach, FL 33441-5634 or by calling 1-800-965-8307
or 954-785-1121.
|
|
|


