You are not logged in.
This means you
CAN ONLY VIEW reports that were published prior to Monday, April 14, 2025.
You
MUST UPGRADE YOUR MEMBERSHIP if you want to see any current reports.
AFTER MARKET UPDATE - MONDAY, OCTOBER 14TH, 2013
Previous After Market Report Next After Market Report >>>
|
|
|
|
DOW |
+64.15 |
15,301.26 |
+0.42% |
|
Volume |
574,786,050 |
-9% |
|
Volume |
1,442,787,200 |
-15% |
|
NASDAQ |
+23.40 |
3,815.27 |
+0.62% |
|
Advancers |
1,712 |
55% |
|
Advancers |
1,536 |
59% |
|
S&P 500 |
+6.94 |
1,710.14 |
+0.41% |
|
Decliners |
1,226 |
40% |
|
Decliners |
948 |
36% |
|
Russell 2000 |
+5.99 |
1,090.30 |
+0.55% |
|
52 Wk Highs |
185 |
|
|
52 Wk Highs |
199 |
|
|
S&P 600 |
+3.47 |
618.95 |
+0.56% |
|
52 Wk Lows |
30 |
|
|
52 Wk Lows |
17 |
|
|
 |
Major Averages Rose Again With Less Volume Conviction
Kenneth J. Gruneisen - Passed the CAN SLIM® Master's Exam
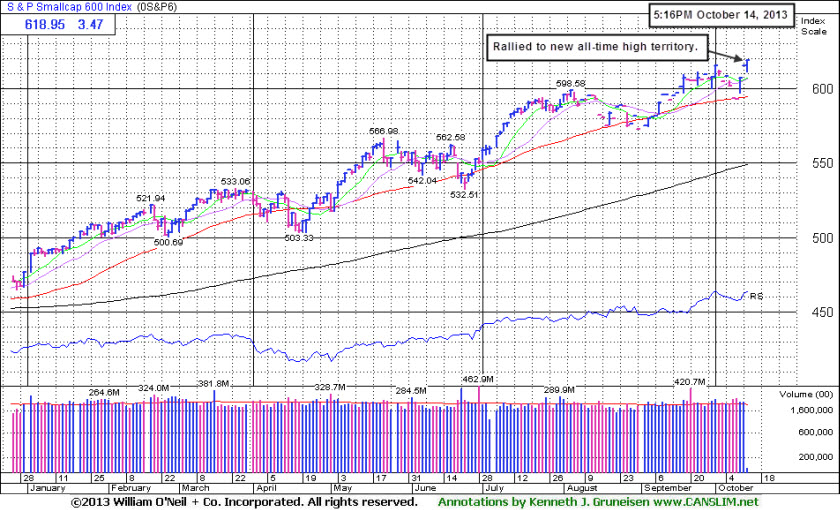
The major averages erased early losses and finished higher on Monday. Volume totals on the NYSE and on the Nasdaq exchange were lighter than the prior session's volume totals. Breadth was positive as advancers led decliners by 7-5 on the NYSE and 3-2 on the Nasdaq exchange. There were 74 high-ranked companies from the CANSLIM.net Leaders List that made new 52-week highs and appeared on the CANSLIM.net BreakOuts Page, down a notch from the 75 stocks on the prior session. The list of stocks hitting new 52-week highs expanded and easily outnumbered new lows on the NYSE and on the Nasdaq exchange. There were gains for 18 of the 22 high-ranked companies currently included on the Featured Stocks Page.
The major averages reversed course amid optimism surrounding the budget impasse in Washington. Senate leaders from both political parties said lawmakers are closer to ending a partial government shutdown and averting a lapse in U.S. borrowing authority. As a result, eight of the 10 S&P 500 sectors advanced. Energy stocks helped lift the market as Exxon Mobil Corp (XOM +0.75%) and Chevron Corp (CVX +0.77%) edged higher. The health care group also paced the advance as Pfizer Inc (PFE +2.19%) and Gilead Sciences Inc (GILD +1.88%) rose. Meanwhile, consumer stocks were led by Netflix Inc's (NFLX +7.82%) jump following reports that the company is in talks with cable providers to add its application to set-top boxes. More defensive sectors lagged behind as utilities and telecommunications declined, including Exelon Corp (EXC -1.05%) and AT&T Inc (T -0.82%). On the earnings front, Packaging Corp of America (PKG +1.60%) posted its profit tally after the close and notable results are due out Tuesday from Coca-Cola, Johnson & Johnson, Citigroup, Intel and Yahoo.
Treasuries were unchanged as U.S. bond markets were closed in observance of Columbus Day.
The market (M criteria) weakness early last week was noted as a "correction" based on worrisome technical damage, however, the strong rebound above important moving average lines coupled with the solid expansion in leadership (stocks hitting new highs) later in the week was very reassuring. Considering the improvement substantial enough to negate the recent weakness, the newspaper's experts recanted the latest "correction" call, returning to labeling the current market conditions as a "rally under pressure" and not a "correction". Disciplined investors might watch for opportunities to make proper new buying efforts, and stocks that were sold can always be bought again if strength returns. Meanwhile, individual holdings should be closely monitored for any worrisome technical sell signals because it is very critical to investors' success to avoid large losses.
The CANSLIM.net Featured Stocks Page shows the most action-worthy candidates and their latest notes and a new Headline Link directs members to the latest detailed analysis with data-packed graphs annotated by a Certified expert along with links to additional resources. The Premium Member Homepage - includes "dynamic archives" to all prior pay reports published. Watch for an announcement via email concerning the next WEBCAST.
PICTURED: The S&P 600 Small Cap Index rallied into new all-time high territory. It stayed above its 50-day moving average (DMA) line during the latest pullback.
|
 Kenneth J. Gruneisen started out as a licensed stockbroker in August 1987, a couple of months prior to the historic stock market crash that took the Dow Jones Industrial Average down -22.6% in a single day. He has published daily fact-based fundamental and technical analysis on high-ranked stocks online for two decades. Through FACTBASEDINVESTING.COM, Kenneth provides educational articles, news, market commentary, and other information regarding proven investment systems that work in good times and bad.
Comments contained in the body of this report are technical opinions only and are not necessarily those of Gruneisen Growth Corp. The material herein has been obtained from sources believed to be reliable and accurate, however, its accuracy and completeness cannot be guaranteed. Our firm, employees, and customers may effect transactions, including transactions contrary to any recommendation herein, or have positions in the securities mentioned herein or options with respect thereto. Any recommendation contained in this report may not be suitable for all investors and it is not to be deemed an offer or solicitation on our part with respect to the purchase or sale of any securities. |
|
 |
Retail, Financial, Tech, and Commodity-Linked Groups Rose
Kenneth J. Gruneisen - Passed the CAN SLIM® Master's Exam
Modest gains from the Retail Index ($RLX +0.40%) were a positive influence on the major averages along with financial shares as the Broker/Dealer Index ($XBD +0.33%) and the Bank Index ($BKX +0.55%) edged higher. The Biotechnology Index ($BTK +1.06%) led the tech sector while the Semiconductor Index ($SOX +0.72%), Networking Index ($NWX +0.72%), and Internet Index ($IIX +0.39%) followed with smaller losses. Commodity-linked groups had a positive bias as the Gold & Silver Index ($XAU +0.65%), Oil Services Index ($OSX +0.95%), and the Integrated Oil Index ($XOI +0.48%) rose. The Healthcare Index ($HMO +0.14%) also eked out a small gain.
Charts courtesy www.stockcharts.com
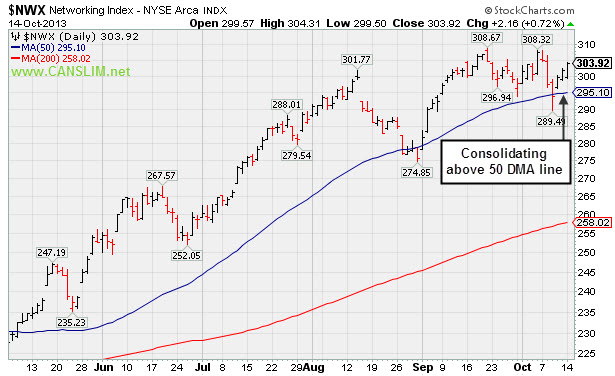
PICTURED: The Networking Index ($NWX +0.72%) is consolidating above its 50-day moving average (DMA) line.
| Oil Services |
$OSX |
281.64 |
+2.64 |
+0.95% |
+27.93% |
| Healthcare |
$HMO |
3,565.56 |
+5.15 |
+0.14% |
+41.82% |
| Integrated Oil |
$XOI |
1,426.23 |
+6.76 |
+0.48% |
+14.85% |
| Semiconductor |
$SOX |
500.98 |
+3.60 |
+0.72% |
+30.44% |
| Networking |
$NWX |
303.92 |
+2.16 |
+0.72% |
+34.15% |
| Internet |
$IIX |
418.90 |
+1.65 |
+0.39% |
+28.11% |
| Broker/Dealer |
$XBD |
138.36 |
+0.46 |
+0.33% |
+46.68% |
| Retail |
$RLX |
847.72 |
+3.39 |
+0.40% |
+29.81% |
| Gold & Silver |
$XAU |
87.31 |
+0.56 |
+0.65% |
-47.28% |
| Bank |
$BKX |
63.93 |
+0.35 |
+0.55% |
+24.67% |
| Biotech |
$BTK |
2,114.31 |
+22.15 |
+1.06% |
+36.67% |
|
|
|
 |
Formed Advanced Base But Fundamental Concerns Remain
Kenneth J. Gruneisen - Passed the CAN SLIM® Master's Exam
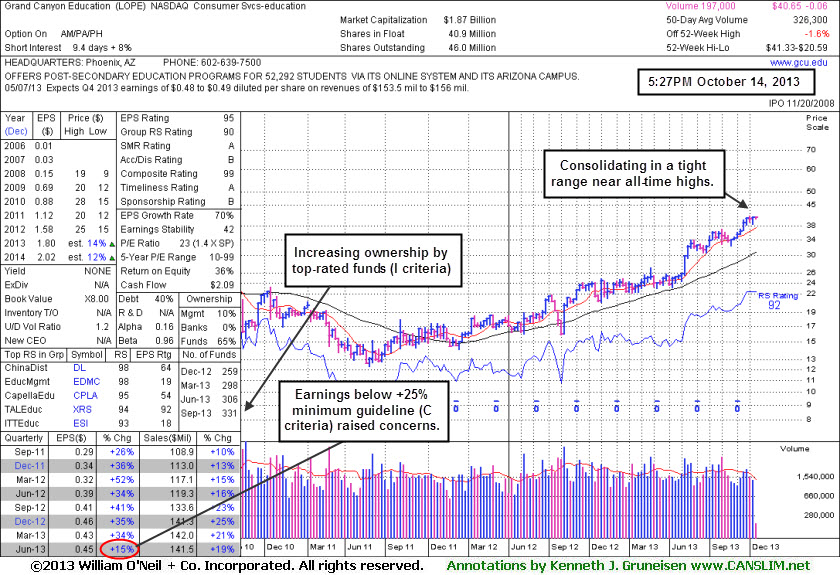
Grand Canyon Education (LOPE -$0.06 or -0.15% to $40.65) remains perched near all-time highs. Its latest consolidation may be considered an advanced "3-weeks tight" base, however, fundamental concerns remain. Disciplined investors might look for stronger buy candidates meeting all key criteria and watch to see how well its upcoming earnings report shakes out. The high-ranked Commercial Services - Schools firm was last shown in this FSU section with an annotated graph on 9/12/13 under the headline, "Perched Near All-Time High After Sub Par Quarterly Increase", with no resistance due to overhead supply. Earnings +15% on +19% sales for the Jun '13 quarter, below the +25% minimum earnings guideline (C criteria), raised fundamental concerns.
Its 50-day moving average (DMA) line defines near term support, and a subsequent violation would raise concerns and trigger a technical sell signal. Its Relative Strength Rating (92) remains above the 80+ minimum guideline. The Commercial Services - Schools group has shown leadership (L criteria) and currently has an A Rating. As it blasted into all-time high territory back in May, the headline read, "Breakaway Gap to All-Time Highs - Friday, May 10, 2013", while rallying above an earlier pivot point and also above its April 2010 high (N criteria) while noted - "Showing bullish technical action which may mark the beginning of a meaningful and sustained advance in price."
The number of top-rated funds owning its shares rose from 200 in Mar '12 to 331 in Jun '13, a reassuring trend concerning the I criteria. Its small supply (S criteria) of 46 million outstanding shares could contribute to greater price volatility in the event of institutional buying or selling.
|
|
|
Color Codes Explained :
Y - Better candidates highlighted by our
staff of experts.
G - Previously featured
in past reports as yellow but may no longer be buyable under the
guidelines.
***Last / Change / Volume data in this table is the closing quote data***
Symbol/Exchange
Company Name
Industry Group |
PRICE |
CHANGE
(%Change) |
Day High |
Volume
(% DAV)
(% 50 day avg vol) |
52 Wk Hi
% From Hi |
Featured
Date |
Price
Featured |
Pivot Featured |
|
Max Buy |
AVG
-
NYSE
A V G Technologies N.V.
INTERNET - Internet Software and Services
|
$24.51
|
+0.62
2.60% |
$24.79
|
496,881
52.45% of 50 DAV
50 DAV is 947,400
|
$26.56
-7.70%
|
9/13/2013
|
$23.06
|
PP = $23.88
|
|
MB = $25.07
|
Most Recent Note - 10/10/2013 7:06:46 PM
Y - The prompt rebound above its 50 DMA line helped its outlook and its color code is changed to yellow. Rebounded above prior highs in the $23 area and its 50 DMA line with gains on lighter volume after triggering technical sell signals with volume-driven losses.
>>> FEATURED STOCK ARTICLE : Rallying Near Pivot Point With Greater Volume Conviction - 9/13/2013
View all notes |
Set NEW NOTE alert |
CANSLIM.net Company Profile |
SEC
News |
Chart |
Request a new note
C
A N
S L
I M


|
BITA
-
NYSE
Bitauto Hldgs Ltd Ads
INTERNET - Internet Information Providers
|
$20.52
|
+0.03
0.15% |
$20.55
|
362,752
58.56% of 50 DAV
50 DAV is 619,500
|
$22.67
-9.48%
|
9/24/2013
|
$16.40
|
PP = $17.31
|
|
MB = $18.18
|
Most Recent Note - 10/11/2013 6:04:02 PM
G - Posted a gain today on lighter volume following 2 negative reversals in the prior 3 sessions. Prior highs in the $18 area define initial support to watch on pullbacks.
>>> FEATURED STOCK ARTICLE : Volume-Driven Gains Cleared Latest Pivot Point - 10/2/2013
View all notes |
Set NEW NOTE alert |
CANSLIM.net Company Profile |
SEC
News |
Chart |
Request a new note
C
A N
S L
I M
|
BLOX
-
NYSE
Infoblox Inc
COMPUTER HARDWARE - Networking and Communication Dev
|
$44.05
|
-0.42
-0.94% |
$44.78
|
906,360
129.61% of 50 DAV
50 DAV is 699,300
|
$45.50
-3.19%
|
10/11/2013
|
$43.02
|
PP = $45.60
|
|
MB = $47.88
|
Most Recent Note - 10/11/2013 6:09:14 PM
Y - Rallied near its 52-week high with today's 3rd consecutive volume-driven gain. Highlighted in yellow while building on a flat base in the earlier mid-day report (read here). Subsequent volume-driven gains for new highs may trigger a technical buy signal. Found support while consolidating in an orderly fashion above its 50 DMA line. Strong sales revenues and solid earnings increases in the Oct '12, Jan, Apr, and Jul '13 quarterly comparisons versus the year ago periods satisfy the C criteria. Up and down annual earnings (A criteria) prior to its 2012 IPO is a concern. Since completing a Secondary Offering on 10/04/12 it followed with choppy action and then an impressive rebound and rally. See the latest Featured Stock analysis for more details and an annotated weekly graph.

>>> FEATURED STOCK ARTICLE : Finished Another Week Higher With Volume Behind Gains - 10/11/2013
View all notes |
Set NEW NOTE alert |
CANSLIM.net Company Profile |
SEC
News |
Chart |
Request a new note
C
A N
S L
I M
|
CELG
-
NASDAQ
Celgene Corp
DRUGS - Drug Manufacturers - Major
|
$154.34
|
+1.17
0.76% |
$154.45
|
1,860,156
72.66% of 50 DAV
50 DAV is 2,560,200
|
$157.95
-2.29%
|
9/12/2013
|
$149.50
|
PP = $150.02
|
|
MB = $157.52
|
Most Recent Note - 10/11/2013 6:13:07 PM
Y - Posted gains on lighter volume after finding support at its 50 DMA line this week. The recent low ($143.13 on 10/09/13) defines important near-term support where a subsequent violation may trigger a more worrisome technical sell signal.
>>> FEATURED STOCK ARTICLE : Volume-Driven Gain Challenging New Pivot Point - 9/20/2013
View all notes |
Set NEW NOTE alert |
CANSLIM.net Company Profile |
SEC
News |
Chart |
Request a new note
C
A N
S L
I M
|
EGBN
-
NASDAQ
Eagle Bancorp Inc
BANKING - Regional - Mid-Atlantic Banks
|
$29.38
|
+0.62
2.16% |
$29.42
|
53,583
77.10% of 50 DAV
50 DAV is 69,500
|
$29.00
1.31%
|
9/16/2013
|
$27.48
|
PP = $27.77
|
|
MB = $29.16
|
Most Recent Note - 10/11/2013 6:01:34 PM
Y - Hit a new 52-week high today with a considerable gain backed by light volume. Recent lows and 50 DMA line define near-term support.
>>> FEATURED STOCK ARTICLE : Finished Lower After "Negative Reversal" - 9/16/2013
View all notes |
Set NEW NOTE alert |
CANSLIM.net Company Profile |
SEC
News |
Chart |
Request a new note
C
A N
S L
I M
|
Symbol/Exchange
Company Name
Industry Group |
PRICE |
CHANGE
(%Change) |
Day High |
Volume
(% DAV)
(% 50 day avg vol) |
52 Wk Hi
% From Hi |
Featured
Date |
Price
Featured |
Pivot Featured |
|
Max Buy |
FLT
-
NYSE
Fleetcor Technologies
DIVERSIFIED SERVICES - Business/Management Services
|
$106.10
|
-0.49
-0.46% |
$106.45
|
1,323,362
191.15% of 50 DAV
50 DAV is 692,300
|
$113.68
-6.67%
|
8/19/2013
|
$99.01
|
PP = $100.97
|
|
MB = $106.02
|
Most Recent Note - 10/10/2013 12:16:12 PM
G - Undercut its 50 DMA line on the prior session. Today's prompt rebound above that important short-term average is a sign of support that helps its outlook.
>>> FEATURED STOCK ARTICLE : Extended After 13 Weekly Gains in Span of 14 Weeks - 10/7/2013
View all notes |
Set NEW NOTE alert |
CANSLIM.net Company Profile |
SEC
News |
Chart |
Request a new note
C
A N
S L
I M
|
GNRC
-
NYSE
Generac Hldgs Inc
CONSUMER DURABLES - Electronic Equipment
|
$40.65
|
-0.28
-0.68% |
$40.83
|
555,992
74.33% of 50 DAV
50 DAV is 748,000
|
$44.30
-8.24%
|
9/12/2013
|
$41.40
|
PP = $43.27
|
|
MB = $45.43
|
Most Recent Note - 10/8/2013 5:04:44 PM
G - Color code is changed to green after a considerable loss today on above average volume violated its 50 DMA line triggering a technical sell signal. Prior lows in $39 area define important near-term support. Disciplined investors limit losses by selling if any stock falls more than -7% from their purchase price.
>>> FEATURED STOCK ARTICLE : Pullback Following Friday's Technical Buy Signal - 9/23/2013
View all notes |
Set NEW NOTE alert |
CANSLIM.net Company Profile |
SEC
News |
Chart |
Request a new note
C
A N
S L
I M
|
JAZZ
-
NASDAQ
Jazz Pharmaceuticals Plc
DRUGS - Biotechnology
|
$84.18
|
+0.67
0.80% |
$84.60
|
907,761
126.08% of 50 DAV
50 DAV is 720,000
|
$93.84
-10.29%
|
9/30/2013
|
$93.20
|
PP = $89.10
|
|
MB = $93.56
|
Most Recent Note - 10/8/2013 12:09:58 PM
G- Violated its 50 DMA line with a damaging loss on heavy volume today triggering a technical sell signal. Color code is changed to green. Disciplined investors limit losses if any stock falls more than -7% from their purchase price.
>>> FEATURED STOCK ARTICLE : Strong Finish With High Volume Indicative of Accumulation - 9/30/2013
View all notes |
Set NEW NOTE alert |
CANSLIM.net Company Profile |
SEC
News |
Chart |
Request a new note
C
A N
S L
I M
|
KORS
-
NYSE
Michael Kors Hldgs Ltd
RETAIL - Apparel Stores
|
$74.03
|
+1.15
1.58% |
$74.36
|
2,397,875
72.67% of 50 DAV
50 DAV is 3,299,600
|
$78.62
-5.84%
|
8/6/2013
|
$69.66
|
PP = $66.28
|
|
MB = $69.59
|
Most Recent Note - 10/8/2013 5:15:40 PM
G - Violated its 50 DMA line with a damaging loss today triggering a technical sell signal. Prior highs in the $66 area define the next chart support area.
>>> FEATURED STOCK ARTICLE : Extended From Base After Additional Volume-Driven Gains - 9/27/2013
View all notes |
Set NEW NOTE alert |
CANSLIM.net Company Profile |
SEC
News |
Chart |
Request a new note
C
A N
S L
I M
|
LOPE
-
NASDAQ
Grand Canyon Education
DIVERSIFIED SERVICES - Education and; Training Services
|
$40.65
|
-0.06
-0.15% |
$40.73
|
201,067
61.62% of 50 DAV
50 DAV is 326,300
|
$41.33
-1.65%
|
6/19/2013
|
$31.47
|
PP = $34.17
|
|
MB = $35.88
|
 Most Recent Note - 10/14/2013 6:08:39 PM
G - Perched near all-time highs. Fundamental concerns remain while technical action has been reassuring. See the latest FSU analysis for more details and a new annotated weekly graph.
>>> FEATURED STOCK ARTICLE : Formed Advanced Base But Fundamental Concerns Remain - 10/14/2013
View all notes |
Set NEW NOTE alert |
CANSLIM.net Company Profile |
SEC
News |
Chart |
Request a new note
C
A N
S L
I M
|
Symbol/Exchange
Company Name
Industry Group |
PRICE |
CHANGE
(%Change) |
Day High |
Volume
(% DAV)
(% 50 day avg vol) |
52 Wk Hi
% From Hi |
Featured
Date |
Price
Featured |
Pivot Featured |
|
Max Buy |
MRLN
-
NASDAQ
Marlin Business Services
DIVERSIFIED SERVICES - Rental and Leasing Services
|
$25.67
|
+0.36
1.42% |
$25.83
|
8,008
23.21% of 50 DAV
50 DAV is 34,500
|
$26.96
-4.78%
|
9/9/2013
|
$23.75
|
PP = $24.03
|
|
MB = $25.23
|
Most Recent Note - 10/11/2013 6:15:09 PM
G - Finished near the session high with a solid gain while rallying from support at its 50 DMA line. Subsequent losses below the recent low ($23.25) would trigger a more worrisome technical sell signal.
>>> FEATURED STOCK ARTICLE : Faring Better Than Others While Testing 50-Day Average Line - 10/8/2013
View all notes |
Set NEW NOTE alert |
CANSLIM.net Company Profile |
SEC
News |
Chart |
Request a new note
C
A N
S L
I M
|
PCLN
-
NASDAQ
Priceline.Com Inc
INTERNET - Internet Software and Services
|
$1,017.63
|
+7.00
0.69% |
$1,019.49
|
431,846
68.69% of 50 DAV
50 DAV is 628,700
|
$1,074.89
-5.33%
|
9/13/2013
|
$966.82
|
PP = $995.08
|
|
MB = $1,044.83
|
Most Recent Note - 10/9/2013 12:43:47 PM
Y - Slumped under prior highs near $995 defining initial support to watch and tested support near its 50 DMA line today. Disciplined investors limit losses by selling if any stock falls more than -7% from their purchase price.
>>> FEATURED STOCK ARTICLE : Wedging to New Highs With Gains Lacking Volume Conviction - 9/19/2013
View all notes |
Set NEW NOTE alert |
CANSLIM.net Company Profile |
SEC
News |
Chart |
Request a new note
C
A N
S L
I M
|
PRAA
-
NASDAQ
Portfolio Recovery Assoc
DIVERSIFIED SERVICES - Business/Management Services
|
$60.54
|
+1.44
2.44% |
$60.70
|
440,285
91.65% of 50 DAV
50 DAV is 480,400
|
$61.60
-1.72%
|
7/31/2013
|
$51.43
|
PP = $54.72
|
|
MB = $57.46
|
Most Recent Note - 10/14/2013 6:17:55 PM
G - Up today for a 4th consecutive small gain on below average volume. It is extended from a proper base.
>>> FEATURED STOCK ARTICLE : Wedging to New Highs With Gains Lacking Volume Conviction - 9/26/2013
View all notes |
Set NEW NOTE alert |
CANSLIM.net Company Profile |
SEC
News |
Chart |
Request a new note
C
A N
S L
I M
|
PRLB
-
NYSE
Proto Labs Inc
MANUFACTURING - Small Tools and Accessories
|
$77.80
|
+1.07
1.39% |
$78.05
|
214,320
56.08% of 50 DAV
50 DAV is 382,200
|
$80.91
-3.84%
|
7/29/2013
|
$64.86
|
PP = $67.50
|
|
MB = $70.88
|
Most Recent Note - 10/10/2013 7:08:17 PM
G - Posted a gain on lighter volume today. Found prompt support at its 50 DMA line. More damaging losses would raise greater concerns.
>>> FEATURED STOCK ARTICLE : Extended Following Additional Volume-Driven Gains - 9/25/2013
View all notes |
Set NEW NOTE alert |
CANSLIM.net Company Profile |
SEC
News |
Chart |
Request a new note
C
A N
S L
I M
|
SFUN
-
NYSE
Soufun Hldgs Ltd Ads A
INTERNET - Internet Information Providers
|
$51.44
|
+0.02
0.04% |
$51.78
|
520,572
41.07% of 50 DAV
50 DAV is 1,267,400
|
$53.77
-4.33%
|
7/16/2013
|
$29.54
|
PP = $27.90
|
|
MB = $29.30
|
Most Recent Note - 10/10/2013 6:41:00 PM
G - Rallied from its 50 DMA line for a 2nd consecutive solid gain. Subsequent violations of the 50 DMA line and recent lows may trigger technical sell signals.
>>> FEATURED STOCK ARTICLE : Following Great Rally No New Base Has Been Formed - 10/1/2013
View all notes |
Set NEW NOTE alert |
CANSLIM.net Company Profile |
SEC
News |
Chart |
Request a new note
C
A N
S L
I M
|
Symbol/Exchange
Company Name
Industry Group |
PRICE |
CHANGE
(%Change) |
Day High |
Volume
(% DAV)
(% 50 day avg vol) |
52 Wk Hi
% From Hi |
Featured
Date |
Price
Featured |
Pivot Featured |
|
Max Buy |
SSNC
-
NASDAQ
S S & C Technologies
COMPUTER SOFTWARE and SERVICES - Application Software
|
$37.15
|
+0.27
0.73% |
$37.25
|
187,862
42.55% of 50 DAV
50 DAV is 441,500
|
$39.94
-6.99%
|
9/5/2013
|
$36.01
|
PP = $38.90
|
|
MB = $40.85
|
Most Recent Note - 10/8/2013 12:48:50 PM
G - Color code is changed to green while deteriorating and violating its 50 DMA line with today's loss on higher volume triggering a technical sell signal. Completed a Secondary Offering on 9/20/13 while perched at all-time highs.
>>> FEATURED STOCK ARTICLE : Finding Support Near 50-Day Average After Secondary Offering - 10/4/2013
View all notes |
Set NEW NOTE alert |
CANSLIM.net Company Profile |
SEC
News |
Chart |
Request a new note
C
A N
S L
I M
|
SSYS
-
NASDAQ
Stratasys Ltd
COMPUTER HARDWARE - Computer Peripherals
|
$104.37
|
+1.43
1.39% |
$106.50
|
1,441,419
123.87% of 50 DAV
50 DAV is 1,163,700
|
$113.49
-8.04%
|
10/11/2013
|
$102.94
|
PP = $105.38
|
|
MB = $110.65
|
Most Recent Note - 10/14/2013 1:09:14 PM
Y - Rebounding further above its 50 DMA line and rising above the pivot point of its "double bottom" based on its 9/26/13 high. Volume-driven gain last week helped its technical stance improve.
>>> FEATURED STOCK ARTICLE : Faltering and Relative Strength Waning After Offering - 10/9/2013
View all notes |
Set NEW NOTE alert |
CANSLIM.net Company Profile |
SEC
News |
Chart |
Request a new note
C
A N
S L
I M
|
STMP
-
NASDAQ
Stamps.Com Inc
INTERNET - Internet Software and Services
|
$44.26
|
+0.74
1.70% |
$44.59
|
70,305
65.64% of 50 DAV
50 DAV is 107,100
|
$46.80
-5.42%
|
9/24/2013
|
$45.54
|
PP = $46.57
|
|
MB = $48.90
|
Most Recent Note - 10/11/2013 6:28:09 PM
Y - Color code is changed to yellow after rebounding above its 50 DMA line helping its technical stance improve.
>>> FEATURED STOCK ARTICLE : Forming New Set-Up After 50-Day Average Acted as Support - 9/24/2013
View all notes |
Set NEW NOTE alert |
CANSLIM.net Company Profile |
SEC
News |
Chart |
Request a new note
C
A N
S L
I M
|
TBBK
-
NASDAQ
Bancorp Inc
BANKING - Regional - Mid-Atlantic Banks
|
$18.80
|
+0.26
1.40% |
$18.99
|
128,278
72.47% of 50 DAV
50 DAV is 177,000
|
$18.81
-0.05%
|
9/4/2013
|
$16.26
|
PP = $16.79
|
|
MB = $17.63
|
Most Recent Note - 10/11/2013 6:29:55 PM
G - Color code is changed to green after rising back beyond its "max buy" level. Recent lows define near-term support above its 50 DMA line.
>>> FEATURED STOCK ARTICLE : Encountering Distributional Pressure While Consolidating Above Prior Highs - 10/3/2013
View all notes |
Set NEW NOTE alert |
CANSLIM.net Company Profile |
SEC
News |
Chart |
Request a new note
C
A N
S L
I M
|
TNGO
-
NASDAQ
Tangoe Inc
COMPUTER SOFTWARE and SERVICES - Technical and System Software
|
$24.98
|
+0.18
0.73% |
$25.07
|
505,783
87.60% of 50 DAV
50 DAV is 577,400
|
$25.19
-0.83%
|
9/12/2013
|
$21.30
|
PP = $23.15
|
|
MB = $24.31
|
Most Recent Note - 10/11/2013 6:20:14 PM
G - Color code is changed to green after rising beyond its "max buy"level and hitting a new 52-week high with today's 3rd consecutive gain, wedging higher without great volume conviction behind its gains.
>>> FEATURED STOCK ARTICLE : Gains Today Lacked Volume Conviction of Institutional Demand - 9/17/2013
View all notes |
Set NEW NOTE alert |
CANSLIM.net Company Profile |
SEC
News |
Chart |
Request a new note
C
A N
S L
I M
|
Symbol/Exchange
Company Name
Industry Group |
PRICE |
CHANGE
(%Change) |
Day High |
Volume
(% DAV)
(% 50 day avg vol) |
52 Wk Hi
% From Hi |
Featured
Date |
Price
Featured |
Pivot Featured |
|
Max Buy |
VRX
-
NYSE
Valeant Pharmaceuticals
DRUGS - Drug Manufacturers - Other
|
$109.78
|
+0.35
0.32% |
$109.91
|
587,129
49.24% of 50 DAV
50 DAV is 1,192,300
|
$113.79
-3.52%
|
9/11/2013
|
$100.26
|
PP = $105.50
|
|
MB = $110.78
|
Most Recent Note - 10/10/2013 6:31:32 PM
Y- Found support above prior highs defining important support in the $105 area. See latest FSU analysis for more details and a new annotated graph.
>>> FEATURED STOCK ARTICLE : Found Support Above Prior Highs on Pullback - 10/10/2013
View all notes |
Set NEW NOTE alert |
CANSLIM.net Company Profile |
SEC
News |
Chart |
Request a new note
C
A N
S L
I M
|
YNDX
-
NASDAQ
Yandex N V Class A
INTERNET - Internet Information Providers
|
$38.36
|
+0.03
0.08% |
$38.97
|
2,171,469
93.95% of 50 DAV
50 DAV is 2,311,400
|
$39.44
-2.74%
|
9/5/2013
|
$34.24
|
PP = $34.79
|
|
MB = $36.53
|
Most Recent Note - 10/11/2013 1:03:07 PM
G - Perched within close striking distance of its 52-week high. Found prompt support above prior highs in the $34 area and its 50 DMA line while dipping below its "max buy" level earlier this week.
>>> FEATURED STOCK ARTICLE : Gains Lacked Volume Conviction While Hitting New Highs - 9/18/2013
View all notes |
Set NEW NOTE alert |
CANSLIM.net Company Profile |
SEC
News |
Chart |
Request a new note
C
A N
S L
I M
|
|
|
|
THESE ARE NOT BUY RECOMMENDATIONS!
Comments contained in the body of this report are technical
opinions only. The material herein has been obtained
from sources believed to be reliable and accurate, however,
its accuracy and completeness cannot be guaranteed.
This site is not an investment advisor, hence it does
not endorse or recommend any securities or other investments.
Any recommendation contained in this report may not
be suitable for all investors and it is not to be deemed
an offer or solicitation on our part with respect to
the purchase or sale of any securities. All trademarks,
service marks and trade names appearing in this report
are the property of their respective owners, and are
likewise used for identification purposes only.
This report is a service available
only to active Paid Premium Members.
You may opt-out of receiving report notifications
at any time. Questions or comments may be submitted
by writing to Premium Membership Services 665 S.E. 10 Street, Suite 201 Deerfield Beach, FL 33441-5634 or by calling 1-800-965-8307
or 954-785-1121.
|
|
|

