You are not logged in.
This means you
CAN ONLY VIEW reports that were published prior to Monday, April 14, 2025.
You
MUST UPGRADE YOUR MEMBERSHIP if you want to see any current reports.
AFTER MARKET UPDATE - THURSDAY, OCTOBER 13TH, 2011
Previous After Market Report Next After Market Report >>>
|
|
|
|
DOW |
-40.72 |
11,478.13 |
-0.35% |
|
Volume |
898,456,170 |
-16% |
|
Volume |
1,632,529,280 |
-15% |
|
NASDAQ |
+15.51 |
2,620.24 |
+0.60% |
|
Advancers |
1,156 |
37% |
|
Advancers |
1,225 |
47% |
|
S&P 500 |
-3.59 |
1,203.66 |
-0.30% |
|
Decliners |
1,847 |
60% |
|
Decliners |
1,271 |
48% |
|
Russell 2000 |
-1.56 |
698.82 |
-0.22% |
|
52 Wk Highs |
7 |
|
|
52 Wk Highs |
13 |
|
|
S&P 600 |
-1.13 |
385.62 |
-0.29% |
|
52 Wk Lows |
10 |
|
|
52 Wk Lows |
25 |
|
|
 |
New Market "Uptrend" Label Surprises Many
Kenneth J. Gruneisen - Passed the CAN SLIM® Master's Exam
On Thursday the trading volume totals cooled on the NYSE and Nasdaq exchanges while the major averages finished with mixed results. Declining issues beat advancers by 3-2 on the NYSE, meanwhile the mix was nearly even on the Nasdaq exchange. New 52-week lows outnumbered new 52-week highs on the Nasdaq exchange and on the NYSE. There were only 5 high-ranked companies from the CANSLIM.net Leaders List that made new 52-week highs and appeared on the CANSLIM.net BreakOuts Page, down from the prior session total of 16 stocks. However, there were gains for all of the 6 high-ranked companies currently included on the Featured Stocks Page.
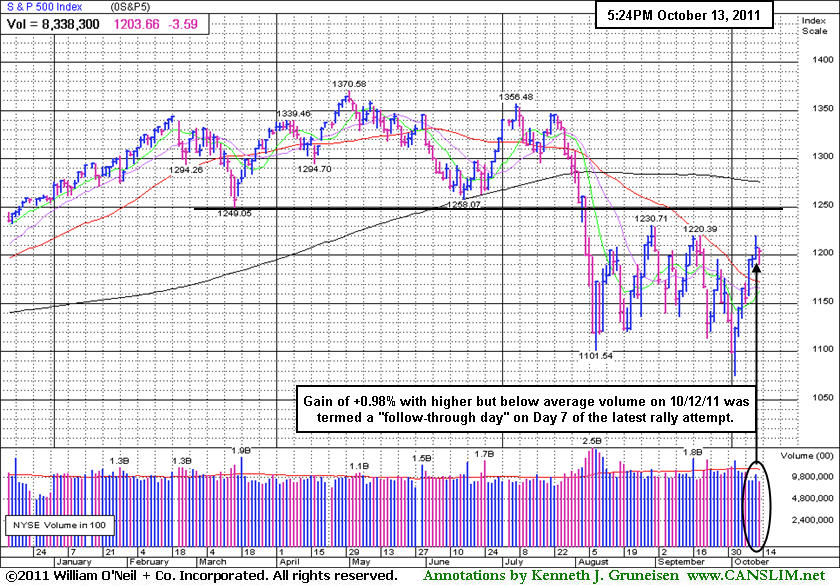
Disciplined fans of this fact-based system would prefer to see a decisive "confirmation day" rather than rely upon a half-hearted day of gains as their sign of renewed institutional buying demand. So, the newspaper surprised more than one analyst by calling the prior session a follow-through day (FTD). Regular readers of this commentary may note that Wednesday's session was not recognized as a proper follow-through day (FTD). Normally a far bigger gain from at least one of the major indices is expected, however the major averages had each gained less than +1% as they advanced further above their respective 50-day moving average (DMA) lines with higher (but still below average) volume.
Time will tell if stocks can manage a sustained advance or not. The best course of action for now may be for investors to let the activity in individual issues guide their decision making. Risk can be best managed by making sure that any new buying efforts are limited to high-ranked stocks breaking out of sound base patterns, not chased more than +5% above prior chart highs. Disciplined investors also know to manage risk by selling if a stock falls more than 7% from their purchase price to prevent the opportunity for small losses to become larger and potentially devastating setbacks.
JP Morgan Chase & Co (JPM -4.82%) issued a cautious outlook and reported profits fell less than expected compared to a year ago. Trading results were modestly worse than anticipated, and the bank's provision for loan losses was higher than forecast. Comments from the European Central Bank also weighed on the financial sector. The ECB said forcing investors to take losses in bailouts is a risk to financial stability and would have “direct negative effects” on the banking sector. The euro lost ground against most major peers, and costs to insure against default on European sovereign bonds rose.
Yahoo! Inc (YHOO +1.01%) edged higher on reports two private equity firms are preparing bids. Research in Motion Ltd (RIMM -1.13%) fell even after the company said it restored data service to its BlackBerry smartphones on the fourth day after disruptions began. PetsMart Inc (PETM +1.86%) rose after the retailer raised its full-year earnings forecast for the second time in two months.
U.S. exporters may be active after Congress approved free-trade agreements with South Korea, Colombia and Panama. A Commerce Department report released this morning showed the U.S. trade deficit increased about 2% to $45.6 billion in August as the global economy cooled, prompting American companies to ship fewer goods abroad. Initial jobless claims fell 1,000 to 404,000 in the latest week, in line with expectations.
The market environment (M criteria) is now considered to be back in a "confirmed uptrend" following a heavy wave of distributional action that pushed the benchmark S&P 500 Index beyond the -20% Bear Market threshold.
The October 2011 issue of our monthly newsletter CANSLIM.net News will be published soon. The Q3 2011 Webcast (aired on September 28th) is now available "ON DEMAND" - (CLICK HERE) It provides an informative review of current market conditions, leading groups, and best buy candidates. All upgraded members are eligible to access the webcast presentation at no additional cost! Via the Premium Member Homepage links to all prior reports and webcasts are always available.
PICTURED: The S&P 500 Index's gain of +0.98% with higher but below average volume on 10/12/11 was termed a "follow-through day" on Day 7 of the latest rally attempt.
|
 Kenneth J. Gruneisen started out as a licensed stockbroker in August 1987, a couple of months prior to the historic stock market crash that took the Dow Jones Industrial Average down -22.6% in a single day. He has published daily fact-based fundamental and technical analysis on high-ranked stocks online for two decades. Through FACTBASEDINVESTING.COM, Kenneth provides educational articles, news, market commentary, and other information regarding proven investment systems that work in good times and bad.
Comments contained in the body of this report are technical opinions only and are not necessarily those of Gruneisen Growth Corp. The material herein has been obtained from sources believed to be reliable and accurate, however, its accuracy and completeness cannot be guaranteed. Our firm, employees, and customers may effect transactions, including transactions contrary to any recommendation herein, or have positions in the securities mentioned herein or options with respect thereto. Any recommendation contained in this report may not be suitable for all investors and it is not to be deemed an offer or solicitation on our part with respect to the purchase or sale of any securities. |
|
 |
Semiconductor Group's Gains Gave Nasdaq a Lift
Kenneth J. Gruneisen - Passed the CAN SLIM® Master's Exam
The Bank Index ($BKX -2.93%) and Broker/Dealer Index ($XBD -0.43%) backpedaled. Defensive groups including the Gold & Silver Index ($XAU -1.94%) and Healthcare Index ($HMO -0.81%) also fell. The Retail Index ($RLX -0.38%) edged lower while energy-related shares were quiet and the Integrated Oil Index ($XOI -0.06%) and Oil Services Index ($OSX +0.16%) finished virtually flat for the day. The tech sector's strength helped the tech-heavy Nasdaq Composite Index outpace its peers as the Networking Index ($NWX +0.43%), Internet Index ($IIX +1.07%), and Biotechnology Index ($BTK +1.27%) tallied gains.
Charts courtesy www.stockcharts.com
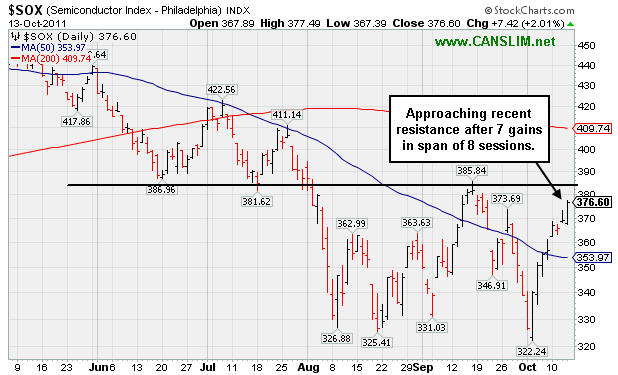
PICTURED: The Semiconductor Index ($SOX +2.01%) led the tech sector higher on Thursday, approaching recent resistance after 7 gains in the span of 8 sessions.
| Oil Services |
$OSX |
209.18 |
+0.34 |
+0.16% |
-14.66% |
| Healthcare |
$HMO |
1,925.23 |
-15.80 |
-0.81% |
+13.78% |
| Integrated Oil |
$XOI |
1,122.86 |
-0.64 |
-0.06% |
-7.44% |
| Semiconductor |
$SOX |
376.60 |
+7.42 |
+2.01% |
-8.55% |
| Networking |
$NWX |
234.26 |
+1.01 |
+0.43% |
-16.50% |
| Internet |
$IIX |
289.18 |
+3.07 |
+1.07% |
-6.03% |
| Broker/Dealer |
$XBD |
85.76 |
-0.37 |
-0.43% |
-29.42% |
| Retail |
$RLX |
528.85 |
-2.00 |
-0.38% |
+4.03% |
| Gold & Silver |
$XAU |
191.45 |
-3.78 |
-1.94% |
-15.50% |
| Bank |
$BKX |
37.79 |
-1.14 |
-2.93% |
-27.62% |
| Biotech |
$BTK |
1,140.21 |
+14.26 |
+1.27% |
-12.13% |
|
|
|
 |
Technical Breakdown Was Followed By Big Decline
Kenneth J. Gruneisen - Passed the CAN SLIM® Master's Exam
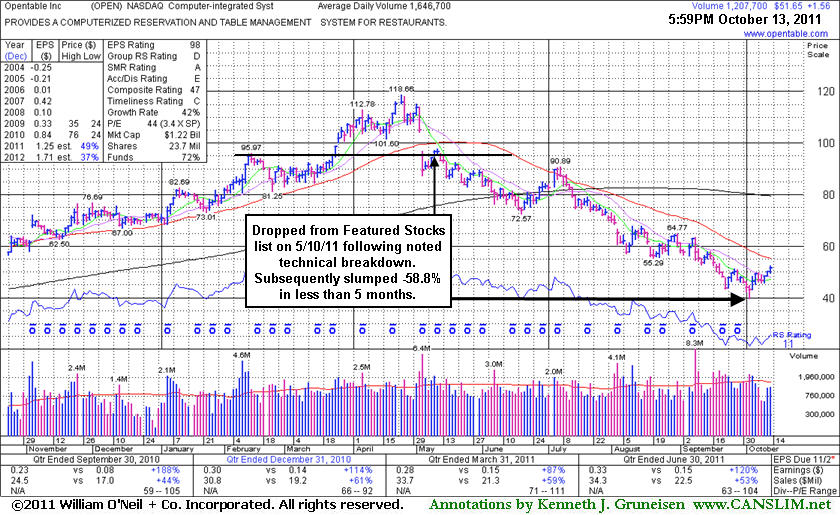
When the number of stocks included on the Featured Stocks page is low, and those currently listed have all received recent analysis in this FSU section, we occasionally go back to revisit a previously featured stock that was dropped. Today we will have another look at a stock that was dropped from the Featured Stocks list back on 5/10/11. OPEN sank as much as -58.8% lower in less than 5 months after it was dropped from the Featured Stocks list. That serves as a reminder that losses should always be limited by selling if ever any stock falls more than -7% from your purchase price. That is Rule #1 in the fact-based investment system CANSLIM.net supports.
Opentable Inc. (OPEN $51.65) was dropped from Featured Stocks list on 5/10/11 shortly after a noted technical breakdown. Regardless of all other criteria, technical action should always dictate investors' buying and selling decisions. The chart below illustrates how its 50-day moving average (DMA) line later acted as a resistance level while the stock subsequently slumped -58.8% in less than 5 months. The C criteria is still solidly satisfied as earnings and sales revenues increases have been strong in its latest quarterly comparisons versus the year ago period. The number of top-rated funds owning shares rose from 326 in Dec '10 to 370 in Sep '11, a very reassuring sign concerning the I criteria. Favorable criteria today does little to ease the pain for investors who may have decided to hang in there following the decisive technical breakdown that was noted. Overhead supply is now a source of great resistance if the stock can find the means to rebound. Meanwhile, any fundamental disappointment could hurt its chances of ever making a full recovery.
|
|
|
Color Codes Explained :
Y - Better candidates highlighted by our
staff of experts.
G - Previously featured
in past reports as yellow but may no longer be buyable under the
guidelines.
***Last / Change / Volume data in this table is the closing quote data***
Symbol/Exchange
Company Name
Industry Group |
PRICE |
CHANGE
(%Change) |
Day High |
Volume
(% DAV)
(% 50 day avg vol) |
52 Wk Hi
% From Hi |
Featured
Date |
Price
Featured |
Pivot Featured |
|
Max Buy |
AAPL
-
NASDAQ
Apple Inc
COMPUTER HARDWARE - Personal Computers
|
$408.43
|
+6.24
1.55% |
$408.43
|
15,167,739
65.19% of 50 DAV
50 DAV is 23,268,000
|
$422.86
-3.41%
|
9/16/2011
|
$399.14
|
PP = $404.60
|
|
MB = $424.83
|
Most Recent Note - 10/11/2011 5:57:29 PM
G - Rallied further above its 50 DMA line with near average volume today but it has not formed a sound base pattern. Found support at its longer-term 200 DMA line again last week.
>>> The latest Featured Stock Update with an annotated graph appeared on 10/6/2011. Click here.
View all notes |
Alert me of new notes |
CANSLIM.net Company Profile |
SEC |
Zacks Reports |
StockTalk |
News |
Chart |
Request a new note
C
A N
S L
I M


|
ALXN
-
NASDAQ
Alexion Pharmaceuticals
DRUGS - Drug Manufacturers - Other
|
$67.38
|
+1.41
2.14% |
$67.98
|
1,182,542
69.39% of 50 DAV
50 DAV is 1,704,200
|
$70.20
-4.02%
|
9/15/2011
|
$63.20
|
PP = $60.81
|
|
MB = $63.85
|
Most Recent Note - 10/12/2011 5:36:19 PM
G - Pulled back today on slightly higher volume after reaching a new all-time high with a quiet gain on the prior session. This high-ranked Medical - Biomed/Biotech group leader is extended from its prior base. Support to watch includes prior resistance in the $59-60 area and its upwardly tilted 50 DMA line.
>>> The latest Featured Stock Update with an annotated graph appeared on 10/5/2011. Click here.
View all notes |
Alert me of new notes |
CANSLIM.net Company Profile |
SEC |
Zacks Reports |
StockTalk |
News |
Chart |
Request a new note
C
A N
S L
I M
|
CELG
-
NASDAQ
Celgene Corp
DRUGS - Drug Manufacturers - Major
|
$66.36
|
+0.91
1.39% |
$66.79
|
2,397,264
54.79% of 50 DAV
50 DAV is 4,375,100
|
$66.98
-0.93%
|
9/16/2011
|
$61.21
|
PP = $62.59
|
|
MB = $65.72
|
Most Recent Note - 10/11/2011 6:03:04 PM
G - Up today with light volume. No resistance remains due to overhead supply after a 10/10/11 gap up and rally to a new 52-week high. Color code was changed to green after getting extended from its prior base.
>>> The latest Featured Stock Update with an annotated graph appeared on 10/4/2011. Click here.
View all notes |
Alert me of new notes |
CANSLIM.net Company Profile |
SEC |
Zacks Reports |
StockTalk |
News |
Chart |
Request a new note
C
A N
S L
I M
|
MG
-
NYSE
Mistras Group Inc
DIVERSIFIED SERVICES - Bulding and Faci;ity Management Services
|
$22.10
|
+1.62
7.91% |
$22.20
|
354,732
150.63% of 50 DAV
50 DAV is 235,500
|
$21.18
4.34%
|
8/10/2011
|
$17.89
|
PP = $17.58
|
|
MB = $18.46
|
 Most Recent Note - 10/13/2011 12:53:59 PM
G - No resistance remains due to overhead supply and it hit new 52-week and all-time highs with today's considerable gain. Recently reported earnings +83% on +34% sales revenues for the quarter ended August 31, 2011 versus the year ago period. See the latest FSU analysis for more details and a new annotated graph.
>>> The latest Featured Stock Update with an annotated graph appeared on 10/12/2011. Click here.
View all notes |
Alert me of new notes |
CANSLIM.net Company Profile |
SEC |
Zacks Reports |
StockTalk |
News |
Chart |
Request a new note
C
A N
S L
I M
|
OPNT
-
NASDAQ
Opnet Technologies
INTERNET - Internet Software and Services
|
$37.68
|
+0.38
1.02% |
$38.33
|
127,850
71.75% of 50 DAV
50 DAV is 178,200
|
$42.51
-11.36%
|
10/11/2011
|
$38.45
|
PP = $42.02
|
|
MB = $44.12
|
Most Recent Note - 10/12/2011 5:45:24 PM
Y - Finished with a small loss on lighter volume today after encountering distributional pressure on the prior session. See the latest FSU analysis for more details and an annotated weekly graph.
>>> The latest Featured Stock Update with an annotated graph appeared on 10/11/2011. Click here.
View all notes |
Alert me of new notes |
CANSLIM.net Company Profile |
SEC |
Zacks Reports |
StockTalk |
News |
Chart |
Request a new note
C
A N
S L
I M
|
Symbol/Exchange
Company Name
Industry Group |
PRICE |
CHANGE
(%Change) |
Day High |
Volume
(% DAV)
(% 50 day avg vol) |
52 Wk Hi
% From Hi |
Featured
Date |
Price
Featured |
Pivot Featured |
|
Max Buy |
V
-
NYSE
Visa Inc Cl A
DIVERSIFIED SERVICES - Business/Management Services
|
$92.60
|
+1.43
1.57% |
$92.93
|
3,298,226
52.15% of 50 DAV
50 DAV is 6,324,300
|
$94.75
-2.27%
|
9/20/2011
|
$93.91
|
PP = $90.93
|
|
MB = $95.48
|
Most Recent Note - 10/12/2011 5:46:13 PM
G - Up again today for a 3rd consecutive gain with lighter than average volume while rebounding further above its 50 DMA line. See the latest FSU analysis for more details and a new annotated graph.
>>> The latest Featured Stock Update with an annotated graph appeared on 10/10/2011. Click here.
View all notes |
Alert me of new notes |
CANSLIM.net Company Profile |
SEC |
Zacks Reports |
StockTalk |
News |
Chart |
Request a new note
C
A N
S L
I M
|
|
|
|
THESE ARE NOT BUY RECOMMENDATIONS!
Comments contained in the body of this report are technical
opinions only. The material herein has been obtained
from sources believed to be reliable and accurate, however,
its accuracy and completeness cannot be guaranteed.
This site is not an investment advisor, hence it does
not endorse or recommend any securities or other investments.
Any recommendation contained in this report may not
be suitable for all investors and it is not to be deemed
an offer or solicitation on our part with respect to
the purchase or sale of any securities. All trademarks,
service marks and trade names appearing in this report
are the property of their respective owners, and are
likewise used for identification purposes only.
This report is a service available
only to active Paid Premium Members.
You may opt-out of receiving report notifications
at any time. Questions or comments may be submitted
by writing to Premium Membership Services 665 S.E. 10 Street, Suite 201 Deerfield Beach, FL 33441-5634 or by calling 1-800-965-8307
or 954-785-1121.
|
|
|

