Symbol/Exchange
Company Name
Industry Group |
PRICE |
CHANGE
(%Change) |
Day High |
Volume
(% DAV)
(% 50 day avg vol) |
52 Wk Hi
% From Hi |
Featured
Date |
Price
Featured |
Pivot Featured |
|
Max Buy |
ALXN
-
NASDAQ
Alexion Pharmaceuticals
DRUGS - Drug Manufacturers - Other
|
$111.19
|
-0.97
-0.86% |
$112.38
|
609,781
62.57% of 50 DAV
50 DAV is 974,500
|
$119.54
-6.98%
|
8/23/2012
|
$103.70
|
PP = $110.06
|
|
MB = $115.56
|
Most Recent Note - 10/9/2012 1:47:51 PM
Y - Color code is changed to yellow after retreating below its "max buy" level. The prior highs in the $110 area define chart support along with its 50 DMA line where violations would raise concerns and trigger technical sell signals..
>>> The latest Featured Stock Update with an annotated graph appeared on 9/26/2012. Click here.
View all notes |
Alert me of new notes |
CANSLIM.net Company Profile |
SEC |
Zacks Reports |
StockTalk |
News |
Chart |
Request a new note
C
A N
S L
I M


|
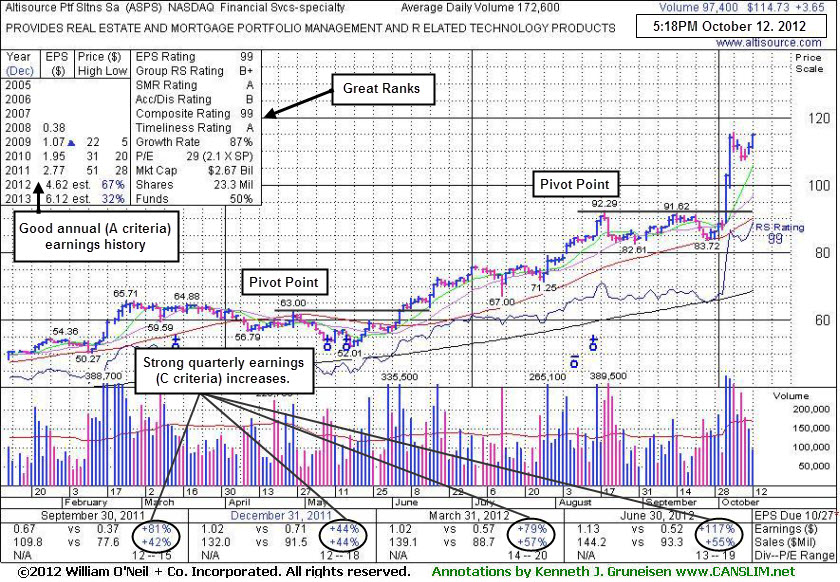
ASPS
-
NASDAQ
Altisource Ptf Sltns Sa
REAL ESTATE - Property Management/Developmen
|
$114.73
|
+3.65
3.29% |
$115.02
|
97,486
56.48% of 50 DAV
50 DAV is 172,600
|
$115.73
-0.86%
|
9/24/2012
|
$87.24
|
PP = $92.39
|
|
MB = $97.01
|
 Most Recent Note - 10/12/2012 4:10:24 PM
G - Finished near the session high with a gain today on below average volume for a best-ever close. Very extended from its prior base, it s prior highs in the $92 area define initial support to watch on pullbacks.
>>> The latest Featured Stock Update with an annotated graph appeared on 10/12/2012. Click here.
View all notes |
Alert me of new notes |
CANSLIM.net Company Profile |
SEC |
Zacks Reports |
StockTalk |
News |
Chart |
Request a new note
C
A N
S L
I M
|
BRLI
-
NASDAQ
Bio Reference Labs Inc
HEALTH SERVICES - Medical Laboratories and Researc
|
$31.88
|
-0.42
-1.30% |
$32.47
|
321,168
112.77% of 50 DAV
50 DAV is 284,800
|
$32.86
-2.98%
|
10/3/2012
|
$30.90
|
PP = $30.25
|
|
MB = $31.76
|
Most Recent Note - 10/11/2012 5:37:55 PM
G - Gapped up today and finished at its second-best close after consolidating under its "max buy" level following its 10/03/12 technical buy signal. Prior highs in the $30 area define initial chart support above its 50 DMA line.
>>> The latest Featured Stock Update with an annotated graph appeared on 10/8/2012. Click here.
View all notes |
Alert me of new notes |
CANSLIM.net Company Profile |
SEC |
Zacks Reports |
StockTalk |
News |
Chart |
Request a new note
C
A N
S L
I M
|
CFNL
-
NASDAQ
Cardinal Financial Corp
BANKING - Regional - Southeast Banks
|
$13.96
|
-0.28
-1.97% |
$14.27
|
67,198
83.68% of 50 DAV
50 DAV is 80,300
|
$14.79
-5.61%
|
8/17/2012
|
$12.84
|
PP = $13.31
|
|
MB = $13.98
|
Most Recent Note - 10/12/2012 4:19:20 PM
G - Quietly consolidating after distributional action in recent weeks. Prior low ($13.80 on 10/03/12) defines near-term support above its 50 DMA line ($13.53 now) where violations would trigger technical sell signals.
>>> The latest Featured Stock Update with an annotated graph appeared on 9/25/2012. Click here.
View all notes |
Alert me of new notes |
CANSLIM.net Company Profile |
SEC |
Zacks Reports |
StockTalk |
News |
Chart |
Request a new note
C
A N
S L
I M
|
CMCSA
-
NASDAQ
Comcast Corp Cl A
MEDIA - CATV Systems
|
$35.78
|
+0.65
1.85% |
$35.87
|
12,002,747
97.78% of 50 DAV
50 DAV is 12,275,000
|
$36.98
-3.24%
|
6/11/2012
|
$29.94
|
PP = $30.98
|
|
MB = $32.53
|
Most Recent Note - 10/12/2012 4:21:01 PM
G - Posted a gain today on average volume, consolidating just above prior highs in the $35 area and its 50 DMA line where violations would trigger technical sell signals. Fundamental concerns have been repeatedly noted - "Due to sub par sales and earnings growth in the Jun '12 quarter."
>>> The latest Featured Stock Update with an annotated graph appeared on 9/21/2012. Click here.
View all notes |
Alert me of new notes |
CANSLIM.net Company Profile |
SEC |
Zacks Reports |
StockTalk |
News |
Chart |
Request a new note
C
A N
S L
I M
|
Symbol/Exchange
Company Name
Industry Group |
PRICE |
CHANGE
(%Change) |
Day High |
Volume
(% DAV)
(% 50 day avg vol) |
52 Wk Hi
% From Hi |
Featured
Date |
Price
Featured |
Pivot Featured |
|
Max Buy |
DVA
-
NYSE
Davita Inc
HEALTH SERVICES - Specialized Health Services
|
$110.42
|
+0.95
0.87% |
$111.34
|
746,225
98.50% of 50 DAV
50 DAV is 757,600
|
$111.30
-0.79%
|
9/5/2012
|
$102.92
|
PP = $100.62
|
|
MB = $105.65
|
Most Recent Note - 10/12/2012 4:22:29 PM
G - Hit another new 52-week high today, getting even more extended from its latest sound base. Prior highs near $100 and its 50 DMA line define near term support to watch on pullbacks where violations may trigger technical sell signals.
>>> The latest Featured Stock Update with an annotated graph appeared on 10/10/2012. Click here.
View all notes |
Alert me of new notes |
CANSLIM.net Company Profile |
SEC |
Zacks Reports |
StockTalk |
News |
Chart |
Request a new note
C
A N
S L
I M
|
EXPE
-
NASDAQ
Expedia Inc
INTERNET - Internet Information Providers
|
$54.25
|
+0.00
0.00% |
$54.54
|
1,801,065
65.89% of 50 DAV
50 DAV is 2,733,500
|
$60.29
-10.02%
|
4/27/2012
|
$41.80
|
PP = $35.57
|
|
MB = $37.35
|
Most Recent Note - 10/12/2012 4:25:55 PM
Held its ground quietly today after distributional losses this week violated important support at its 50 DMA line raising more serious concerns and triggering a technical sell signal. Only a prompt rebound above that short term average would help its outlook. Based on fundamental and technical concerns noted it will be dropped from the Featured Stocks list tonight.
>>> The latest Featured Stock Update with an annotated graph appeared on 9/19/2012. Click here.
View all notes |
Alert me of new notes |
CANSLIM.net Company Profile |
SEC |
Zacks Reports |
StockTalk |
News |
Chart |
Request a new note
C
A N
S L
I M
|
GPX
-
NYSE
G P Strategies Corp
DIVERSIFIED SERVICES - Education and Training Services
|
$19.26
|
+0.25
1.32% |
$19.57
|
37,316
50.02% of 50 DAV
50 DAV is 74,600
|
$20.67
-6.82%
|
10/8/2012
|
$20.00
|
PP = $20.77
|
|
MB = $21.81
|
Most Recent Note - 10/11/2012 5:47:54 PM
G - Slumped below its 50 DMA line today ending near the session low and its color code is changed to green. Volume driven gains above the pivot point have not triggered a new (or add-on) technical buy signal. Losses exceeding last week's low $18.82 would raise more serious concerns and trigger technical sell signals.
>>> The latest Featured Stock Update with an annotated graph appeared on 9/13/2012. Click here.
View all notes |
Alert me of new notes |
CANSLIM.net Company Profile |
SEC |
Zacks Reports |
StockTalk |
News |
Chart |
Request a new note
C
A N
S L
I M
|
LKQ
-
NASDAQ
L K Q Corp
WHOLESALE - Auto Parts
|
$19.63
|
-0.06
-0.30% |
$19.76
|
1,229,803
88.53% of 50 DAV
50 DAV is 1,389,100
|
$20.02
-1.92%
|
8/9/2012
|
$18.97
|
PP = $18.72
|
|
MB = $19.66
|
Most Recent Note - 10/11/2012 5:43:48 PM
Y - Rallied with above average volume today for its second-best close, finishing only -1.6% off its 52-week and all-time highs and near its "max buy" level with no resistance remaining due to overhead supply. Do not be confused by a 2:1 share split effective 9/19/12 (Featured Price, Pivot Point and Max Buy were adjusted).
>>> The latest Featured Stock Update with an annotated graph appeared on 9/17/2012. Click here.
View all notes |
Alert me of new notes |
CANSLIM.net Company Profile |
SEC |
Zacks Reports |
StockTalk |
News |
Chart |
Request a new note
C
A N
S L
I M
|
LNKD
-
NYSE
Linkedin Corp Class A
INTERNET - Internet Information Providers
|
$110.41
|
-3.36
-2.95% |
$115.90
|
3,194,136
133.83% of 50 DAV
50 DAV is 2,386,700
|
$125.50
-12.02%
|
9/5/2012
|
$113.25
|
PP = $113.10
|
|
MB = $118.76
|
Most Recent Note - 10/12/2012 4:14:13 PM
G - Finished near the session low today with a damaging volume-driven loss violating its 50 DMA line and triggering a technical sell signal. Color code is changed to green, meanwhile only a prompt rebound above that short-term average would help its outlook. Disciplined investors always limit losses if ever any stock falls more than -7% from where it was purchased.
>>> The latest Featured Stock Update with an annotated graph appeared on 10/9/2012. Click here.
View all notes |
Alert me of new notes |
CANSLIM.net Company Profile |
SEC |
Zacks Reports |
StockTalk |
News |
Chart |
Request a new note
C
A N
S L
I M
|
Symbol/Exchange
Company Name
Industry Group |
PRICE |
CHANGE
(%Change) |
Day High |
Volume
(% DAV)
(% 50 day avg vol) |
52 Wk Hi
% From Hi |
Featured
Date |
Price
Featured |
Pivot Featured |
|
Max Buy |
LULU
-
NASDAQ
Lululemon Athletica
MANUFACTURING - Textile Manufacturing
|
$73.43
|
+0.73
1.00% |
$73.88
|
904,399
37.00% of 50 DAV
50 DAV is 2,444,300
|
$81.09
-9.45%
|
10/2/2012
|
$74.89
|
PP = $78.97
|
|
MB = $82.92
|
Most Recent Note - 10/12/2012 4:28:55 PM
Y - Following its cup-with-handle base pattern it has been edging lower with volume totals cooling. Volume-driven gains above its pivot point are needed to confirm a technical buy signal before action may be justified by disciplined investors. Fundamentals remain strong (good C and A criteria) and very little resistance from overhead supply is there to hinder its progress.
>>> The latest Featured Stock Update with an annotated graph appeared on 10/2/2012. Click here.
View all notes |
Alert me of new notes |
CANSLIM.net Company Profile |
SEC |
Zacks Reports |
StockTalk |
News |
Chart |
Request a new note
C
A N
S L
I M
|
MIDD
-
NASDAQ
Middleby Corp
MANUFACTURING - Diversified Machinery
|
$118.66
|
+0.21
0.18% |
$119.60
|
23,027
22.53% of 50 DAV
50 DAV is 102,200
|
$122.57
-3.19%
|
10/8/2012
|
$118.46
|
PP = $122.67
|
|
MB = $128.80
|
Most Recent Note - 10/12/2012 4:30:52 PM
Y - Perched -3.2% off its 52-week high today with volume totals cooling in recent weeks while stubbornly holding its ground. Subsequent volume-driven gains above the pivot point may trigger a new (or add-on) technical buy signal. Its 50 DMA line and recent lows define near-term chart support to watch.
>>> The latest Featured Stock Update with an annotated graph appeared on 9/18/2012. Click here.
View all notes |
Alert me of new notes |
CANSLIM.net Company Profile |
SEC |
Zacks Reports |
StockTalk |
News |
Chart |
Request a new note
C
A N
S L
I M
|
N
-
NYSE
Netsuite Inc
DIVERSIFIED SERVICES - Business/Management Services
|
$60.80
|
+0.80
1.33% |
$60.95
|
269,640
55.32% of 50 DAV
50 DAV is 487,400
|
$64.70
-6.03%
|
8/20/2012
|
$55.88
|
PP = $59.32
|
|
MB = $62.29
|
Most Recent Note - 10/12/2012 4:32:04 PM
Y - Still quietly consolidating below its "max buy" level. Prior highs near $59 closely coincide with its 50 DMA line defining important chart support where subsequent violations would trigger technical sell signals.
>>> The latest Featured Stock Update with an annotated graph appeared on 9/24/2012. Click here.
View all notes |
Alert me of new notes |
CANSLIM.net Company Profile |
SEC |
Zacks Reports |
StockTalk |
News |
Chart |
Request a new note
C
A N
S L
I M
|
NSM
-
NYSE
Nationstar Mtg Hldgs Inc
FINANCIAL SERVICES - Credit Services
|
$32.15
|
-0.29
-0.89% |
$33.05
|
581,898
48.95% of 50 DAV
50 DAV is 1,188,800
|
$37.20
-13.58%
|
8/29/2012
|
$27.96
|
PP = $28.85
|
|
MB = $30.29
|
Most Recent Note - 10/11/2012 6:48:40 PM
G - Gain on light volume today halted a 4 session losing streak on higher volume. A steep upward trendline connecting July-September lows defines a near-term support level to watch above its 50 DMA line. See the latest FSU analysis for more details and a new annotated graph.
>>> The latest Featured Stock Update with an annotated graph appeared on 10/11/2012. Click here.
View all notes |
Alert me of new notes |
CANSLIM.net Company Profile |
SEC |
Zacks Reports |
StockTalk |
News |
Chart |
Request a new note
C
A N
S L
I M
|
OSIS
-
NASDAQ
O S I Systems Inc
ELECTRONICS - Semiconductor Equipment and Mate
|
$75.64
|
+0.13
0.17% |
$76.38
|
42,054
31.83% of 50 DAV
50 DAV is 132,100
|
$78.93
-4.17%
|
9/5/2012
|
$74.39
|
PP = $75.10
|
|
MB = $78.86
|
Most Recent Note - 10/12/2012 4:34:59 PM
Y - Consolidating just -4.2% off its 52-week high with volume totals cooling as very few investors have been heading for the exit. It remains below its "max buy" level after bullish action recently confirmed a technical buy signal. Near term support is at its 50 DMA line (now $73.96).
>>> The latest Featured Stock Update with an annotated graph appeared on 9/14/2012. Click here.
View all notes |
Alert me of new notes |
CANSLIM.net Company Profile |
SEC |
Zacks Reports |
StockTalk |
News |
Chart |
Request a new note
C
A N
S L
I M
|
Symbol/Exchange
Company Name
Industry Group |
PRICE |
CHANGE
(%Change) |
Day High |
Volume
(% DAV)
(% 50 day avg vol) |
52 Wk Hi
% From Hi |
Featured
Date |
Price
Featured |
Pivot Featured |
|
Max Buy |
RNF
-
NYSE
Rentech Nitrogen Ptnr Lp
CHEMICALS - Agricultural Chemicals
|
$34.80
|
-0.27
-0.77% |
$35.58
|
173,198
38.39% of 50 DAV
50 DAV is 451,200
|
$40.05
-13.11%
|
7/27/2012
|
$29.58
|
PP = $30.60
|
|
MB = $32.13
|
Most Recent Note - 10/9/2012 2:24:16 PM
G - Consolidating just above its 50 DMA line ($34.69) defining important near-term support after the previously noted upward trendline violation. Gains lacked volume conviction after it halted its slide.
>>> The latest Featured Stock Update with an annotated graph appeared on 10/4/2012. Click here.
View all notes |
Alert me of new notes |
CANSLIM.net Company Profile |
SEC |
Zacks Reports |
StockTalk |
News |
Chart |
Request a new note
C
A N
S L
I M
|
SWI
-
NYSE
Solarwinds Inc
COMPUTER SOFTWARE and SERVICES - Application Software
|
$53.39
|
+0.08
0.15% |
$53.68
|
674,570
82.96% of 50 DAV
50 DAV is 813,100
|
$60.95
-12.40%
|
7/25/2012
|
$47.82
|
PP = $47.89
|
|
MB = $50.28
|
Most Recent Note - 10/10/2012 1:42:30 PM
G - Today's loss undercut the 9/26/12 low ($53.78) raising more serious concerns. A secondary buy point was explained in the latest FSU analysis along with a new annotated graph, but caution is advised unless strength returns and it rises back above its 50 DMA line promptly. Prior highs in the $48 area define the next chart support level.
>>> The latest Featured Stock Update with an annotated graph appeared on 10/3/2012. Click here.
View all notes |
Alert me of new notes |
CANSLIM.net Company Profile |
SEC |
Zacks Reports |
StockTalk |
News |
Chart |
Request a new note
C
A N
S L
I M
|
TDG
-
NYSE
Transdigm Group Inc
AEROSPACE/DEFENSE - Aerospace/Defense Products and; Services
|
$149.17
|
+3.57
2.45% |
$150.14
|
390,498
95.62% of 50 DAV
50 DAV is 408,400
|
$152.62
-2.26%
|
8/16/2012
|
$132.23
|
PP = $136.44
|
|
MB = $143.26
|
Most Recent Note - 10/12/2012 4:06:51 PM
G - Gain today on average volume for its second-best close ever, extended from its prior base. Its 50 DMA line and prior lows define near-term support to watch in the $138 area where violations may trigger technical sell signals.
>>> The latest Featured Stock Update with an annotated graph appeared on 9/20/2012. Click here.
View all notes |
Alert me of new notes |
CANSLIM.net Company Profile |
SEC |
Zacks Reports |
StockTalk |
News |
Chart |
Request a new note
C
A N
S L
I M
|
ULTA
-
NASDAQ
Ulta Salon Cosm & Frag
SPECIALTY RETAIL - Specialty Retail, Other
|
$95.22
|
-0.43
-0.45% |
$96.91
|
586,268
80.07% of 50 DAV
50 DAV is 732,200
|
$103.52
-8.02%
|
9/4/2012
|
$93.17
|
PP = $98.52
|
|
MB = $103.45
|
Most Recent Note - 10/9/2012 2:20:54 PM
Y - Slumping near recent lows and its 50 DMA line defining important near-term chart support. Its Relative Strength Rating has slumped to 80, the minimum rank for ideal buy candidates under the fact-based investment system. The latest FSU analysis discussed its waning Relative Strength under the headline "Relative Strength Line Did Not Provide Confirmation - Friday, October 05, 2012".
>>> The latest Featured Stock Update with an annotated graph appeared on 10/5/2012. Click here.
View all notes |
Alert me of new notes |
CANSLIM.net Company Profile |
SEC |
Zacks Reports |
StockTalk |
News |
Chart |
Request a new note
C
A N
S L
I M
|
ULTI
-
NASDAQ
Ultimate Software Group
INTERNET - Internet Software and Services
|
$103.05
|
+3.57
3.59% |
$104.81
|
221,335
147.85% of 50 DAV
50 DAV is 149,700
|
$106.40
-3.15%
|
8/27/2012
|
$98.36
|
PP = $99.19
|
|
MB = $104.15
|
Most Recent Note - 10/12/2012 12:17:39 PM
Y - Considerable gain today with higher volume, rallying from its 50 DMA line to within close striking distance of its 52-week high. Recent lows in the $96 area define near-term support to watch where violations would raise concerns and trigger technical sell signals.
>>> The latest Featured Stock Update with an annotated graph appeared on 9/27/2012. Click here.
View all notes |
Alert me of new notes |
CANSLIM.net Company Profile |
SEC |
Zacks Reports |
StockTalk |
News |
Chart |
Request a new note
C
A N
S L
I M
|
Symbol/Exchange
Company Name
Industry Group |
PRICE |
CHANGE
(%Change) |
Day High |
Volume
(% DAV)
(% 50 day avg vol) |
52 Wk Hi
% From Hi |
Featured
Date |
Price
Featured |
Pivot Featured |
|
Max Buy |
VSI
-
NYSE
Vitamin Shoppe Inc
SPECIALTY RETAIL - Specialty Retail, Other
|
$56.79
|
+0.08
0.14% |
$57.07
|
270,508
78.91% of 50 DAV
50 DAV is 342,800
|
$61.83
-8.14%
|
6/29/2012
|
$54.93
|
PP = $55.03
|
|
MB = $57.78
|
Most Recent Note - 10/9/2012 2:10:09 PM
G - Volume totals have been below average in recent weeks while consolidating near its 50 DMA line. It faces some resistance due to overhead supply up through the $60 area after recently stalling. Recent lows near $55 define the next important chart support below its short-term average.
>>> The latest Featured Stock Update with an annotated graph appeared on 9/10/2012. Click here.
View all notes |
Alert me of new notes |
CANSLIM.net Company Profile |
SEC |
Zacks Reports |
StockTalk |
News |
Chart |
Request a new note
C
A N
S L
I M
|
WPI
-
NYSE
Watson Pharmaceuticals
DRUGS - Drugs - Generic
|
$86.67
|
-0.22
-0.25% |
$87.32
|
403,731
43.15% of 50 DAV
50 DAV is 935,600
|
$88.33
-1.88%
|
8/24/2012
|
$82.90
|
PP = $81.10
|
|
MB = $85.16
|
Most Recent Note - 10/9/2012 2:12:55 PM
G - Holding its ground this week with light volume totals after hitting new 52-week highs with gains on higher volume, It is extended from its prior base, and prior lows and its 50 DMA line in the $82 area define important support to watch on pullbacks.
>>> The latest Featured Stock Update with an annotated graph appeared on 9/28/2012. Click here.
View all notes |
Alert me of new notes |
CANSLIM.net Company Profile |
SEC |
Zacks Reports |
StockTalk |
News |
Chart |
Request a new note
C
A N
S L
I M
|