You are not logged in.
This means you
CAN ONLY VIEW reports that were published prior to Monday, April 14, 2025.
You
MUST UPGRADE YOUR MEMBERSHIP if you want to see any current reports.
AFTER MARKET UPDATE - TUESDAY, OCTOBER 11TH, 2011
Previous After Market Report Next After Market Report >>>
|
|
|
|
DOW |
-16.88 |
11,416.30 |
-0.15% |
|
Volume |
882,328,540 |
-1% |
|
Volume |
1,615,214,280 |
+5% |
|
NASDAQ |
+16.98 |
2,583.03 |
+0.66% |
|
Advancers |
1,650 |
53% |
|
Advancers |
1,528 |
58% |
|
S&P 500 |
+0.65 |
1,195.54 |
+0.05% |
|
Decliners |
1,336 |
43% |
|
Decliners |
994 |
38% |
|
Russell 2000 |
+4.07 |
688.97 |
+0.59% |
|
52 Wk Highs |
17 |
|
|
52 Wk Highs |
20 |
|
|
S&P 600 |
+1.39 |
380.61 |
+0.37% |
|
52 Wk Lows |
9 |
|
|
52 Wk Lows |
51 |
|
|
 |
Indices Quietly Hold Ground Above 50-Day Moving Averages Lines
Kenneth J. Gruneisen - Passed the CAN SLIM® Master's Exam
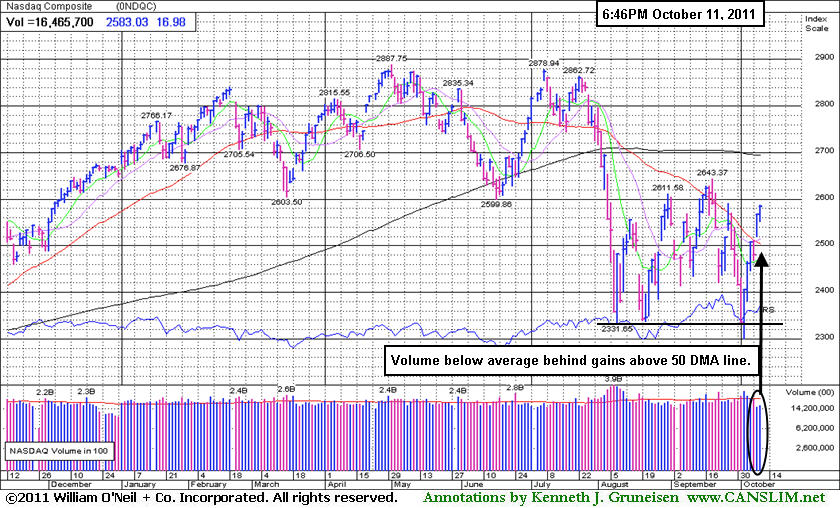
Tuesday's trading volume totals remained below average while the Dow Jones Industrial Average, S&P 500 Index, and the Nasdaq Composite Index each held its ground after unanimously rallying above their 50-day moving average lines with Monday's light volume gains. There was a positive bias to Tuesday's session as advancing issues beat decliners by 4-3 on the NYSE and by 3-2 on the Nasdaq exchange. New 52-week lows still outnumbered new 52-week highs on the Nasdaq exchange, however, new 52-week highs outnumbered new lows on the NYSE for a second consecutive session. There were 10 high-ranked companies from the CANSLIM.net Leaders List that made new 52-week highs and appeared on the CANSLIM.net BreakOuts Page, matching the prior session total. There were gains for 5 of the 6 high-ranked companies currently included on the Featured Stocks Page.
Stocks turned in a commendable performance after Monday's big rally by simply demonstrating staying power on Tuesday. Europe was temporarily on the back burner as Wall Street shrugged off cautionary comments from the President of the European Central Bank. Jean Claude Trichet warned the European debt crisis has "reached a systemic dimension," moving from smaller economies to some of the larger countries. European concerns appeared to recede as investors anticipated ratification of a re-tooled bank bailout fund. Slovakia was expected to become the last of 17 euro area nations to ratify a revised financial rescue measure for banks.
Food companies including General Mills Inc (GIS +1.55%) and Sara Lee Corp (SLE +3.47%) rose after ratings upgrades from analysts. American Airlines announced deeper cuts in seating capacity and the news boosted shares of parent AMR Corp (AMR +7.11%). Discount retailers were in the news. Dollar Thrifty Automotive Group (DTG -2.00%) edged lower after announcing that it will stay independent after receiving no adequate buyout offers. 99 Cents Only Stores (NDN +4.39%) rose after saying it will be acquired by two investors for about $1.6 billion. Technology stocks were also a source of some leadership as Citrix Systems Inc (CTXS +5.50%) hit a five-week high.
Alcoa Inc (AA +2.08%) rose ahead of its earnings report, but following a disappointing miss in after-hours action it traded lower. The company is the first Dow component to post quarterly results, which means that earnings season is officially upon us. Growth expectations for the third quarter are not as bullish as they were back at the peak of summer.
A private survey delivered some welcome news. Confidence among U.S. small companies rose in September from a 13-month low, reflecting less pessimism about the outlook for sales and the economy. Treasuries were lower before a U.S. government auction of $32 billion in three-year notes today. The 10-year Treasury note was down 22/32 to yield 2.15%.
A heavy wave of distributional action pushed the benchmark S&P 500 Index beyond the -20% Bear Market threshold at last week's lows. The market environment (M criteria) is still uncertain and disciplined investors are now watching for a follow-through day (FTD) of solid gains on higher volume from at least one of the major averages coupled with an expansion in the number of stocks hitting new highs. A convincing FTD could confirm a new rally and signal that odds have again turned more favorable for investors to begin making new buying efforts. Historic studies suggest that it is most ideal for a FTD to come between Day 4-7 of a new rally attempt. Wednesday's session will mark Day 7 of the current rally attempt.
The Q3 2011 Webcast (aired on September 28th) is now available "ON DEMAND" - (CLICK HERE) It provides an informative review of current market conditions, leading groups, and best buy candidates. All upgraded members are eligible to access the webcast presentation at no additional cost! Via the Premium Member Homepage links to all prior reports and webcasts are always available.
PICTURED: The Nasdaq Composite Index added modestly to Monday's gains, the broad market finished positive, and volatility was low compared to recent sessions. Its gains above its 50-day moving average (DMA) line have been backed by light volume.
|
 Kenneth J. Gruneisen started out as a licensed stockbroker in August 1987, a couple of months prior to the historic stock market crash that took the Dow Jones Industrial Average down -22.6% in a single day. He has published daily fact-based fundamental and technical analysis on high-ranked stocks online for two decades. Through FACTBASEDINVESTING.COM, Kenneth provides educational articles, news, market commentary, and other information regarding proven investment systems that work in good times and bad.
Comments contained in the body of this report are technical opinions only and are not necessarily those of Gruneisen Growth Corp. The material herein has been obtained from sources believed to be reliable and accurate, however, its accuracy and completeness cannot be guaranteed. Our firm, employees, and customers may effect transactions, including transactions contrary to any recommendation herein, or have positions in the securities mentioned herein or options with respect thereto. Any recommendation contained in this report may not be suitable for all investors and it is not to be deemed an offer or solicitation on our part with respect to the purchase or sale of any securities. |
|
 |
Group Action Shows No Decisiveness
Kenneth J. Gruneisen - Passed the CAN SLIM® Master's Exam
The lack of any gain or loss of as much as 1% among the groups regularly tracked in the "Industry Group Watch" section of the report emphasized the market's lack of direction or decisiveness. The Broker/Dealer Index ($XBD +0.00%) was unchanged while the Bank Index ($BKX +0.64%) and Retail Index ($RLX +0.40%) provided a slightly positive influence. The Internet Index ($IIX +0.77%) and Networking Index ($NWX +0.93%) lifted the tech sector while the Semiconductor Index ($SOX -0.30%) and Biotechnology Index ($BTK -0.10%) edged lower. Mixed action among energy-related issues helped the Oil Services Index ($OSX +0.69%) post a modest gain while the Integrated Oil Index ($XOI -0.27%) ended slightly lower. Defensive groups had a slightly negative bias as the Healthcare Index ($HMO -0.21%) and Gold & Silver Index ($XAU -0.17%) inched lower.
Charts courtesy www.stockcharts.com
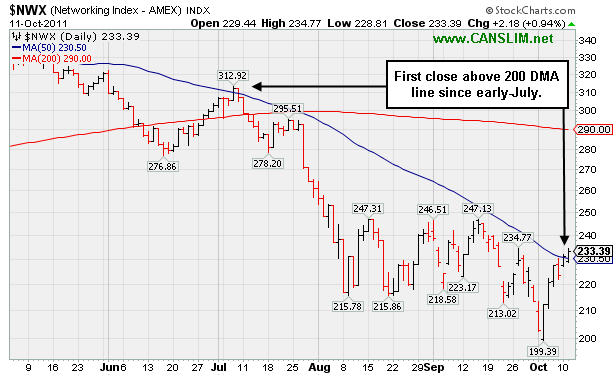
PICTURED: The Networking Index ($NWX +0.93%) managed to rally for its first close above its 200 DMA line since early-July.
| Oil Services |
$OSX |
207.89 |
+1.43 |
+0.69% |
-15.19% |
| Healthcare |
$HMO |
1,920.66 |
-4.07 |
-0.21% |
+13.51% |
| Integrated Oil |
$XOI |
1,113.30 |
-3.03 |
-0.27% |
-8.23% |
| Semiconductor |
$SOX |
365.70 |
-1.09 |
-0.30% |
-11.20% |
| Networking |
$NWX |
233.36 |
+2.16 |
+0.93% |
-16.82% |
| Internet |
$IIX |
284.42 |
+2.18 |
+0.77% |
-7.57% |
| Broker/Dealer |
$XBD |
84.38 |
+0.00 |
+0.00% |
-30.56% |
| Retail |
$RLX |
528.70 |
+2.10 |
+0.40% |
+4.00% |
| Gold & Silver |
$XAU |
193.47 |
-0.33 |
-0.17% |
-14.61% |
| Bank |
$BKX |
37.69 |
+0.24 |
+0.64% |
-27.81% |
| Biotech |
$BTK |
1,132.67 |
-1.11 |
-0.10% |
-12.71% |
|
|
|
 |
Weak Finish Reminds Investors to Resist the Urge to Get in "Early"
Kenneth J. Gruneisen - Passed the CAN SLIM® Master's Exam
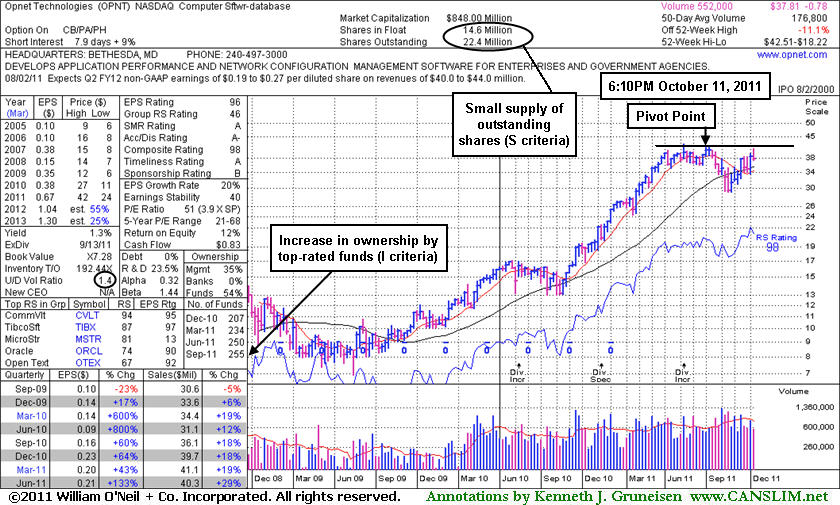
Opnet Technologies Inc (OPNT -$2.70 or -6.67% to $37.81) finished weak today with a loss on 2 times average volume after its appearance in the mid-day report (read here) where its color code was changed to yellow with a new pivot point cited based on its 6/30/11 high plus ten cents. It was cautiously noted - "Volume-driven gains above its pivot point may trigger a technical buy signal. It has rebounded after slumping below its 200 DMA line during its consolidation since dropped from the Featured Stocks list on 7/21/11." Its last appearance in this FSU section on 7/01/11 included an annotated graph under the headline, "New Base Formation Awaiting Technical Breakout", while it was perched near its 52-week high after building an orderly base. Those who followed it before may recall the prudent warning that - "Disciplined investors resist the urge to get in 'early' and would watch for a confirming technical buy signal before taking action."
Recent quarters showed decent sales revenues growth and earnings above the +25% minimum guideline. Its annual earnings growth rate (A criteria) has been respectable since a previously noted downturn in FY '08. The lack of robust leadership (L criteria) in the Computer Software - Database group (current Group RS Rating 46) is somewhat discouraging. However, its Up/Down Volume Ratio of 1.4 suggests that it has recently been under accumulation. Ownership by top-rated funds rose from 188 in Sep '10 to 255 in Jun '11, another reassuring sign concerning the I criteria. Return On Equity is reported at 12%, which is below the 17% guideline. However, management owns a 35% stake in its shares, keeping the directors motivated to maintain and build shareholder value.
|
|
|
Color Codes Explained :
Y - Better candidates highlighted by our
staff of experts.
G - Previously featured
in past reports as yellow but may no longer be buyable under the
guidelines.
***Last / Change / Volume data in this table is the closing quote data***
Symbol/Exchange
Company Name
Industry Group |
PRICE |
CHANGE
(%Change) |
Day High |
Volume
(% DAV)
(% 50 day avg vol) |
52 Wk Hi
% From Hi |
Featured
Date |
Price
Featured |
Pivot Featured |
|
Max Buy |
AAPL
-
NASDAQ
Apple Inc
COMPUTER HARDWARE - Personal Computers
|
$400.29
|
+11.48
2.95% |
$403.18
|
21,600,162
92.22% of 50 DAV
50 DAV is 23,421,200
|
$422.86
-5.34%
|
9/16/2011
|
$399.14
|
PP = $404.60
|
|
MB = $424.83
|
 Most Recent Note - 10/11/2011 5:57:29 PM
G - Rallied further above its 50 DMA line with near average volume today but it has not formed a sound base pattern. Found support at its longer-term 200 DMA line again last week.
>>> The latest Featured Stock Update with an annotated graph appeared on 10/6/2011. Click here.
View all notes |
Alert me of new notes |
CANSLIM.net Company Profile |
SEC |
Zacks Reports |
StockTalk |
News |
Chart |
Request a new note
C
A N
S L
I M


|
ALXN
-
NASDAQ
Alexion Pharmaceuticals
DRUGS - Drug Manufacturers - Other
|
$68.83
|
+0.95
1.40% |
$70.20
|
1,545,634
91.52% of 50 DAV
50 DAV is 1,688,900
|
$68.50
0.48%
|
9/15/2011
|
$63.20
|
PP = $60.81
|
|
MB = $63.85
|
Most Recent Note - 10/11/2011 5:59:22 PM
G - Gain today with near average volume helped it hit a new all-time high. This high-ranked Medical - Biomed/Biotech group leader is extended from its prior base. Support to watch includes prior resistance in the $59-60 area and its upwardly tilted 50 DMA line.
>>> The latest Featured Stock Update with an annotated graph appeared on 10/5/2011. Click here.
View all notes |
Alert me of new notes |
CANSLIM.net Company Profile |
SEC |
Zacks Reports |
StockTalk |
News |
Chart |
Request a new note
C
A N
S L
I M
|
CELG
-
NASDAQ
Celgene Corp
DRUGS - Drug Manufacturers - Major
|
$66.33
|
+0.80
1.22% |
$66.90
|
3,637,978
82.42% of 50 DAV
50 DAV is 4,414,000
|
$66.98
-0.97%
|
9/16/2011
|
$61.21
|
PP = $62.59
|
|
MB = $65.72
|
Most Recent Note - 10/11/2011 6:03:04 PM
G - Up today with light volume. No resistance remains due to overhead supply after a 10/10/11 gap up and rally to a new 52-week high. Color code was changed to green after getting extended from its prior base.
>>> The latest Featured Stock Update with an annotated graph appeared on 10/4/2011. Click here.
View all notes |
Alert me of new notes |
CANSLIM.net Company Profile |
SEC |
Zacks Reports |
StockTalk |
News |
Chart |
Request a new note
C
A N
S L
I M
|
MG
-
NYSE
Mistras Group Inc
DIVERSIFIED SERVICES - Bulding and Faci;ity Management Services
|
$19.82
|
+0.36
1.85% |
$20.21
|
367,361
166.68% of 50 DAV
50 DAV is 220,400
|
$21.18
-6.42%
|
8/10/2011
|
$17.89
|
PP = $17.58
|
|
MB = $18.46
|
Most Recent Note - 10/11/2011 6:04:31 PM
G - Higher volume totals without meaningful price progress are an indication of distributional pressure this week. Recently tried to rise without great volume conviction from a 5-week consolidation that may be considered a "base-on-base" type pattern, however no new pivot point was cited. Additionally, the M criteria argues against new (or add-on) buying efforts in otherwise worthy buy candidates until the nascent new rally effort is confirmed by a solid follow-through day.
>>> The latest Featured Stock Update with an annotated graph appeared on 9/30/2011. Click here.
View all notes |
Alert me of new notes |
CANSLIM.net Company Profile |
SEC |
Zacks Reports |
StockTalk |
News |
Chart |
Request a new note
C
A N
S L
I M
|
OPNT
-
NASDAQ
Opnet Technologies
INTERNET - Internet Software and Services
|
$37.81
|
-2.70
-6.67% |
$40.14
|
318,192
183.61% of 50 DAV
50 DAV is 173,300
|
$42.51
-11.06%
|
10/11/2011
|
$38.45
|
PP = $42.02
|
|
MB = $44.12
|
Most Recent Note - 10/11/2011 6:57:43 PM
Y - Finished with a loss on above average volume today. In the mid-day report its color code was changed to yellow with new pivot point cited based on its 6/30/11 high plus ten cents. Volume-driven gains above its pivot point may eventually trigger a technical buy signal. Meanwhile, it has rebounded after slumping below its 200 DMA line during its consolidation since dropped from the Featured Stocks list on 7/21/11. See the latest FSU analysis for more details and an annotated weekly graph.

>>> The latest Featured Stock Update with an annotated graph appeared on 10/11/2011. Click here.
View all notes |
Alert me of new notes |
CANSLIM.net Company Profile |
SEC |
Zacks Reports |
StockTalk |
News |
Chart |
Request a new note
C
A N
S L
I M
|
Symbol/Exchange
Company Name
Industry Group |
PRICE |
CHANGE
(%Change) |
Day High |
Volume
(% DAV)
(% 50 day avg vol) |
52 Wk Hi
% From Hi |
Featured
Date |
Price
Featured |
Pivot Featured |
|
Max Buy |
V
-
NYSE
Visa Inc Cl A
DIVERSIFIED SERVICES - Business/Management Services
|
$90.51
|
+1.26
1.41% |
$90.86
|
4,406,688
69.81% of 50 DAV
50 DAV is 6,312,000
|
$94.75
-4.47%
|
9/20/2011
|
$93.91
|
PP = $90.93
|
|
MB = $95.48
|
Most Recent Note - 10/11/2011 6:06:05 PM
G - Up again today with light volume while rebounding further above its 50 DMA line. See the latest FSU analysis for more details and a new annotated graph.
>>> The latest Featured Stock Update with an annotated graph appeared on 10/10/2011. Click here.
View all notes |
Alert me of new notes |
CANSLIM.net Company Profile |
SEC |
Zacks Reports |
StockTalk |
News |
Chart |
Request a new note
C
A N
S L
I M
|
|
|
|
THESE ARE NOT BUY RECOMMENDATIONS!
Comments contained in the body of this report are technical
opinions only. The material herein has been obtained
from sources believed to be reliable and accurate, however,
its accuracy and completeness cannot be guaranteed.
This site is not an investment advisor, hence it does
not endorse or recommend any securities or other investments.
Any recommendation contained in this report may not
be suitable for all investors and it is not to be deemed
an offer or solicitation on our part with respect to
the purchase or sale of any securities. All trademarks,
service marks and trade names appearing in this report
are the property of their respective owners, and are
likewise used for identification purposes only.
This report is a service available
only to active Paid Premium Members.
You may opt-out of receiving report notifications
at any time. Questions or comments may be submitted
by writing to Premium Membership Services 665 S.E. 10 Street, Suite 201 Deerfield Beach, FL 33441-5634 or by calling 1-800-965-8307
or 954-785-1121.
|
|
|

