***Last / Change / Volume data in this table is the closing quote data***
Symbol/Exchange
Company Name
Industry Group |
PRICE |
CHANGE
(%Change) |
Day High |
Volume
(% DAV)
(% 50 day avg vol) |
52 Wk Hi
% From Hi |
Featured
Date |
Price
Featured |
Pivot Featured |
|
Max Buy |
ALXN
-
NASDAQ
Alexion Pharmaceuticals
DRUGS - Drug Manufacturers - Other
|
$111.30
|
-3.94
-3.42% |
$114.93
|
1,372,350
134.78% of 50 DAV
50 DAV is 1,018,200
|
$119.54
-6.89%
|
8/23/2012
|
$103.70
|
PP = $110.06
|
|
MB = $115.56
|
 Most Recent Note - 10/9/2012 1:47:51 PM
Y - Color code is changed to yellow after retreating below its "max buy" level. The prior highs in the $110 area define chart support along with its 50 DMA line where violations would raise concerns and trigger technical sell signals..
>>> The latest Featured Stock Update with an annotated graph appeared on 9/26/2012. Click here.
View all notes |
Alert me of new notes |
CANSLIM.net Company Profile |
SEC |
Zacks Reports |
StockTalk |
News |
Chart |
Request a new note
C
A N
S L
I M


|
ASPS
-
NASDAQ
Altisource Ptf Sltns Sa
REAL ESTATE - Property Management/Developmen
|
$108.41
|
-3.38
-3.02% |
$111.56
|
246,315
144.04% of 50 DAV
50 DAV is 171,000
|
$115.73
-6.33%
|
9/24/2012
|
$87.24
|
PP = $92.39
|
|
MB = $97.01
|
Most Recent Note - 10/9/2012 1:48:46 PM
G - Consolidating after getting very extended from its prior base with 2 big volume-driven gains last week. Prior highs in the $92 area define initial support to watch on pullbacks.
>>> The latest Featured Stock Update with an annotated graph appeared on 9/11/2012. Click here.
View all notes |
Alert me of new notes |
CANSLIM.net Company Profile |
SEC |
Zacks Reports |
StockTalk |
News |
Chart |
Request a new note
C
A N
S L
I M
|
BRLI
-
NASDAQ
Bio Reference Labs Inc
HEALTH SERVICES - Medical Laboratories and Researc
|
$30.96
|
-0.55
-1.75% |
$31.78
|
323,928
117.75% of 50 DAV
50 DAV is 275,100
|
$32.86
-5.78%
|
10/3/2012
|
$30.90
|
PP = $30.25
|
|
MB = $31.76
|
Most Recent Note - 10/8/2012 6:13:38 PM
G - Consolidating above its "max buy" level today after triggering a technical buy signal on 10/03/12 with a considerable volume-driven gain above its pivot point. See the latest FSU analysis for more details and a new annotated graph.
>>> The latest Featured Stock Update with an annotated graph appeared on 10/8/2012. Click here.
View all notes |
Alert me of new notes |
CANSLIM.net Company Profile |
SEC |
Zacks Reports |
StockTalk |
News |
Chart |
Request a new note
C
A N
S L
I M
|
CFNL
-
NASDAQ
Cardinal Financial Corp
BANKING - Regional - Southeast Banks
|
$14.21
|
-0.07
-0.49% |
$14.43
|
97,775
128.99% of 50 DAV
50 DAV is 75,800
|
$14.79
-3.92%
|
8/17/2012
|
$12.84
|
PP = $13.31
|
|
MB = $13.98
|
Most Recent Note - 10/9/2012 1:53:54 PM
G - Halted its slide with volume-driven gains following the damaging loss on heavy volume previously noted on 10/03/12. That session's low ($13.80) defines near-term support above its 50 DMA line ($13.44 now) where a violation would trigger a technical sell signal.
>>> The latest Featured Stock Update with an annotated graph appeared on 9/25/2012. Click here.
View all notes |
Alert me of new notes |
CANSLIM.net Company Profile |
SEC |
Zacks Reports |
StockTalk |
News |
Chart |
Request a new note
C
A N
S L
I M
|
CMCSA
-
NASDAQ
Comcast Corp Cl A
MEDIA - CATV Systems
|
$35.32
|
-0.89
-2.46% |
$36.16
|
12,280,387
98.70% of 50 DAV
50 DAV is 12,442,000
|
$36.98
-4.49%
|
6/11/2012
|
$29.94
|
PP = $30.98
|
|
MB = $32.53
|
Most Recent Note - 10/9/2012 1:56:21 PM
G - Consolidating quietly after wedging to a new 52-week high with gains in the past week lacking great volume conviction. Prior highs in the $35 area define support to watch above its 50 DMA line where violations would trigger technical sell signals. Fundamental concerns have been repeatedly noted - "Due to sub par sales and earnings growth in the Jun '12 quarter."
>>> The latest Featured Stock Update with an annotated graph appeared on 9/21/2012. Click here.
View all notes |
Alert me of new notes |
CANSLIM.net Company Profile |
SEC |
Zacks Reports |
StockTalk |
News |
Chart |
Request a new note
C
A N
S L
I M
|
Symbol/Exchange
Company Name
Industry Group |
PRICE |
CHANGE
(%Change) |
Day High |
Volume
(% DAV)
(% 50 day avg vol) |
52 Wk Hi
% From Hi |
Featured
Date |
Price
Featured |
Pivot Featured |
|
Max Buy |
DVA
-
NYSE
Davita Inc
HEALTH SERVICES - Specialized Health Services
|
$107.82
|
-0.59
-0.54% |
$108.73
|
705,823
94.37% of 50 DAV
50 DAV is 747,900
|
$109.31
-1.36%
|
9/5/2012
|
$102.92
|
PP = $100.62
|
|
MB = $105.65
|
Most Recent Note - 10/9/2012 1:58:20 PM
G - Stubbornly holding its ground near its 52-week high after getting extended from its latest sound base. Prior highs near $100 and its 50 DMA line define near term support to watch on pullbacks where violations may trigger technical sell signals.
>>> The latest Featured Stock Update with an annotated graph appeared on 9/5/2012. Click here.
View all notes |
Alert me of new notes |
CANSLIM.net Company Profile |
SEC |
Zacks Reports |
StockTalk |
News |
Chart |
Request a new note
C
A N
S L
I M
|
EXPE
-
NASDAQ
Expedia Inc
INTERNET - Internet Information Providers
|
$55.48
|
-1.32
-2.32% |
$56.77
|
2,825,514
102.25% of 50 DAV
50 DAV is 2,763,300
|
$60.29
-7.98%
|
4/27/2012
|
$41.80
|
PP = $35.57
|
|
MB = $37.35
|
Most Recent Note - 10/8/2012 4:02:50 PM
G - Volume totals have been below average after forming a late-stage cup-with-handle type base and it is currently perched -5.7% off its 52-week high while quietly consolidating above its 50 DMA line. It has been noted a few times in recent weeks - "No overhead supply remains to hinder its progress, however weak industry group action and iffy fundamentals were noted as causes for concern." See more details and an annotated graph in the latest FSU analysis under the headline "Online Travel Firm Resilient Despite Unfavorable Signs - Wednesday, September 19, 2012"
>>> The latest Featured Stock Update with an annotated graph appeared on 9/19/2012. Click here.
View all notes |
Alert me of new notes |
CANSLIM.net Company Profile |
SEC |
Zacks Reports |
StockTalk |
News |
Chart |
Request a new note
C
A N
S L
I M
|
GPX
-
NYSE
G P Strategies Corp
DIVERSIFIED SERVICES - Education and Training Services
|
$19.56
|
-0.42
-2.10% |
$19.97
|
26,161
34.11% of 50 DAV
50 DAV is 76,700
|
$20.67
-5.37%
|
10/8/2012
|
$20.00
|
PP = $20.77
|
|
MB = $21.81
|
Most Recent Note - 10/8/2012 4:07:52 PM
Y - Perched only -3.1% off its 52-week high today, it recently found support at its 50 DMA line. Color code is changed to yellow with new pivot point cited based on its 8/29/12 high plus 10 cents. Volume driven gains above the pivot point may trigger a new (or add-on) technical buy signal. Losses exceeding last week's low $18.82 would raise concerns and trigger technical sell signals.
>>> The latest Featured Stock Update with an annotated graph appeared on 9/13/2012. Click here.
View all notes |
Alert me of new notes |
CANSLIM.net Company Profile |
SEC |
Zacks Reports |
StockTalk |
News |
Chart |
Request a new note
C
A N
S L
I M
|
LKQ
-
NASDAQ
L K Q Corp
WHOLESALE - Auto Parts
|
$19.28
|
-0.13
-0.67% |
$19.44
|
1,401,782
101.70% of 50 DAV
50 DAV is 1,378,400
|
$20.02
-3.67%
|
8/9/2012
|
$18.97
|
PP = $18.72
|
|
MB = $19.66
|
Most Recent Note - 10/3/2012 6:22:53 PM
Y - Rebounded above its 50 DMA line helping its technical stance with today's gain backed by above average volume, and its color code is changed to yellow again. Do not be confused by a 2:1 share split effective 9/19/12 (Featured Price, Pivot Point and Max Buy were adjusted).
>>> The latest Featured Stock Update with an annotated graph appeared on 9/17/2012. Click here.
View all notes |
Alert me of new notes |
CANSLIM.net Company Profile |
SEC |
Zacks Reports |
StockTalk |
News |
Chart |
Request a new note
C
A N
S L
I M
|
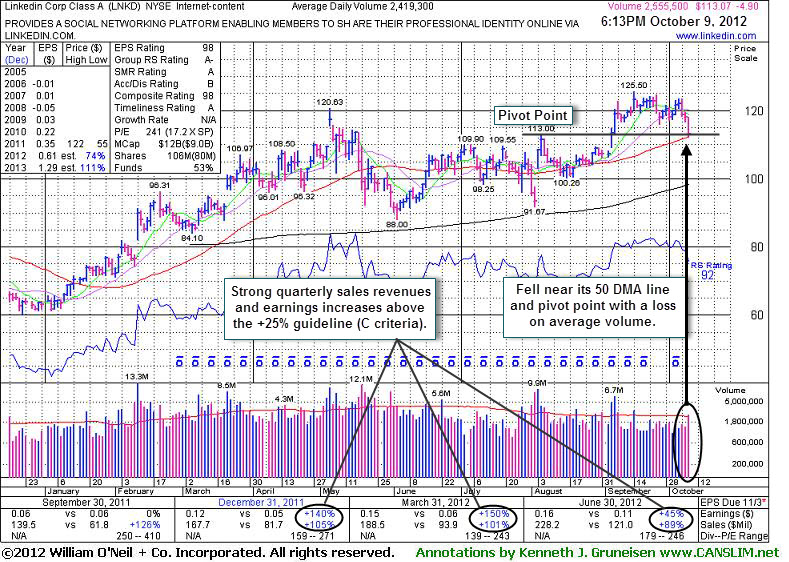
LNKD
-
NYSE
Linkedin Corp Class A
INTERNET - Internet Information Providers
|
$113.07
|
-4.90
-4.15% |
$118.00
|
2,570,339
106.24% of 50 DAV
50 DAV is 2,419,300
|
$125.50
-9.90%
|
9/5/2012
|
$113.25
|
PP = $113.10
|
|
MB = $118.76
|
Most Recent Note - 10/9/2012 6:52:17 PM
Y - Fell today on higher (near average) volume to prior highs in the $113 area and its 50 DMA line previously noted as important near-term support. Subsequent violations may trigger technical sell signals. See the latest FSU analysis for more details and a new annotated graph.
>>> The latest Featured Stock Update with an annotated graph appeared on 10/9/2012. Click here.
View all notes |
Alert me of new notes |
CANSLIM.net Company Profile |
SEC |
Zacks Reports |
StockTalk |
News |
Chart |
Request a new note
C
A N
S L
I M
|
Symbol/Exchange
Company Name
Industry Group |
PRICE |
CHANGE
(%Change) |
Day High |
Volume
(% DAV)
(% 50 day avg vol) |
52 Wk Hi
% From Hi |
Featured
Date |
Price
Featured |
Pivot Featured |
|
Max Buy |
LULU
-
NASDAQ
Lululemon Athletica
MANUFACTURING - Textile Manufacturing
|
$72.79
|
-2.62
-3.47% |
$75.67
|
1,789,135
69.94% of 50 DAV
50 DAV is 2,558,100
|
$81.09
-10.24%
|
10/2/2012
|
$74.89
|
PP = $78.97
|
|
MB = $82.92
|
Most Recent Note - 10/8/2012 4:11:58 PM
Y - Following its cup-with-handle base pattern there have not yet been the volume-driven gains above its pivot point needed to confirm a technical buy signal. Fundamentals remain strong (good C and A criteria) and very little resistance from overhead supply is there to hinder its progress.
>>> The latest Featured Stock Update with an annotated graph appeared on 10/2/2012. Click here.
View all notes |
Alert me of new notes |
CANSLIM.net Company Profile |
SEC |
Zacks Reports |
StockTalk |
News |
Chart |
Request a new note
C
A N
S L
I M
|
MIDD
-
NASDAQ
Middleby Corp
MANUFACTURING - Diversified Machinery
|
$117.29
|
-0.94
-0.80% |
$119.08
|
42,080
41.17% of 50 DAV
50 DAV is 102,200
|
$122.57
-4.31%
|
10/8/2012
|
$118.46
|
PP = $122.67
|
|
MB = $128.80
|
Most Recent Note - 10/8/2012 3:54:32 PM
Y - Perched -3.4% off its 52-week high today with volume totals cooling in recent weeks while holding its ground. Color code is changed to yellow with new pivot point cited based on its 9/06/12 high plus 10 cents. Subsequent volume-driven gains above the pivot point may trigger a new (or add-on) technical buy signal. Its 50 DMA line and recent lows define near-term chart support to watch.
>>> The latest Featured Stock Update with an annotated graph appeared on 9/18/2012. Click here.
View all notes |
Alert me of new notes |
CANSLIM.net Company Profile |
SEC |
Zacks Reports |
StockTalk |
News |
Chart |
Request a new note
C
A N
S L
I M
|
N
-
NYSE
Netsuite Inc
DIVERSIFIED SERVICES - Business/Management Services
|
$59.89
|
-2.32
-3.73% |
$62.40
|
597,138
99.14% of 50 DAV
50 DAV is 602,300
|
$64.70
-7.43%
|
8/20/2012
|
$55.88
|
PP = $59.32
|
|
MB = $62.29
|
Most Recent Note - 10/9/2012 2:01:26 PM
Y - Color code is changed to yellow while quietly consolidating back below its "max buy" level. Prior highs near $59 closely coincide with its 50 DMA line defining important chart support where subsequent violations would trigger technical sell signals.
>>> The latest Featured Stock Update with an annotated graph appeared on 9/24/2012. Click here.
View all notes |
Alert me of new notes |
CANSLIM.net Company Profile |
SEC |
Zacks Reports |
StockTalk |
News |
Chart |
Request a new note
C
A N
S L
I M
|
NSM
-
NYSE
Nationstar Mtg Hldgs Inc
FINANCIAL SERVICES - Credit Services
|
$33.29
|
-0.76
-2.23% |
$34.22
|
1,175,420
101.74% of 50 DAV
50 DAV is 1,155,300
|
$37.20
-10.51%
|
8/29/2012
|
$27.96
|
PP = $28.85
|
|
MB = $30.29
|
Most Recent Note - 10/5/2012 5:47:11 PM
G - A steep upward trendline defines a near-term support level above its 50 DMA line. Finished today at the session low with a loss on above average volume. A worrisome "negative reversal" on 10/03/12 after hitting a new 52-week high raised some concerns after repeatedly noted as - "Extended from its prior base."
>>> The latest Featured Stock Update with an annotated graph appeared on 9/7/2012. Click here.
View all notes |
Alert me of new notes |
CANSLIM.net Company Profile |
SEC |
Zacks Reports |
StockTalk |
News |
Chart |
Request a new note
C
A N
S L
I M
|
OSIS
-
NASDAQ
O S I Systems Inc
ELECTRONICS - Semiconductor Equipment and Mate
|
$75.25
|
-0.51
-0.67% |
$75.58
|
79,243
59.76% of 50 DAV
50 DAV is 132,600
|
$78.93
-4.66%
|
9/5/2012
|
$74.39
|
PP = $75.10
|
|
MB = $78.86
|
Most Recent Note - 10/8/2012 4:13:40 PM
Y - Consolidating just -4% off its 52-week high today. It remains below its "max buy" level after bullish action recently confirmed a technical buy signal. Near term support is at its 50 DMA line.
>>> The latest Featured Stock Update with an annotated graph appeared on 9/14/2012. Click here.
View all notes |
Alert me of new notes |
CANSLIM.net Company Profile |
SEC |
Zacks Reports |
StockTalk |
News |
Chart |
Request a new note
C
A N
S L
I M
|
Symbol/Exchange
Company Name
Industry Group |
PRICE |
CHANGE
(%Change) |
Day High |
Volume
(% DAV)
(% 50 day avg vol) |
52 Wk Hi
% From Hi |
Featured
Date |
Price
Featured |
Pivot Featured |
|
Max Buy |
RNF
-
NYSE
Rentech Nitrogen Ptnr Lp
CHEMICALS - Agricultural Chemicals
|
$35.48
|
-0.72
-1.99% |
$36.71
|
314,582
67.36% of 50 DAV
50 DAV is 467,000
|
$40.05
-11.41%
|
7/27/2012
|
$29.58
|
PP = $30.60
|
|
MB = $32.13
|
Most Recent Note - 10/9/2012 2:24:16 PM
G - Consolidating just above its 50 DMA line ($34.69) defining important near-term support after the previously noted upward trendline violation. Gains lacked volume conviction after it halted its slide.
>>> The latest Featured Stock Update with an annotated graph appeared on 10/4/2012. Click here.
View all notes |
Alert me of new notes |
CANSLIM.net Company Profile |
SEC |
Zacks Reports |
StockTalk |
News |
Chart |
Request a new note
C
A N
S L
I M
|
SWI
-
NYSE
Solarwinds Inc
COMPUTER SOFTWARE and SERVICES - Application Software
|
$54.71
|
-1.54
-2.74% |
$56.12
|
779,602
77.74% of 50 DAV
50 DAV is 1,002,800
|
$60.95
-10.24%
|
7/25/2012
|
$47.82
|
PP = $47.89
|
|
MB = $50.28
|
Most Recent Note - 10/9/2012 2:05:22 PM
G - Color code is changed to green while slumping under its 50 DMA line on below average volume for a 3rd consecutive loss, raising concerns. A subsequent violation of the 9/26/12 low ($53.78) could raise more serious concerns and trigger technical sell signals. A secondary buy point was explained in the latest FSU analysis along with a new annotated graph, but caution is advised unless strength returns and it rises back above its 50 DMA line promptly.
>>> The latest Featured Stock Update with an annotated graph appeared on 10/3/2012. Click here.
View all notes |
Alert me of new notes |
CANSLIM.net Company Profile |
SEC |
Zacks Reports |
StockTalk |
News |
Chart |
Request a new note
C
A N
S L
I M
|
TDG
-
NYSE
Transdigm Group Inc
AEROSPACE/DEFENSE - Aerospace/Defense Products and; Services
|
$145.98
|
-0.86
-0.59% |
$147.88
|
274,343
65.77% of 50 DAV
50 DAV is 417,100
|
$152.62
-4.35%
|
8/16/2012
|
$132.23
|
PP = $136.44
|
|
MB = $143.26
|
Most Recent Note - 10/4/2012 7:24:04 PM
G - Rallied further above its "max buy" level to another new 52-week high with above average volume behind today's 3rd consecutive gain. Its 50 DMA line and prior highs define near-term support to watch in the $135-136 area on pullbacks.
>>> The latest Featured Stock Update with an annotated graph appeared on 9/20/2012. Click here.
View all notes |
Alert me of new notes |
CANSLIM.net Company Profile |
SEC |
Zacks Reports |
StockTalk |
News |
Chart |
Request a new note
C
A N
S L
I M
|
ULTA
-
NASDAQ
Ulta Salon Cosm & Frag
SPECIALTY RETAIL - Specialty Retail, Other
|
$95.75
|
-2.42
-2.47% |
$98.05
|
324,328
42.86% of 50 DAV
50 DAV is 756,700
|
$103.52
-7.51%
|
9/4/2012
|
$93.17
|
PP = $98.52
|
|
MB = $103.45
|
Most Recent Note - 10/9/2012 2:20:54 PM
Y - Slumping near recent lows and its 50 DMA line defining important near-term chart support. Its Relative Strength Rating has slumped to 80, the minimum rank for ideal buy candidates under the fact-based investment system. The latest FSU analysis discussed its waning Relative Strength under the headline "Relative Strength Line Did Not Provide Confirmation - Friday, October 05, 2012".
>>> The latest Featured Stock Update with an annotated graph appeared on 10/5/2012. Click here.
View all notes |
Alert me of new notes |
CANSLIM.net Company Profile |
SEC |
Zacks Reports |
StockTalk |
News |
Chart |
Request a new note
C
A N
S L
I M
|
ULTI
-
NASDAQ
Ultimate Software Group
INTERNET - Internet Software and Services
|
$98.94
|
-1.96
-1.94% |
$101.19
|
133,159
80.60% of 50 DAV
50 DAV is 165,200
|
$106.40
-7.01%
|
8/27/2012
|
$98.36
|
PP = $99.19
|
|
MB = $104.15
|
Most Recent Note - 10/5/2012 8:02:08 PM
Y - Erased its prior gain today, closing back below its "max buy" level and its color code is changed to yellow. Recent lows define initial support to watch along with its 50 DMA line in the $96 area where violations would raise concerns and trigger technical sell signals.
>>> The latest Featured Stock Update with an annotated graph appeared on 9/27/2012. Click here.
View all notes |
Alert me of new notes |
CANSLIM.net Company Profile |
SEC |
Zacks Reports |
StockTalk |
News |
Chart |
Request a new note
C
A N
S L
I M
|
Symbol/Exchange
Company Name
Industry Group |
PRICE |
CHANGE
(%Change) |
Day High |
Volume
(% DAV)
(% 50 day avg vol) |
52 Wk Hi
% From Hi |
Featured
Date |
Price
Featured |
Pivot Featured |
|
Max Buy |
VSI
-
NYSE
Vitamin Shoppe Inc
SPECIALTY RETAIL - Specialty Retail, Other
|
$57.03
|
-1.15
-1.98% |
$58.27
|
135,314
38.00% of 50 DAV
50 DAV is 356,100
|
$61.83
-7.76%
|
6/29/2012
|
$54.93
|
PP = $55.03
|
|
MB = $57.78
|
Most Recent Note - 10/9/2012 2:10:09 PM
G - Volume totals have been below average in recent weeks while consolidating near its 50 DMA line. It faces some resistance due to overhead supply up through the $60 area after recently stalling. Recent lows near $55 define the next important chart support below its short-term average.
>>> The latest Featured Stock Update with an annotated graph appeared on 9/10/2012. Click here.
View all notes |
Alert me of new notes |
CANSLIM.net Company Profile |
SEC |
Zacks Reports |
StockTalk |
News |
Chart |
Request a new note
C
A N
S L
I M
|
WPI
-
NYSE
Watson Pharmaceuticals
DRUGS - Drugs - Generic
|
$87.18
|
-0.65
-0.74% |
$87.81
|
733,099
74.97% of 50 DAV
50 DAV is 977,900
|
$88.06
-1.00%
|
8/24/2012
|
$82.90
|
PP = $81.10
|
|
MB = $85.16
|
Most Recent Note - 10/9/2012 2:12:55 PM
G - Holding its ground this week with light volume totals after hitting new 52-week highs with gains on higher volume, It is extended from its prior base, and prior lows and its 50 DMA line in the $82 area define important support to watch on pullbacks.
>>> The latest Featured Stock Update with an annotated graph appeared on 9/28/2012. Click here.
View all notes |
Alert me of new notes |
CANSLIM.net Company Profile |
SEC |
Zacks Reports |
StockTalk |
News |
Chart |
Request a new note
C
A N
S L
I M
|


.JPG)