***Last / Change / Volume data in this table is the closing quote data***
Symbol/Exchange
Company Name
Industry Group |
PRICE |
CHANGE
(%Change) |
Day High |
Volume
(% DAV)
(% 50 day avg vol) |
52 Wk Hi
% From Hi |
Featured
Date |
Price
Featured |
Pivot Featured |
|
Max Buy |
AVG
-
NYSE
A V G Technologies N.V.
INTERNET - Internet Software and Services
|
$22.30
|
-1.25
-5.31% |
$23.55
|
1,820,355
194.30% of 50 DAV
50 DAV is 936,900
|
$26.56
-16.03%
|
9/13/2013
|
$23.06
|
PP = $23.88
|
|
MB = $25.07
|
 Most Recent Note - 10/8/2013 12:53:50 PM
G - Color code is changed to green while slumping below prior highs in the $23 area and violating its 50 DMA line triggering technical sell signals. Only a prompt rebound above that important short-term average would help its outlook.
>>> The latest Featured Stock Update with an annotated graph appeared on 9/13/2013. Click here.
View all notes |
Alert me of new notes |
CANSLIM.net Company Profile |
SEC |
Zacks Reports |
StockTalk |
News |
Chart |
Request a new note
C
A N
S L
I M


|
BITA
-
NYSE
Bitauto Hldgs Ltd Ads
INTERNET - Internet Information Providers
|
$19.13
|
-2.60
-11.97% |
$22.67
|
2,264,334
427.07% of 50 DAV
50 DAV is 530,200
|
$22.37
-14.48%
|
9/24/2013
|
$16.40
|
PP = $17.31
|
|
MB = $18.18
|
Most Recent Note - 10/8/2013 12:45:07 PM
G - Hit another new 52-week high today and then reversed into the red. Prior highs in the $18 area define define initial support to watch on pullbacks.
>>> The latest Featured Stock Update with an annotated graph appeared on 10/2/2013. Click here.
View all notes |
Alert me of new notes |
CANSLIM.net Company Profile |
SEC |
Zacks Reports |
StockTalk |
News |
Chart |
Request a new note
C
A N
S L
I M
|
CELG
-
NASDAQ
Celgene Corp
DRUGS - Drug Manufacturers - Major
|
$148.53
|
-5.34
-3.47% |
$155.24
|
3,869,994
155.90% of 50 DAV
50 DAV is 2,482,400
|
$157.95
-5.96%
|
9/12/2013
|
$149.50
|
PP = $150.02
|
|
MB = $157.52
|
Most Recent Note - 10/4/2013 11:32:47 PM
Y - Rallied for a best-ever close and hit another new 52-week high today. It is trading near its "max buy" level. Its 50 DMA line ($144.88 now) defines near-term support to watch.
>>> The latest Featured Stock Update with an annotated graph appeared on 9/20/2013. Click here.
View all notes |
Alert me of new notes |
CANSLIM.net Company Profile |
SEC |
Zacks Reports |
StockTalk |
News |
Chart |
Request a new note
C
A N
S L
I M
|
EGBN
-
NASDAQ
Eagle Bancorp Inc
BANKING - Regional - Mid-Atlantic Banks
|
$27.18
|
-0.46
-1.66% |
$27.69
|
66,952
96.75% of 50 DAV
50 DAV is 69,200
|
$28.78
-5.56%
|
9/16/2013
|
$27.48
|
PP = $27.77
|
|
MB = $29.16
|
Most Recent Note - 10/8/2013 5:17:39 PM
Y - Consolidating above prior highs and above its 50 DMA line, still holding its ground stubbornly after a recent spurt of volume-driven gains.
>>> The latest Featured Stock Update with an annotated graph appeared on 9/16/2013. Click here.
View all notes |
Alert me of new notes |
CANSLIM.net Company Profile |
SEC |
Zacks Reports |
StockTalk |
News |
Chart |
Request a new note
C
A N
S L
I M
|
FLT
-
NYSE
Fleetcor Technologies
DIVERSIFIED SERVICES - Business/Management Services
|
$104.57
|
-7.24
-6.48% |
$112.25
|
1,362,514
205.04% of 50 DAV
50 DAV is 664,500
|
$113.68
-8.01%
|
8/19/2013
|
$99.01
|
PP = $100.97
|
|
MB = $106.02
|
Most Recent Note - 10/8/2013 5:02:19 PM
G - Down considerably today with above average volume, sinking quickly to its 50 DMA line. A violation may trigger a more worrisome technical sell signal.
>>> The latest Featured Stock Update with an annotated graph appeared on 10/7/2013. Click here.
View all notes |
Alert me of new notes |
CANSLIM.net Company Profile |
SEC |
Zacks Reports |
StockTalk |
News |
Chart |
Request a new note
C
A N
S L
I M
|
Symbol/Exchange
Company Name
Industry Group |
PRICE |
CHANGE
(%Change) |
Day High |
Volume
(% DAV)
(% 50 day avg vol) |
52 Wk Hi
% From Hi |
Featured
Date |
Price
Featured |
Pivot Featured |
|
Max Buy |
GNRC
-
NYSE
Generac Hldgs Inc
CONSUMER DURABLES - Electronic Equipment
|
$40.26
|
-1.48
-3.55% |
$42.06
|
1,382,394
175.05% of 50 DAV
50 DAV is 789,700
|
$44.30
-9.12%
|
9/12/2013
|
$41.40
|
PP = $43.27
|
|
MB = $45.43
|
Most Recent Note - 10/8/2013 5:04:44 PM
G - Color code is changed to green after a considerable loss today on above average volume violated its 50 DMA line triggering a technical sell signal. Prior lows in $39 area define important near-term support. Disciplined investors limit losses by selling if any stock falls more than -7% from their purchase price.
>>> The latest Featured Stock Update with an annotated graph appeared on 9/23/2013. Click here.
View all notes |
Alert me of new notes |
CANSLIM.net Company Profile |
SEC |
Zacks Reports |
StockTalk |
News |
Chart |
Request a new note
C
A N
S L
I M
|
JAZZ
-
NASDAQ
Jazz Pharmaceuticals Plc
DRUGS - Biotechnology
|
$83.78
|
-5.19
-5.83% |
$88.82
|
2,240,134
332.96% of 50 DAV
50 DAV is 672,800
|
$93.84
-10.72%
|
9/30/2013
|
$93.20
|
PP = $89.10
|
|
MB = $93.56
|
Most Recent Note - 10/8/2013 12:09:58 PM
G- Violated its 50 DMA line with a damaging loss on heavy volume today triggering a technical sell signal. Color code is changed to green. Disciplined investors limit losses if any stock falls more than -7% from their purchase price.
>>> The latest Featured Stock Update with an annotated graph appeared on 9/30/2013. Click here.
View all notes |
Alert me of new notes |
CANSLIM.net Company Profile |
SEC |
Zacks Reports |
StockTalk |
News |
Chart |
Request a new note
C
A N
S L
I M
|
KORS
-
NYSE
Michael Kors Hldgs Ltd
RETAIL - Apparel Stores
|
$70.92
|
-3.41
-4.59% |
$74.86
|
3,598,019
107.36% of 50 DAV
50 DAV is 3,351,400
|
$78.62
-9.80%
|
8/6/2013
|
$69.66
|
PP = $66.28
|
|
MB = $69.59
|
Most Recent Note - 10/8/2013 5:15:40 PM
G - Violated its 50 DMA line with a damaging loss today triggering a technical sell signal. Prior highs in the $66 area define the next chart support area.
>>> The latest Featured Stock Update with an annotated graph appeared on 9/27/2013. Click here.
View all notes |
Alert me of new notes |
CANSLIM.net Company Profile |
SEC |
Zacks Reports |
StockTalk |
News |
Chart |
Request a new note
C
A N
S L
I M
|
LOPE
-
NASDAQ
Grand Canyon Education
DIVERSIFIED SERVICES - Education and; Training Services
|
$39.05
|
-0.39
-0.99% |
$39.74
|
301,264
81.29% of 50 DAV
50 DAV is 370,600
|
$41.33
-5.52%
|
6/19/2013
|
$31.47
|
PP = $34.17
|
|
MB = $35.88
|
Most Recent Note - 10/3/2013 5:53:22 PM
G - Pulling back from new all-time high with small losses on light or average volume. Fundamental concerns remain while technical action has been reassuring.
>>> The latest Featured Stock Update with an annotated graph appeared on 9/12/2013. Click here.
View all notes |
Alert me of new notes |
CANSLIM.net Company Profile |
SEC |
Zacks Reports |
StockTalk |
News |
Chart |
Request a new note
C
A N
S L
I M
|
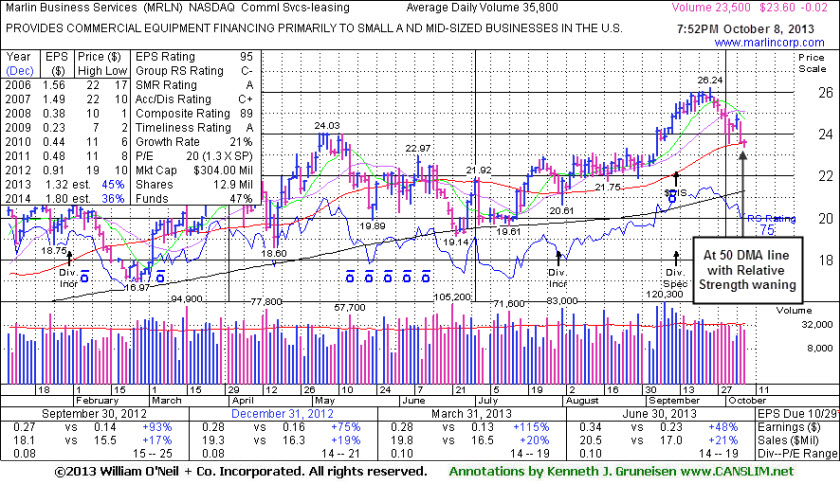
MRLN
-
NASDAQ
Marlin Business Services
DIVERSIFIED SERVICES - Rental and Leasing Services
|
$23.60
|
-0.02
-0.08% |
$23.72
|
24,913
69.59% of 50 DAV
50 DAV is 35,800
|
$26.96
-12.46%
|
9/9/2013
|
$23.75
|
PP = $24.03
|
|
MB = $25.23
|
Most Recent Note - 10/7/2013 6:30:15 PM
G - Finished near its 50 DMA line and near the session low with a big loss on average volume today. Gains lacked great volume conviction since recently paying a $2.00 per share Special Dividend.
>>> The latest Featured Stock Update with an annotated graph appeared on 9/9/2013. Click here.
View all notes |
Alert me of new notes |
CANSLIM.net Company Profile |
SEC |
Zacks Reports |
StockTalk |
News |
Chart |
Request a new note
C
A N
S L
I M
|
Symbol/Exchange
Company Name
Industry Group |
PRICE |
CHANGE
(%Change) |
Day High |
Volume
(% DAV)
(% 50 day avg vol) |
52 Wk Hi
% From Hi |
Featured
Date |
Price
Featured |
Pivot Featured |
|
Max Buy |
PCLN
-
NASDAQ
Priceline.Com Inc
INTERNET - Internet Software and Services
|
$998.13
|
-43.55
-4.18% |
$1,044.63
|
1,369,407
228.12% of 50 DAV
50 DAV is 600,300
|
$1,074.89
-7.14%
|
9/13/2013
|
$966.82
|
PP = $995.08
|
|
MB = $1,044.83
|
Most Recent Note - 10/8/2013 12:16:43 PM
Y - Pulling back toward prior highs near $995 defining initial support to watch. Disciplined investors limit losses by selling if any stock falls more than -7% from their purchase price.
>>> The latest Featured Stock Update with an annotated graph appeared on 9/19/2013. Click here.
View all notes |
Alert me of new notes |
CANSLIM.net Company Profile |
SEC |
Zacks Reports |
StockTalk |
News |
Chart |
Request a new note
C
A N
S L
I M
|
PRAA
-
NASDAQ
Portfolio Recovery Assoc
DIVERSIFIED SERVICES - Business/Management Services
|
$56.73
|
-1.77
-3.03% |
$58.79
|
556,005
108.13% of 50 DAV
50 DAV is 514,200
|
$61.60
-7.91%
|
7/31/2013
|
$51.43
|
PP = $54.72
|
|
MB = $57.46
|
Most Recent Note - 10/7/2013 6:33:42 PM
G - Down today for a 4th consecutive small loss on light volume. Pulling back from its 52-week high after gains on light volume, wedging higher and getting extended from its prior base.
>>> The latest Featured Stock Update with an annotated graph appeared on 9/26/2013. Click here.
View all notes |
Alert me of new notes |
CANSLIM.net Company Profile |
SEC |
Zacks Reports |
StockTalk |
News |
Chart |
Request a new note
C
A N
S L
I M
|
PRLB
-
NYSE
Proto Labs Inc
MANUFACTURING - Small Tools and Accessories
|
$72.98
|
-4.38
-5.66% |
$78.61
|
528,592
127.34% of 50 DAV
50 DAV is 415,100
|
$80.91
-9.80%
|
7/29/2013
|
$64.86
|
PP = $67.50
|
|
MB = $70.88
|
Most Recent Note - 10/8/2013 5:08:31 PM
G - Pulled back considerably on above average volume today testing important support at its 50 DMA line.
>>> The latest Featured Stock Update with an annotated graph appeared on 9/25/2013. Click here.
View all notes |
Alert me of new notes |
CANSLIM.net Company Profile |
SEC |
Zacks Reports |
StockTalk |
News |
Chart |
Request a new note
C
A N
S L
I M
|
SFUN
-
NYSE
Soufun Hldgs Ltd Ads A
INTERNET - Internet Information Providers
|
$44.62
|
-4.36
-8.90% |
$49.96
|
2,389,751
204.39% of 50 DAV
50 DAV is 1,169,200
|
$53.77
-17.02%
|
7/16/2013
|
$29.54
|
PP = $27.90
|
|
MB = $29.30
|
Most Recent Note - 10/8/2013 12:47:12 PM
G - Pulling back near prior lows and its 50 DMA line, important near-term support to watch on pullbacks. Violations may trigger technical sell signals.
>>> The latest Featured Stock Update with an annotated graph appeared on 10/1/2013. Click here.
View all notes |
Alert me of new notes |
CANSLIM.net Company Profile |
SEC |
Zacks Reports |
StockTalk |
News |
Chart |
Request a new note
C
A N
S L
I M
|
SSNC
-
NASDAQ
S S & C Technologies
COMPUTER SOFTWARE and SERVICES - Application Software
|
$34.93
|
-1.96
-5.31% |
$37.11
|
846,230
197.44% of 50 DAV
50 DAV is 428,600
|
$39.94
-12.54%
|
9/5/2013
|
$36.01
|
PP = $38.90
|
|
MB = $40.85
|
Most Recent Note - 10/8/2013 12:48:50 PM
G - Color code is changed to green while deteriorating and violating its 50 DMA line with today's loss on higher volume triggering a technical sell signal. Completed a Secondary Offering on 9/20/13 while perched at all-time highs.
>>> The latest Featured Stock Update with an annotated graph appeared on 10/4/2013. Click here.
View all notes |
Alert me of new notes |
CANSLIM.net Company Profile |
SEC |
Zacks Reports |
StockTalk |
News |
Chart |
Request a new note
C
A N
S L
I M
|
Symbol/Exchange
Company Name
Industry Group |
PRICE |
CHANGE
(%Change) |
Day High |
Volume
(% DAV)
(% 50 day avg vol) |
52 Wk Hi
% From Hi |
Featured
Date |
Price
Featured |
Pivot Featured |
|
Max Buy |
SSYS
-
NASDAQ
Stratasys Ltd
COMPUTER HARDWARE - Computer Peripherals
|
$93.92
|
-3.47
-3.56% |
$98.70
|
1,262,217
111.43% of 50 DAV
50 DAV is 1,132,700
|
$113.49
-17.24%
|
7/8/2013
|
$91.44
|
PP = $95.00
|
|
MB = $99.75
|
Most Recent Note - 10/8/2013 12:50:01 PM
G - Slumping below its 50 DMA line and approaching prior lows defining the next near-term support. Completed a new Public Offering on 9/13/13.
>>> The latest Featured Stock Update with an annotated graph appeared on 9/10/2013. Click here.
View all notes |
Alert me of new notes |
CANSLIM.net Company Profile |
SEC |
Zacks Reports |
StockTalk |
News |
Chart |
Request a new note
C
A N
S L
I M
|
STMP
-
NASDAQ
Stamps.Com Inc
INTERNET - Internet Software and Services
|
$40.29
|
-2.85
-6.61% |
$43.65
|
175,787
147.84% of 50 DAV
50 DAV is 118,900
|
$46.80
-13.90%
|
9/24/2013
|
$45.54
|
PP = $46.57
|
|
MB = $48.90
|
Most Recent Note - 10/8/2013 12:51:19 PM
G - Color code is changed to green while violating its 50 DMA line today triggering a worrisome technical sell signal.
>>> The latest Featured Stock Update with an annotated graph appeared on 9/24/2013. Click here.
View all notes |
Alert me of new notes |
CANSLIM.net Company Profile |
SEC |
Zacks Reports |
StockTalk |
News |
Chart |
Request a new note
C
A N
S L
I M
|
TBBK
-
NASDAQ
Bancorp Inc
BANKING - Regional - Mid-Atlantic Banks
|
$17.44
|
-0.05
-0.29% |
$17.77
|
116,116
65.49% of 50 DAV
50 DAV is 177,300
|
$18.61
-6.29%
|
9/4/2013
|
$16.26
|
PP = $16.79
|
|
MB = $17.63
|
Most Recent Note - 10/8/2013 12:52:00 PM
Y - Consolidating above prior highs and its 50 DMA line defining important support to watch on pullbacks.
>>> The latest Featured Stock Update with an annotated graph appeared on 10/3/2013. Click here.
View all notes |
Alert me of new notes |
CANSLIM.net Company Profile |
SEC |
Zacks Reports |
StockTalk |
News |
Chart |
Request a new note
C
A N
S L
I M
|
TNGO
-
NASDAQ
Tangoe Inc
COMPUTER SOFTWARE and SERVICES - Technical and System Software
|
$23.02
|
-0.64
-2.70% |
$23.99
|
819,210
144.76% of 50 DAV
50 DAV is 565,900
|
$24.60
-6.41%
|
9/12/2013
|
$21.30
|
PP = $23.15
|
|
MB = $24.31
|
Most Recent Note - 10/8/2013 5:19:55 PM
Y - Down again today with above average volume, encountering distributional pressure. Convincing volume-driven gains above its pivot point cited based on its May 2012 high plus 10 cents may signal the beginning of a substantial leg higher.
>>> The latest Featured Stock Update with an annotated graph appeared on 9/17/2013. Click here.
View all notes |
Alert me of new notes |
CANSLIM.net Company Profile |
SEC |
Zacks Reports |
StockTalk |
News |
Chart |
Request a new note
C
A N
S L
I M
|
VRX
-
NYSE
Valeant Pharmaceuticals
DRUGS - Drug Manufacturers - Other
|
$105.92
|
-4.40
-3.99% |
$110.52
|
1,727,748
143.00% of 50 DAV
50 DAV is 1,208,200
|
$113.79
-6.92%
|
9/11/2013
|
$100.26
|
PP = $105.50
|
|
MB = $110.78
|
Most Recent Note - 10/8/2013 5:43:42 PM
Y- Color code is changed to yellow after ending near the session low with a large loss with above average volume, slumping toward prior highs defining important support in the $105 area.
>>> The latest Featured Stock Update with an annotated graph appeared on 9/11/2013. Click here.
View all notes |
Alert me of new notes |
CANSLIM.net Company Profile |
SEC |
Zacks Reports |
StockTalk |
News |
Chart |
Request a new note
C
A N
S L
I M
|
Symbol/Exchange
Company Name
Industry Group |
PRICE |
CHANGE
(%Change) |
Day High |
Volume
(% DAV)
(% 50 day avg vol) |
52 Wk Hi
% From Hi |
Featured
Date |
Price
Featured |
Pivot Featured |
|
Max Buy |
YNDX
-
NASDAQ
Yandex N V Class A
INTERNET - Internet Information Providers
|
$35.54
|
-1.90
-5.07% |
$38.10
|
4,596,058
206.34% of 50 DAV
50 DAV is 2,227,400
|
$39.44
-9.89%
|
9/5/2013
|
$34.24
|
PP = $34.79
|
|
MB = $36.53
|
Most Recent Note - 10/8/2013 5:09:45 PM
G - Down considerably today with above average volume, sinking to prior highs in the $34 area and its 50 DMA line defining important support to watch.
>>> The latest Featured Stock Update with an annotated graph appeared on 9/18/2013. Click here.
View all notes |
Alert me of new notes |
CANSLIM.net Company Profile |
SEC |
Zacks Reports |
StockTalk |
News |
Chart |
Request a new note
C
A N
S L
I M
|