You are not logged in.
This means you
CAN ONLY VIEW reports that were published prior to Wednesday, April 9, 2025.
You
MUST UPGRADE YOUR MEMBERSHIP if you want to see any current reports.
AFTER MARKET UPDATE - MONDAY, OCTOBER 7TH, 2013
Previous After Market Report Next After Market Report >>>
|
|
|
|
DOW |
-136.34 |
14,936.24 |
-0.90% |
|
Volume |
594,542,560 |
-0% |
|
Volume |
1,417,056,810 |
-5% |
|
NASDAQ |
-37.37 |
3,770.38 |
-0.98% |
|
Advancers |
644 |
21% |
|
Advancers |
660 |
25% |
|
S&P 500 |
-14.38 |
1,676.12 |
-0.85% |
|
Decliners |
2,394 |
76% |
|
Decliners |
1,885 |
71% |
|
Russell 2000 |
-12.46 |
1,065.79 |
-1.16% |
|
52 Wk Highs |
51 |
|
|
52 Wk Highs |
82 |
|
|
S&P 600 |
-6.69 |
601.59 |
-1.10% |
|
52 Wk Lows |
41 |
|
|
52 Wk Lows |
22 |
|
|
 |
Major Averages Show Signs of More Worrisome Market Correction
Kenneth J. Gruneisen - Passed the CAN SLIM® Master's Exam
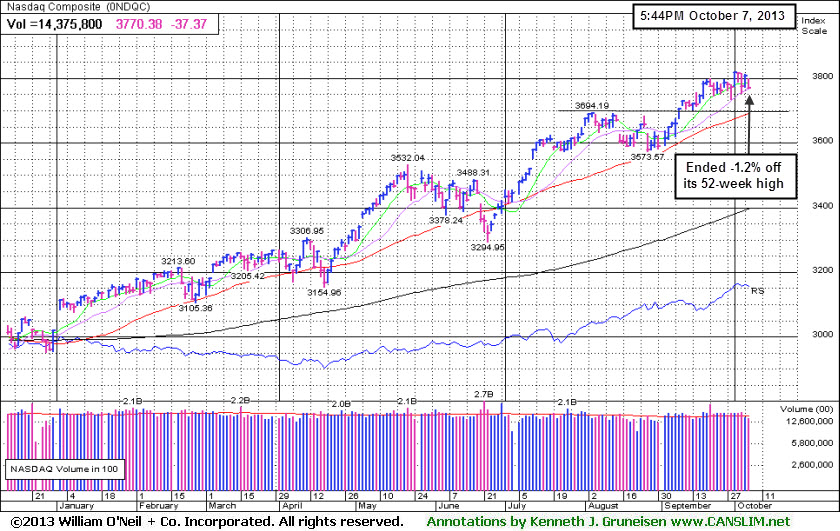
The major averages finished just off of their lows of the session as the Dow Jones Industrial Average, S&P 500 Index, and the Nasdaq Composite Index sank on Monday. The volume totals on were lighter on the NYSE and on the Nasdaq exchange versus the prior session's volume totals, indicating that at least the selling conviction from the institutional crowd was not increasing. Breadth was negative as decliners led advancers by a 4-1 margin on the NYSE and 3-1 on the Nasdaq exchange. Leadership waned as there were 17 high-ranked companies from the CANSLIM.net Leaders List that made new 52-week highs and appeared on the CANSLIM.net BreakOuts Page, down from 54 stocks on the prior session. Healthy leadership is critical to any sustained rally. The list of stocks hitting new 52-week highs still outnumbered new lows on the NYSE and on the Nasdaq exchange. There were losses for 20 of the 21 high-ranked companies currently included on the Featured Stocks Page, a particularly poor showing versus the broader market's clearly negative breadth.
Stocks were under pressure from Monday's opening bell as investors faced a second week of the partial government shutdown. All 10 sectors on the S&P ended lower, led by weakness in consumer stocks. Shares of Amazon.com Inc (AMZN +2.82%) following a cautious article in Barron’s magazine over the weekend. Tech stocks were also active in the session. Apple (AAPL +0.98%) edged higher after the stock received an analyst upgrade. Also in the space, Blackberry (BBRY +3.64%) rose on reports that management was in talks with Google Inc (GOOG -0.76%) and Cisco Systems Inc (CSCO -0.56%) to sell part of the company.
Turning to fixed income markets, Treasuries were higher along the curve. The benchmark 10-year note was up 3/32 to yield 2.64% and the 30-year bond was higher by 1/2 of a point to yield 3.70%.
The S&P 500 Index further slumped below its 50-day moving average (DMA) line on Monday, joining the Dow Jones Industrial Average in deteriorating below their respective short-term averages. Distributional action weighed on the market (M criteria) recently and the rally has been under pressure, threatening to turn into a more serious correction. Investors are prompted to have a cautionary stance and be ready to reduce market exposure until broad-based strength returns. Stay familiar with companies listed on the CANSLIM.net Featured Stocks Page - a page showing the most action-worthy candidates' latest notes and links to additional resources including detailed analysis with data-packed graphs which are annotated by a Certified expert. The Premium Member Homepage - includes "dynamic archives" to all prior pay reports published. Watch for an announcement via email concerning the next WEBCAST.
PICTURED: The Nasdaq Composite Index is still well above its 50-day moving average (DMA) line and only -1.2% off its 52-week high.
|
 Kenneth J. Gruneisen started out as a licensed stockbroker in August 1987, a couple of months prior to the historic stock market crash that took the Dow Jones Industrial Average down -22.6% in a single day. He has published daily fact-based fundamental and technical analysis on high-ranked stocks online for two decades. Through FACTBASEDINVESTING.COM, Kenneth provides educational articles, news, market commentary, and other information regarding proven investment systems that work in good times and bad.
Comments contained in the body of this report are technical opinions only and are not necessarily those of Gruneisen Growth Corp. The material herein has been obtained from sources believed to be reliable and accurate, however, its accuracy and completeness cannot be guaranteed. Our firm, employees, and customers may effect transactions, including transactions contrary to any recommendation herein, or have positions in the securities mentioned herein or options with respect thereto. Any recommendation contained in this report may not be suitable for all investors and it is not to be deemed an offer or solicitation on our part with respect to the purchase or sale of any securities. |
|
 |
Tech, Retail, Healthcare, and Influential Financial Groups Slump
Kenneth J. Gruneisen - Passed the CAN SLIM® Master's Exam
The Biotechnology Index ($BTK -2.47%) led the tech sector lower while the Internet Index ($IIX -1.28%), Networking Index ($NWX -0.80%), and Semiconductor Index ($SOX -0.53%) suffered smaller losses. The Retail Index ($RLX -1.76%) and influential financial groups including the Bank Index ($BKX -1.75%) and Broker/Dealer Index ($XBD -1.55%) traded lower putting a drag on the major averages. Weakness in energy-related shares pushed the Oil Services Index ($OSX -1.01%) and the Integrated Oil Index ($XOI -0.54%) lower. Defensive groups were mixed as the Healthcare Index ($HMO -1.51% ) fell while the Gold & Silver Index ($XAU +1.58%) was a standout gainer.
Charts courtesy www.stockcharts.com
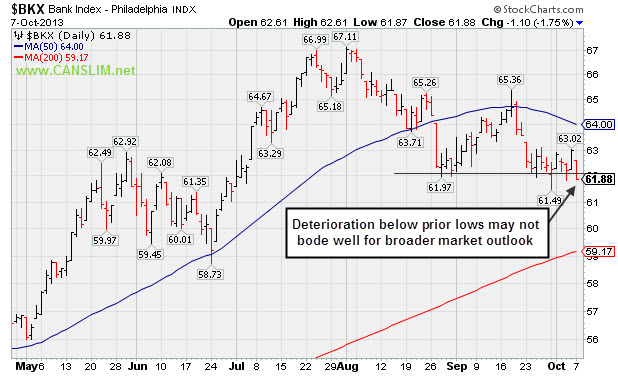
PICTURED: The Bank Index ($BKX -1.75%) is an important "leading indicator" for the market. Deterioration below prior lows could raise more serious concerns and may not bode well for broader market outlook. Not long ago it ran into resistance at its 50-day moving average (DMA) line when attempting to rebound toward prior highs.
| Oil Services |
$OSX |
275.85 |
-2.81 |
-1.01% |
+25.30% |
| Healthcare |
$HMO |
3,519.98 |
-53.96 |
-1.51% |
+40.01% |
| Integrated Oil |
$XOI |
1,401.65 |
-7.55 |
-0.54% |
+12.87% |
| Semiconductor |
$SOX |
495.09 |
-2.63 |
-0.53% |
+28.91% |
| Networking |
$NWX |
305.09 |
-2.47 |
-0.80% |
+34.67% |
| Internet |
$IIX |
418.36 |
-5.44 |
-1.28% |
+27.94% |
| Broker/Dealer |
$XBD |
134.35 |
-2.11 |
-1.55% |
+42.42% |
| Retail |
$RLX |
843.05 |
-15.11 |
-1.76% |
+27.39% |
| Gold & Silver |
$XAU |
91.79 |
+1.43 |
+1.58% |
-44.57% |
| Bank |
$BKX |
61.88 |
-1.10 |
-1.75% |
+20.67% |
| Biotech |
$BTK |
2,152.43 |
-54.49 |
-2.47% |
+39.13% |
|
|
|
 |
Extended After 13 Weekly Gains in Span of 14 Weeks
Kenneth J. Gruneisen - Passed the CAN SLIM® Master's Exam
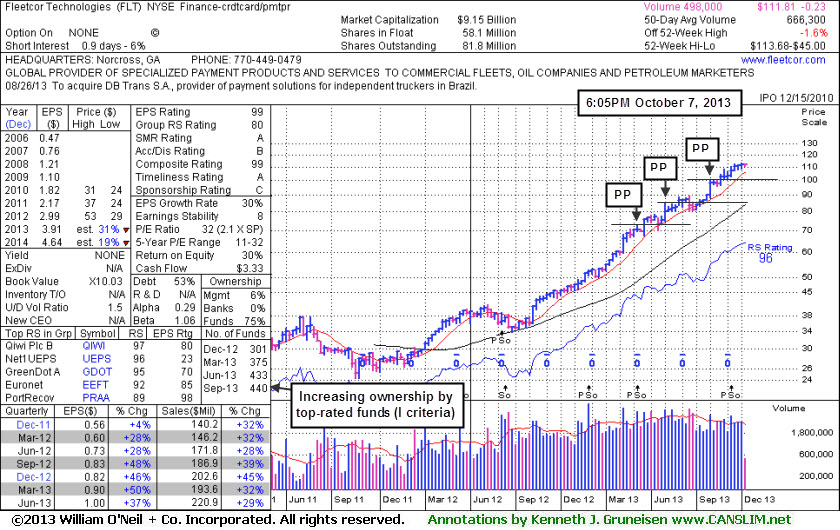
FleetCor Technologies, Inc. (FLT -$0.23 or -0.21% to $111.81) is hovering only -1.6% off its all-time high after wedging higher since completing yet another Secondary Offering on 9/11/13. No resistance remains due to overhead supply. It has tallied 13 weekly gains in the past 14 weeks. Its 50-day moving average (DMA) line (now $103.57) defines important near term support to watch on pullbacks. It was last shown in this FSU section on 9/06/13 with an annotated daily graph under the headline, "Holding Ground Following Latest Volume Driven Gains". Its weekly graph below shows where it recently rose with volume-driven gains from an advanced "3-weeks tight" base noted as a riskier "late stage" base. It had enjoyed a considerable rally even before the three latest Pivot Points (PP) were discussed on the ongoing coverage published while FLT has traded up as much as +59.8% since first featured in yellow in the mid-day report on 3/21/13 (read here). Disciplined investors avoid chasing stocks extended more than +5% above their pivot point or prior highs and always limit losses by selling any stock that falls more than -7% from their purchase price.
It reported earnings +37% on +29% sales for the Jun '13 quarter, marking its 6th consecutive quarterly comparison with earnings above the +25% guideline (C criteria). The company completed a Secondary Offering on 3/08/13 after a streak of volume-driven gains into new high territory. On 3/14/12, 6/11/12, and 11/29/12 it priced Secondary Offerings and it was previously noted, "Such offerings often are a short-term hindrance to upward price progress yet typically result in broader institutional ownership interest."
The number of top-rated funds owning its shares rose from 193 in Mar '12 to 440 in Jun '13, a reassuring sign concerning the I criteria. The company hails from the Finance - Credit Card Payment Processing group which improved to a 80 Group Relative Strength Rating from a 55 rating when shown in the FSU section on 7/18/13. Impressive strength and leadership from a couple of other firms in the same industry group is also considered a reassurance concerning the L criteria.
|
|
|
Color Codes Explained :
Y - Better candidates highlighted by our
staff of experts.
G - Previously featured
in past reports as yellow but may no longer be buyable under the
guidelines.
***Last / Change / Volume data in this table is the closing quote data***
Symbol/Exchange
Company Name
Industry Group |
PRICE |
CHANGE
(%Change) |
Day High |
Volume
(% DAV)
(% 50 day avg vol) |
52 Wk Hi
% From Hi |
Featured
Date |
Price
Featured |
Pivot Featured |
|
Max Buy |
AVG
-
NYSE
A V G Technologies N.V.
INTERNET - Internet Software and Services
|
$23.55
|
-0.86
-3.52% |
$24.35
|
520,898
55.67% of 50 DAV
50 DAV is 935,700
|
$26.56
-11.32%
|
9/13/2013
|
$23.06
|
PP = $23.88
|
|
MB = $25.07
|
 Most Recent Note - 10/7/2013 6:43:28 PM
Y - Down on lighter volume today, sinking toward support at prior highs in the $23 area and its 50 DMA line ($22.91 now). Subsequent damaging violations may trigger technical sell signals.
>>> The latest Featured Stock Update with an annotated graph appeared on 9/13/2013. Click here.
View all notes |
Alert me of new notes |
CANSLIM.net Company Profile |
SEC |
Zacks Reports |
StockTalk |
News |
Chart |
Request a new note
C
A N
S L
I M


|
BITA
-
NYSE
Bitauto Hldgs Ltd Ads
INTERNET - Internet Information Providers
|
$21.73
|
+1.25
6.10% |
$22.37
|
1,142,875
223.96% of 50 DAV
50 DAV is 510,300
|
$21.08
3.08%
|
9/24/2013
|
$16.40
|
PP = $17.31
|
|
MB = $18.18
|
Most Recent Note - 10/7/2013 12:05:17 PM
G - Hitting new 52-week highs while adding to its recent spurt of volume-driven gains. Prior highs in the $18 area define define initial support to watch on pullbacks.
>>> The latest Featured Stock Update with an annotated graph appeared on 10/2/2013. Click here.
View all notes |
Alert me of new notes |
CANSLIM.net Company Profile |
SEC |
Zacks Reports |
StockTalk |
News |
Chart |
Request a new note
C
A N
S L
I M
|
CELG
-
NASDAQ
Celgene Corp
DRUGS - Drug Manufacturers - Major
|
$153.87
|
-3.40
-2.16% |
$157.11
|
2,870,408
114.66% of 50 DAV
50 DAV is 2,503,300
|
$157.95
-2.58%
|
9/12/2013
|
$149.50
|
PP = $150.02
|
|
MB = $157.52
|
Most Recent Note - 10/4/2013 11:32:47 PM
Y - Rallied for a best-ever close and hit another new 52-week high today. It is trading near its "max buy" level. Its 50 DMA line ($144.88 now) defines near-term support to watch.
>>> The latest Featured Stock Update with an annotated graph appeared on 9/20/2013. Click here.
View all notes |
Alert me of new notes |
CANSLIM.net Company Profile |
SEC |
Zacks Reports |
StockTalk |
News |
Chart |
Request a new note
C
A N
S L
I M
|
EGBN
-
NASDAQ
Eagle Bancorp Inc
BANKING - Regional - Mid-Atlantic Banks
|
$27.64
|
-0.54
-1.92% |
$28.78
|
67,146
91.98% of 50 DAV
50 DAV is 73,000
|
$28.59
-3.32%
|
9/16/2013
|
$27.48
|
PP = $27.77
|
|
MB = $29.16
|
Most Recent Note - 10/1/2013 6:04:28 PM
Y - Inched to new high territory with light volume behind today's 4th consecutive gain. Stubbornly held its ground after a recent spurt of volume-driven gains and it remains below its "max buy" level.
>>> The latest Featured Stock Update with an annotated graph appeared on 9/16/2013. Click here.
View all notes |
Alert me of new notes |
CANSLIM.net Company Profile |
SEC |
Zacks Reports |
StockTalk |
News |
Chart |
Request a new note
C
A N
S L
I M
|
FLT
-
NYSE
Fleetcor Technologies
DIVERSIFIED SERVICES - Business/Management Services
|
$111.81
|
-0.23
-0.21% |
$112.15
|
498,629
74.84% of 50 DAV
50 DAV is 666,300
|
$113.68
-1.64%
|
8/19/2013
|
$99.01
|
PP = $100.97
|
|
MB = $106.02
|
Most Recent Note - 10/7/2013 6:46:22 PM
G - Hovering near all-time highs after wedging higher since completing a Secondary Offering on 9/11/13. Its 50 DMA line defines important near term support to watch on pullbacks. See the latest FSU analysis for more details and a new annotated weekly graph. FLT has traded up as much as +59.8% since first featured in yellow in the mid-day report on 3/21/13 (read here).
>>> The latest Featured Stock Update with an annotated graph appeared on 10/7/2013. Click here.
View all notes |
Alert me of new notes |
CANSLIM.net Company Profile |
SEC |
Zacks Reports |
StockTalk |
News |
Chart |
Request a new note
C
A N
S L
I M
|
Symbol/Exchange
Company Name
Industry Group |
PRICE |
CHANGE
(%Change) |
Day High |
Volume
(% DAV)
(% 50 day avg vol) |
52 Wk Hi
% From Hi |
Featured
Date |
Price
Featured |
Pivot Featured |
|
Max Buy |
GNRC
-
NYSE
Generac Hldgs Inc
CONSUMER DURABLES - Electronic Equipment
|
$41.74
|
-0.31
-0.74% |
$42.30
|
445,876
56.16% of 50 DAV
50 DAV is 793,900
|
$44.30
-5.78%
|
9/12/2013
|
$41.40
|
PP = $43.27
|
|
MB = $45.43
|
Most Recent Note - 10/7/2013 6:35:53 PM
Y - Consolidating near its 50 DMA line with volume totals cooling in recent weeks. It stalled after triggering a technical buy signal on 9/20/13. Disciplined investors limit losses by selling if any stock falls more than -7% from their purchase price.
>>> The latest Featured Stock Update with an annotated graph appeared on 9/23/2013. Click here.
View all notes |
Alert me of new notes |
CANSLIM.net Company Profile |
SEC |
Zacks Reports |
StockTalk |
News |
Chart |
Request a new note
C
A N
S L
I M
|
JAZZ
-
NASDAQ
Jazz Pharmaceuticals Plc
DRUGS - Biotechnology
|
$88.97
|
-2.02
-2.22% |
$90.42
|
525,387
77.82% of 50 DAV
50 DAV is 675,100
|
$93.84
-5.19%
|
9/30/2013
|
$93.20
|
PP = $89.10
|
|
MB = $93.56
|
Most Recent Note - 10/7/2013 6:38:26 PM
Y- Holding its ground near its highs. Stalled since last noted on 9/30/13 after a solid gain backed by +160% above average volume while rallying above the pivot point cited. Disciplined investors limit losses if any stock falls more than -7% from their purchase price.
>>> The latest Featured Stock Update with an annotated graph appeared on 9/30/2013. Click here.
View all notes |
Alert me of new notes |
CANSLIM.net Company Profile |
SEC |
Zacks Reports |
StockTalk |
News |
Chart |
Request a new note
C
A N
S L
I M
|
KORS
-
NYSE
Michael Kors Hldgs Ltd
RETAIL - Apparel Stores
|
$74.33
|
-2.02
-2.65% |
$75.59
|
1,757,762
51.52% of 50 DAV
50 DAV is 3,412,000
|
$78.62
-5.46%
|
8/6/2013
|
$69.66
|
PP = $66.28
|
|
MB = $69.59
|
Most Recent Note - 10/7/2013 6:39:23 PM
G - Still extended from its prior base and consolidating near its 52-week high. Its 50 DMA line (now $72.74) defines support above prior highs in the $66 area.
>>> The latest Featured Stock Update with an annotated graph appeared on 9/27/2013. Click here.
View all notes |
Alert me of new notes |
CANSLIM.net Company Profile |
SEC |
Zacks Reports |
StockTalk |
News |
Chart |
Request a new note
C
A N
S L
I M
|
LOPE
-
NASDAQ
Grand Canyon Education
DIVERSIFIED SERVICES - Education and; Training Services
|
$39.44
|
-0.87
-2.16% |
$40.40
|
211,733
56.92% of 50 DAV
50 DAV is 372,000
|
$41.33
-4.57%
|
6/19/2013
|
$31.47
|
PP = $34.17
|
|
MB = $35.88
|
Most Recent Note - 10/3/2013 5:53:22 PM
G - Pulling back from new all-time high with small losses on light or average volume. Fundamental concerns remain while technical action has been reassuring.
>>> The latest Featured Stock Update with an annotated graph appeared on 9/12/2013. Click here.
View all notes |
Alert me of new notes |
CANSLIM.net Company Profile |
SEC |
Zacks Reports |
StockTalk |
News |
Chart |
Request a new note
C
A N
S L
I M
|
MRLN
-
NASDAQ
Marlin Business Services
DIVERSIFIED SERVICES - Rental and Leasing Services
|
$23.62
|
-1.07
-4.33% |
$24.60
|
30,187
83.39% of 50 DAV
50 DAV is 36,200
|
$26.96
-12.39%
|
9/9/2013
|
$23.75
|
PP = $24.03
|
|
MB = $25.23
|
Most Recent Note - 10/7/2013 6:30:15 PM
G - Finished near its 50 DMA line and near the session low with a big loss on average volume today. Gains lacked great volume conviction since recently paying a $2.00 per share Special Dividend.
>>> The latest Featured Stock Update with an annotated graph appeared on 9/9/2013. Click here.
View all notes |
Alert me of new notes |
CANSLIM.net Company Profile |
SEC |
Zacks Reports |
StockTalk |
News |
Chart |
Request a new note
C
A N
S L
I M
|
Symbol/Exchange
Company Name
Industry Group |
PRICE |
CHANGE
(%Change) |
Day High |
Volume
(% DAV)
(% 50 day avg vol) |
52 Wk Hi
% From Hi |
Featured
Date |
Price
Featured |
Pivot Featured |
|
Max Buy |
PCLN
-
NASDAQ
Priceline.Com Inc
INTERNET - Internet Software and Services
|
$1,041.68
|
-20.49
-1.93% |
$1,061.49
|
437,410
71.47% of 50 DAV
50 DAV is 612,000
|
$1,074.89
-3.09%
|
9/13/2013
|
$966.82
|
PP = $995.08
|
|
MB = $1,044.83
|
Most Recent Note - 10/7/2013 6:32:04 PM
Y - Volume was below average when slumping beyond its "max buy" level today and its color code is changed to yellow. Prior highs near $995 define initial support to watch.
>>> The latest Featured Stock Update with an annotated graph appeared on 9/19/2013. Click here.
View all notes |
Alert me of new notes |
CANSLIM.net Company Profile |
SEC |
Zacks Reports |
StockTalk |
News |
Chart |
Request a new note
C
A N
S L
I M
|
PRAA
-
NASDAQ
Portfolio Recovery Assoc
DIVERSIFIED SERVICES - Business/Management Services
|
$58.50
|
-0.27
-0.46% |
$58.73
|
353,944
68.94% of 50 DAV
50 DAV is 513,400
|
$61.60
-5.03%
|
7/31/2013
|
$51.43
|
PP = $54.72
|
|
MB = $57.46
|
Most Recent Note - 10/7/2013 6:33:42 PM
G - Down today for a 4th consecutive small loss on light volume. Pulling back from its 52-week high after gains on light volume, wedging higher and getting extended from its prior base.
>>> The latest Featured Stock Update with an annotated graph appeared on 9/26/2013. Click here.
View all notes |
Alert me of new notes |
CANSLIM.net Company Profile |
SEC |
Zacks Reports |
StockTalk |
News |
Chart |
Request a new note
C
A N
S L
I M
|
PRLB
-
NYSE
Proto Labs Inc
MANUFACTURING - Small Tools and Accessories
|
$77.36
|
-3.11
-3.86% |
$80.38
|
271,529
65.91% of 50 DAV
50 DAV is 412,000
|
$80.91
-4.39%
|
7/29/2013
|
$64.86
|
PP = $67.50
|
|
MB = $70.88
|
Most Recent Note - 10/7/2013 6:34:34 PM
G - Pulling back on light volume from its 52-week high. Extended from any sound base. Support to watch is at its 50 DMA line.
>>> The latest Featured Stock Update with an annotated graph appeared on 9/25/2013. Click here.
View all notes |
Alert me of new notes |
CANSLIM.net Company Profile |
SEC |
Zacks Reports |
StockTalk |
News |
Chart |
Request a new note
C
A N
S L
I M
|
SFUN
-
NYSE
Soufun Hldgs Ltd Ads A
INTERNET - Internet Information Providers
|
$48.98
|
-1.38
-2.74% |
$50.97
|
1,096,823
93.71% of 50 DAV
50 DAV is 1,170,400
|
$53.77
-8.91%
|
7/16/2013
|
$29.54
|
PP = $27.90
|
|
MB = $29.30
|
Most Recent Note - 10/4/2013 11:37:35 PM
G - Posted a solid gain with above average volume today following an abrupt volume-driven retreat from its 52-week high. It has not formed a new base of sufficient length. The 50 DMA line and prior highs coincide in the $42 area defining important near-term support to watch on pullbacks.
>>> The latest Featured Stock Update with an annotated graph appeared on 10/1/2013. Click here.
View all notes |
Alert me of new notes |
CANSLIM.net Company Profile |
SEC |
Zacks Reports |
StockTalk |
News |
Chart |
Request a new note
C
A N
S L
I M
|
SSNC
-
NASDAQ
S S & C Technologies
COMPUTER SOFTWARE and SERVICES - Application Software
|
$36.89
|
-0.66
-1.76% |
$37.52
|
191,089
43.72% of 50 DAV
50 DAV is 437,100
|
$39.94
-7.64%
|
9/5/2013
|
$36.01
|
PP = $38.90
|
|
MB = $40.85
|
Most Recent Note - 10/7/2013 6:45:08 PM
Y - Consolidating just above important support at its 50 DMA line. Volume totals have been cooling since it Completed a Secondary Offering on 9/20/13 while perched at all-time highs.
>>> The latest Featured Stock Update with an annotated graph appeared on 10/4/2013. Click here.
View all notes |
Alert me of new notes |
CANSLIM.net Company Profile |
SEC |
Zacks Reports |
StockTalk |
News |
Chart |
Request a new note
C
A N
S L
I M
|
Symbol/Exchange
Company Name
Industry Group |
PRICE |
CHANGE
(%Change) |
Day High |
Volume
(% DAV)
(% 50 day avg vol) |
52 Wk Hi
% From Hi |
Featured
Date |
Price
Featured |
Pivot Featured |
|
Max Buy |
SSYS
-
NASDAQ
Stratasys Ltd
COMPUTER HARDWARE - Computer Peripherals
|
$97.39
|
-2.22
-2.23% |
$99.41
|
1,109,313
99.22% of 50 DAV
50 DAV is 1,118,000
|
$113.49
-14.19%
|
7/8/2013
|
$91.44
|
PP = $95.00
|
|
MB = $99.75
|
Most Recent Note - 10/3/2013 5:59:50 PM
G - Pulled back today on average but higher volume while testing its 50 DMA line again. Completed a new Public Offering on 9/13/13. It has not formed a sound base.
>>> The latest Featured Stock Update with an annotated graph appeared on 9/10/2013. Click here.
View all notes |
Alert me of new notes |
CANSLIM.net Company Profile |
SEC |
Zacks Reports |
StockTalk |
News |
Chart |
Request a new note
C
A N
S L
I M
|
STMP
-
NASDAQ
Stamps.Com Inc
INTERNET - Internet Software and Services
|
$43.14
|
-1.79
-3.98% |
$44.77
|
96,786
80.86% of 50 DAV
50 DAV is 119,700
|
$46.80
-7.81%
|
9/24/2013
|
$45.54
|
PP = $46.57
|
|
MB = $48.90
|
Most Recent Note - 10/7/2013 6:42:19 PM
Y - Encountering distributional pressure recently and it has slumped below its pivot point raising concerns while retreating toward support at its 50 DMA line. A violation of that important short-term average may trigger a more worrisome technical sell signal.
>>> The latest Featured Stock Update with an annotated graph appeared on 9/24/2013. Click here.
View all notes |
Alert me of new notes |
CANSLIM.net Company Profile |
SEC |
Zacks Reports |
StockTalk |
News |
Chart |
Request a new note
C
A N
S L
I M
|
TBBK
-
NASDAQ
Bancorp Inc
BANKING - Regional - Mid-Atlantic Banks
|
$17.49
|
-0.01
-0.06% |
$17.66
|
138,313
78.32% of 50 DAV
50 DAV is 176,600
|
$18.61
-6.02%
|
9/4/2013
|
$16.26
|
PP = $16.79
|
|
MB = $17.63
|
Most Recent Note - 10/3/2013 5:54:51 PM
Y - Color code is changed to yellow while consolidating just below its "max buy" level. Prior highs and its 50 DMA line define important support to watch on pullbacks. See the latest FSU analysis for more details and a new annotated graph.
>>> The latest Featured Stock Update with an annotated graph appeared on 10/3/2013. Click here.
View all notes |
Alert me of new notes |
CANSLIM.net Company Profile |
SEC |
Zacks Reports |
StockTalk |
News |
Chart |
Request a new note
C
A N
S L
I M
|
TNGO
-
NASDAQ
Tangoe Inc
COMPUTER SOFTWARE and SERVICES - Technical and System Software
|
$23.66
|
-0.41
-1.70% |
$24.00
|
355,044
63.02% of 50 DAV
50 DAV is 563,400
|
$24.60
-3.81%
|
9/12/2013
|
$21.30
|
PP = $23.15
|
|
MB = $24.31
|
Most Recent Note - 10/3/2013 5:56:06 PM
Y - Pulled back today with above average volume, encountering distributional pressure. Convincing volume-driven gains above its pivot point cited based on its May 2012 high plus 10 cents may signal the beginning of a substantial leg higher.
>>> The latest Featured Stock Update with an annotated graph appeared on 9/17/2013. Click here.
View all notes |
Alert me of new notes |
CANSLIM.net Company Profile |
SEC |
Zacks Reports |
StockTalk |
News |
Chart |
Request a new note
C
A N
S L
I M
|
VRX
-
NYSE
Valeant Pharmaceuticals
DRUGS - Drug Manufacturers - Other
|
$110.32
|
-0.69
-0.62% |
$112.21
|
1,248,309
104.69% of 50 DAV
50 DAV is 1,192,400
|
$113.79
-3.05%
|
9/11/2013
|
$100.26
|
PP = $105.50
|
|
MB = $110.78
|
Most Recent Note - 10/4/2013 12:41:06 PM
G- Color code is changed to green after rallying above its "max buy" level. Gains above the pivot point with volume helped clinch a technical buy signal. Recent insider buying while trading near its highs has been noted as an encouraging sign.
>>> The latest Featured Stock Update with an annotated graph appeared on 9/11/2013. Click here.
View all notes |
Alert me of new notes |
CANSLIM.net Company Profile |
SEC |
Zacks Reports |
StockTalk |
News |
Chart |
Request a new note
C
A N
S L
I M
|
Symbol/Exchange
Company Name
Industry Group |
PRICE |
CHANGE
(%Change) |
Day High |
Volume
(% DAV)
(% 50 day avg vol) |
52 Wk Hi
% From Hi |
Featured
Date |
Price
Featured |
Pivot Featured |
|
Max Buy |
YNDX
-
NASDAQ
Yandex N V Class A
INTERNET - Internet Information Providers
|
$37.44
|
-0.91
-2.37% |
$38.14
|
1,702,148
74.97% of 50 DAV
50 DAV is 2,270,500
|
$39.44
-5.07%
|
9/5/2013
|
$34.24
|
PP = $34.79
|
|
MB = $36.53
|
Most Recent Note - 10/3/2013 1:06:46 PM
G - Hit another new all-time high with today's volume-driven gain, getting more extended from its prior base. Prior highs in the $34 area and its 50 DMA line define support to watch on pullbacks.
>>> The latest Featured Stock Update with an annotated graph appeared on 9/18/2013. Click here.
View all notes |
Alert me of new notes |
CANSLIM.net Company Profile |
SEC |
Zacks Reports |
StockTalk |
News |
Chart |
Request a new note
C
A N
S L
I M
|
|
 |
| Subscriber Question: |
October 7, 2013 |
Dear Ken,
Is it possible to add weekly charts? I was reading O'neil's book again and I've noticed weekly charts are extremely important for reviewing signs of accumulation prior to the breakout. Maybe you could also annotate the chart to show those weeks. Also, can you add another field in your tables to show the quality of the base? For example 1 for high quality, 2 for good, 3 for faulty. I know you include something in your narratives but its hard to understand your descriptions.
Thank you,
Andy |
| Ken's Response: |
October 7, 2013 |
Dear Andy:
Your suggestion was forwarded to me. Thanks for writing in with your input!
Let me know if there are any specific stocks on the Featured Stocks list you'd like to see come up again sooner rather than later with annotated weekly graphs - especially if there are questions concerning the prior analysis we have published which may need further clarification. Most often, we have included annotated daily graphs, yet for stocks remaining on the Featured Stocks list for extended periods we have occasionally included annotated weekly graphs in the "Featured Stock Update" section of the After Market Update.
In the near term we will make a concerted effort to more frequently include annotated weekly graphs in the reports. To highlight certain technical characteristics weekly graphs can indeed be very helpful. We usually include one or the other, but sometimes we have included both daily graphs and weekly graphs in one article. If time allows, and if it can be especially constructive in discussing any stock's technical stance each day, we will gladly try to include both graphs. There is also a lot of additional data on the weekly graphs we are typically viewing (behind the scenes) not included on the daily graphs, so please let me know if there is specific data you are looking for in those weekly views which we might include in the wording of our notes.
Concerning base "quality" it may be not as realistic for us to follow-through on your idea to add a new field in the tables. Please note that the bases we typically identify in our ongoing reports are "basic" base patterns one might learn about via the book you are reading. We also occasionally identify "advanced" bases such as a "3-weeks tight" and an "ascending base" pattern. We also occasionally identify secondary buy points which are probably a better idea for experienced investors who have gained some skill and who have first built up a cushion of profits after achieving some success by taking action on fresh breakouts emerging from basic base patterns. We also add notes concerning any stocks which have enjoyed ongoing rallies but might be riskier "late-stage" bases.
Don't forget, the M criteria can trump all others, since 3 out of 4 stocks tend to move in the direction of the major averages. If we are not spotting lots of sound looking bases and stocks breaking out, that is telling us a lot about the current market environment.
We appreciate any suggestions you may have on how we can improve our services. Please use the inquiry form if you have any other questions about the upgraded services we provide. We always say around here that if one person asks a question there were probably 20 other members who had the same question, but they were too busy and didn't take time to ask!
We wish you the utmost success with the fact-based investment system we support.
Best regards,

Kenneth J. Gruneisen
Founder & Contributing Writer for CANSLIM.net
www.canslim.net |
|
|
|
THESE ARE NOT BUY RECOMMENDATIONS!
Comments contained in the body of this report are technical
opinions only. The material herein has been obtained
from sources believed to be reliable and accurate, however,
its accuracy and completeness cannot be guaranteed.
This site is not an investment advisor, hence it does
not endorse or recommend any securities or other investments.
Any recommendation contained in this report may not
be suitable for all investors and it is not to be deemed
an offer or solicitation on our part with respect to
the purchase or sale of any securities. All trademarks,
service marks and trade names appearing in this report
are the property of their respective owners, and are
likewise used for identification purposes only.
This report is a service available
only to active Paid Premium Members.
You may opt-out of receiving report notifications
at any time. Questions or comments may be submitted
by writing to Premium Membership Services 665 S.E. 10 Street, Suite 201 Deerfield Beach, FL 33441-5634 or by calling 1-800-965-8307
or 954-785-1121.
|
|
|

