You are not logged in.
This means you
CAN ONLY VIEW reports that were published prior to Monday, April 14, 2025.
You
MUST UPGRADE YOUR MEMBERSHIP if you want to see any current reports.
AFTER MARKET UPDATE - WEDNESDAY, OCTOBER 7TH, 2009
Previous After Market Report Next After Market Report >>>
|
|
|
|
DOW |
-5.67 |
9,725.58 |
-0.06% |
|
Volume |
1,090,836,350 |
-11% |
|
Volume |
2,250,621,870 |
-9% |
|
NASDAQ |
+6.76 |
2,110.33 |
+0.32% |
|
Advancers |
1,566 |
50% |
|
Advancers |
1,321 |
47% |
|
S&P 500 |
+2.86 |
1,057.58 |
+0.27% |
|
Decliners |
1,387 |
45% |
|
Decliners |
1,337 |
48% |
|
Russell 2000 |
+0.10 |
602.08 |
+0.02% |
|
52 Wk Highs |
225 |
|
|
52 Wk Highs |
94 |
|
|
S&P 600 |
-0.05 |
316.07 |
-0.02% |
|
52 Wk Lows |
3 |
|
|
52 Wk Lows |
7 |
|
|
 |
Mixed Action And Little Change For Indices As Earnings Season Kicks Off
Adam Sarhan, Contributing Writer,
The major averages closed mixed and little changed while the volume totals were lighter than Tuesday's levels. Advancers and decliners were evenly mixed on both exchanges. There were 36 high-ranked companies from the CANSLIM.net Leaders List that made a new 52-week high and appeared on the CANSLIM.net BreakOuts Page, lower than the 48 issues that appeared on the prior session. New 52-week highs still outnumbered new 52-week lows on both exchanges.
Overnight the US dollar advanced, which put pressure on a slew of stocks and commodities. Gold remained strong as it hit another fresh all-time high overnight at $1,049.70 per ounce. The direction of the US dollar continues to play a pivotal role in global capital markets. Stocks and commodities, which are priced in dollars, continue to rally when dollar denominated assets become more attractive to foreign investors. In our new age of financial and economic interdependence it is very important to pay attention to other markets to fully understand what happens at home.
A flurry of homebuilders and other real-estate firms slid as speculation spread that Congress will not extend a tax credit for first-time home buyers. Deutsche Bank AG (DB +0.67%) released a report which said housing stocks will likely drop if Congress does not extend the $8,000 tax credit employed after the housing meltdown in recent years. Alcoa (AA +2.23%) officially kicked off the third quarter earnings season when they reported a Q3 profit of $77 million. Analysts believe that this earnings season will mark the ninth consecutive quarterly decline in corporate profits as the economy begins showing signs of a recovery. Now that earnings season has officially begun, it is imperative to watch how your stocks react to their Q3 results. Remember, if a stock ever drops more than -8% below your purchase price the investment system's rules say to quickly sell it before the loss gets out of control.
PICTURED: The Nasdaq Composite Index's near-term trading range is narrowing. It recently found support near its 50-day moving average (DMA) line. An upward trendline now connects three prior chart lows, making it a meaningful uptrend worth watching.
Does Your "Expert" Portfolio Manager Have You Over-Diversified And Under-Performing?
In recent weeks we have heard from a number of investors who were frustrated to see their accounts over diversified and under performing at the hands of investment managers claiming to make their moves based on this fact-based system. To find out more about working directly with full service professionals doing it the right way, simply fill out this form and we will contact you to discuss a specific course of action that suits you best (CLICK HERE) *Accounts over $250,000 please, and serious inquiries only.
|
|
|
 |
Defensive Areas Among Session's Better Gainers
Kenneth J. Gruneisen - Passed the CAN SLIM® Master's Exam
The Bank Index ($BKX +1.16%) posted a small gain and was a positive influence while the Broker/Dealer Index ($XBD +0.15%), Retail Index ($RLX +0.06%), and Integrated Oil Index ($XOI +0.13%) made very little headway. Defensive areas had a good day as the Healthcare Index ($HMO +1.95%), Gold & Silver Index ($XAU +1.47%), and Oil Services Index ($OSX +1.54%) posted solid gains. The Networking Index ($NWX +0.76%) and Internet Index ($IIX +0.79%) made modest gains while the Biotechnology Index ($BTK -1.09%) and Semiconductor Index ($SOX -0.61%) were laggards in the tech sector.
Charts courtesy www.stockcharts.com
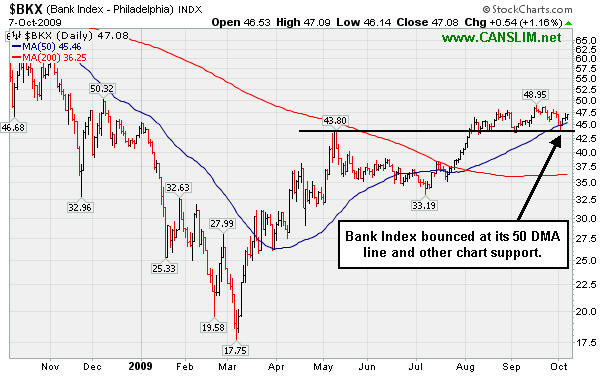
PICTURED: The Bank Index ($BKX +1.16%) recently bounced at its 50-day moving average line and other chart support at recent lows coinciding with an earlier resistance level.
| Oil Services |
$OSX |
194.93 |
+2.95 |
+1.54% |
+60.58% |
| Healthcare |
$HMO |
1,163.49 |
+22.23 |
+1.95% |
+21.17% |
| Integrated Oil |
$XOI |
1,033.67 |
+1.35 |
+0.13% |
+5.51% |
| Semiconductor |
$SOX |
317.64 |
-1.94 |
-0.61% |
+49.71% |
| Networking |
$NWX |
233.33 |
+1.76 |
+0.76% |
+62.16% |
| Internet |
$IIX |
219.34 |
+1.72 |
+0.79% |
+63.97% |
| Broker/Dealer |
$XBD |
121.56 |
+0.18 |
+0.15% |
+56.91% |
| Retail |
$RLX |
379.88 |
+0.24 |
+0.06% |
+36.03% |
| Gold & Silver |
$XAU |
174.80 |
+2.54 |
+1.47% |
+41.14% |
| Bank |
$BKX |
47.08 |
+0.54 |
+1.16% |
+6.23% |
| Biotech |
$BTK |
907.32 |
-10.02 |
-1.09% |
+40.20% |
|
|
|
 |
Institutions Bidding Up BIDU
Kenneth J. Gruneisen - Passed the CAN SLIM® Master's Exam
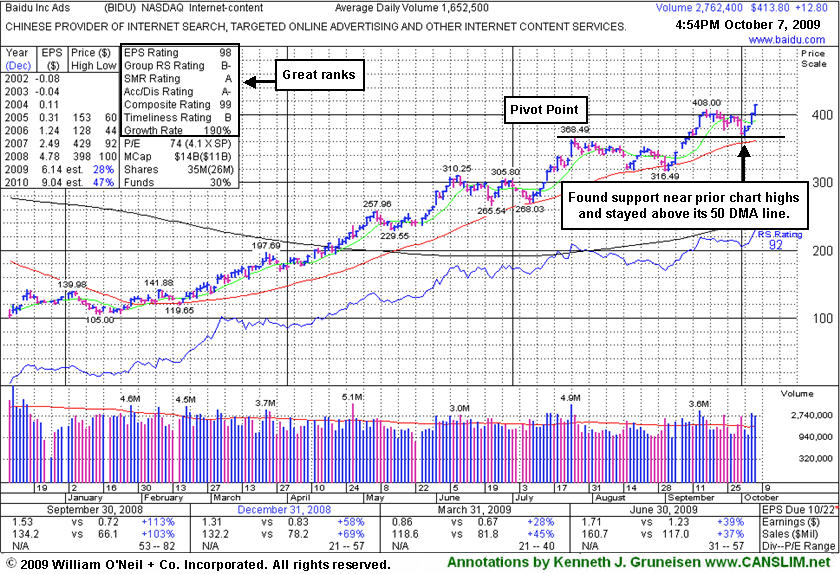
Baidu.com, Inc. (BIDU +$12.80 or +3.09% to $413.80) blasted to a new 2009 today with a second consecutive gain on above average volume, action indicative of more institutional buying demand (the I criteria). Its latest consolidation was too short to be considered a new sound base pattern, however. The number of top-rated funds owning its shares rose from 112 in Sept '08 to 156 in Jun '09, clear evidence its shares were being accumulated. When last reviewed in this FSU section on 9/21/09 under the headline "Baidu's Bullish Gains Viewed On Weekly Graph" it was noted for having gotten too extended from its latest sound base, and for being, "difficult to impossible for disciplined investors to buy properly within the investment system's guidelines." General market weakness and some moderate distributional pressure afterward led to a pullback that tested support at prior chart highs, however, offering investors a more ideal opportunity to accumulate shares in the high-ranked Internet - Content firm without chasing it more than +5% above its pivot point.
Its pullback raised some concerns which were noted, while its color code was changed to yellow on 10/01/09 and remained so in its 10/02/09 and 10/05/09 report appearances. The color code is not a recommendation, and it does not work like a traffic light! It is an indication that a Featured Stock is considered by CANSLIM.net's investment system experts to be among the "better buy candidates" if yellow, or "no longer buyable under the guidelines" if green. When you use the "view all notes" links to review prior analysis on any given stock, the Y or G designations at the front of the notes allow members to quickly determine what shape that Featured Stock was in at the time the note was entered. Once a stock is noted and dropped from the Featured Stocks list it is no longer color coded, unless it meets the criteria and is featured again later. In its previous FSU appearance we described extensive prior coverage BIDU has received (read here).
|
|
|
Color Codes Explained :
Y - Better candidates highlighted by our
staff of experts.
G - Previously featured
in past reports as yellow but may no longer be buyable under the
guidelines.
***Last / Change / Volume quote data in this table corresponds with the timestamp on the note***
Symbol/Exchange
Company Name
Industry Group |
Last |
Chg. |
Vol
% DAV |
Date Featured |
Price Featured |
Latest Pivot Point
Featured |
Status |
| Latest Max Buy Price |
ARO
- NYSE
Aeropostale Inc
RETAIL - Apparel Stores
|
$42.97
|
-1.08
|
2,609,686
99% DAV
2,643,900
|
8/21/2009
(Date
Featured) |
$39.21
(Price
Featured) |
PP = $38.84 |
G |
| MB = $40.78 |
Most Recent Note - 10/7/2009 5:38:12 PM
G - Small gap down today for a loss on average volume. Perched near all-time highs, this high-ranked leader in the Retail - Clothing/shoe group is consolidating above support at its 50 DMA line, with additional support at prior highs in the $38 area. It was featured in yellow in the 8/21/09 Mid-Day BreakOuts Report (read here).
>>> The latest Featured Stock Update with an annotated graph appeared on 10/6/2009. click here.
|
|
C
A
S
I |
News |
Chart |
SEC
View all notes Alert
me of new notes
Company
Profile
|
ARST
-
|
$22.98
|
-0.32
|
465,300
71% DAV
658,100
|
9/1/2009
(Date
Featured) |
$19.91
(Price
Featured) |
PP = $20.90 |
G |
| MB = $21.95 |
Most Recent Note - 10/7/2009 5:51:55 PM
G - Quietly consolidating. On 10/02/09 it traded down near 4-week lows and then positively reversed and closed near the session high amid widespread market weakness. As previously noted, "Recent lows may be considered an initial support level. Prior chart highs and its 50 DMA line, coinciding in the $20 area, define an important technical support level to watch on pullbacks."
>>> The latest Featured Stock Update with an annotated graph appeared on 10/2/2009. click here.
|
|
C
A
S
I |
News |
Chart |
SEC
View all notes Alert
me of new notes
Company
Profile
|
BIDU
- NASDAQ
Baidu Inc Ads
INTERNET - Internet Information Providers
|
$413.80
|
+12.80
|
2,763,806
167% DAV
1,652,500
|
9/8/2009
(Date
Featured) |
$351.80
(Price
Featured) |
PP = $368.59 |
G |
| MB = $387.02 |
Most Recent Note - 10/7/2009 5:54:47 PM
G - Hit a new 2009 high today with a second consecutive considerable gain on above average volume. Recently found support after consolidating near its prior chart highs and pivot point, meanwhile staying well above its 50 DMA line. BIDU was featured in yellow in the 9/08/09 Mid-Day BreakOuts Report (read here).
>>> The latest Featured Stock Update with an annotated graph appeared on 10/7/2009. click here.
|
|
C
A
S
I |
News |
Chart |
SEC
View all notes Alert
me of new notes
Company
Profile
|
CACC
- NASDAQ
Credit Acceptance Corp
FINANCIAL SERVICES - Credit Services
|
$35.09
|
+0.84
|
29,449
67% DAV
44,100
|
9/29/2009
(Date
Featured) |
$33.48
(Price
Featured) |
PP = $32.60 |
G |
| MB = $34.23 |
Most Recent Note - 10/7/2009 5:57:31 PM
G - Gain today on light volume for another new all-time high, closing well above its max buy level. Color code is changed to green as it gets extended from its prior base. The Finance - Consumer/Commercial Loans firm has maintained a great track record of annual and quarterly sales revenues and earnings increases. It was featured on 9/29/09 in yellow in the mid-day report (read here).
>>> The latest Featured Stock Update with an annotated graph appeared on 9/29/2009. click here.
|
|
C
A
S
I |
News |
Chart |
SEC
View all notes Alert
me of new notes
Company
Profile
|
CRM
- NYSE
Salesforce.com Inc
INTERNET - Internet Software & Services
|
$58.44
|
-0.13
|
1,221,977
58% DAV
2,099,700
|
8/16/2009
(Date
Featured) |
$47.12
(Price
Featured) |
PP = $45.59 |
G |
| MB = $47.87 |
Most Recent Note - 10/7/2009 5:58:32 PM
G - Quietly held its ground today after a considerable gain on 10/06/09 with above average volume for a new 2009 high close. Prior highs in the $55 area acted as an initial support level. More substantial technical support to watch is at its upward trendline and 50 DMA line now coinciding in the $51 area.
>>> The latest Featured Stock Update with an annotated graph appeared on 10/5/2009. click here.
|
|
C
A
S
I |
News |
Chart |
SEC
View all notes Alert
me of new notes
Company
Profile
|
EBIX
- NASDAQ
Ebix Inc
COMPUTER SOFTWARE & SERVICES - Business Software & Services
|
$55.15
|
+0.55
|
156,087
89% DAV
176,100
|
8/28/2009
(Date
Featured) |
$45.86
(Price
Featured) |
PP = $45.35 |
G |
| MB = $47.62 |
Most Recent Note - 10/7/2009 5:59:57 PM
G - Perched at all-time highs after today's 7th gain in 8 sessions. It has not formed a new sound base since heavy distributional pressure led to a pullback near support at early-August chart highs and its 50 DMA line in the $45 area.
>>> The latest Featured Stock Update with an annotated graph appeared on 9/24/2009. click here.
|
|
C
A
S
I |
News |
Chart |
SEC
View all notes Alert
me of new notes
Company
Profile
|
GMCR
- NASDAQ
Green Mtn Coffee Roastrs
FOOD & BEVERAGE - Processed & Packaged Goods
|
$71.88
|
+0.61
|
923,284
61% DAV
1,502,200
|
10/5/2009
(Date
Featured) |
$71.11
(Price
Featured) |
PP = $75.89 |
Y |
| MB = $79.68 |
Most Recent Note - 10/7/2009 6:00:57 PM
Y - Quietly hovering near all-time highs after gains this week with light volume helped it bounce back above its July-September high closes in the $70 area. It has formed a cup-with-high-handle pattern, and its color code was changed to yellow with new pivot point and max buy levels noted. Disciplined investors will watch for volume-driven gains to trigger a new technical buy signal before making any initial buys or add-on purchases.
>>> The latest Featured Stock Update with an annotated graph appeared on 9/23/2009. click here.
|
|
C
A
S
I |
News |
Chart |
SEC
View all notes Alert
me of new notes
Company
Profile
|
NTES
- NASDAQ
Netease Inc Adr
INTERNET - Internet Information Providers
|
$44.43
|
-0.05
|
969,684
50% DAV
1,932,600
|
9/23/2009
(Date
Featured) |
$47.11
(Price
Featured) |
PP = $47.04 |
G |
| MB = $49.39 |
Most Recent Note - 10/7/2009 6:02:19 PM
G- Quietly consolidating just above its 50 DMA line. A loss 10/05/09 with above average volume indicated distributional pressure as it closed just under its 50 DMA line and violated an upward trendline. As previously noted, "Deterioration below those levels would raise more serious concerns and trigger technical sell signals." Color code was changed to green based on promptly negating its latest breakout and then trading more than -7% below its pivot point. This may also be considered a riskier late-stage base.
>>> The latest Featured Stock Update with an annotated graph appeared on 9/25/2009. click here.
|
|
C
A
S
I |
News |
Chart |
SEC
View all notes Alert
me of new notes
Company
Profile
|
NVEC
- NASDAQ
N V E Corp
ELECTRONICS - Semiconductor - Specialized
|
$50.71
|
-0.37
|
35,847
42% DAV
84,400
|
8/26/2009
(Date
Featured) |
$55.32
(Price
Featured) |
PP = $57.60 |
G |
| MB = $60.48 |
Most Recent Note - 10/7/2009 6:03:16 PM
G - Still hovering near prior chart lows in the $49 area, where any further deterioration (especially if on heavy volume) may negate its 7/23/09 breakaway gap and raise serious concerns, triggering a more worrisome technical sell signal. Concerns increase the longer it struggles below its 50 DMA line.
>>> The latest Featured Stock Update with an annotated graph appeared on 9/30/2009. click here.
|
|
C
A
S
I |
News |
Chart |
SEC
View all notes Alert
me of new notes
Company
Profile
|
PEGA
- NASDAQ
Pegasystems Inc
COMPUTER SOFTWARE & SERVICES - Business Software & Services
|
$34.06
|
+0.18
|
97,764
24% DAV
399,300
|
9/9/2009
(Date
Featured) |
$31.14
(Price
Featured) |
PP = $33.35 |
Y |
| MB = $35.02 |
Most Recent Note - 10/7/2009 6:04:03 PM
Y - Today was its third consecutive gain on very light volume since this high-ranked Computer Software - Financial firm gapped down on 10/02/09 and traded under its 50 DMA line, then found prompt support. The pullback raised some concerns as it violated an upward trendline connecting its July-September chart lows, an initial support level.
>>> The latest Featured Stock Update with an annotated graph appeared on 9/22/2009. click here.
|
|
C
A
S
I |
News |
Chart |
SEC
View all notes Alert
me of new notes
Company
Profile
|
SWI
- NYSE
Solarwinds Inc
COMPUTER SOFTWARE & SERVICES - Application Software
|
$21.83
|
+0.11
|
205,865
42% DAV
486,100
|
9/30/2029
(Date
Featured) |
$22.03
(Price
Featured) |
PP = $21.72 |
Y |
| MB = $22.81 |
Most Recent Note - 10/7/2009 6:04:41 PM
Y - Gains this week on light volume have it bouncing from support at its 50 DMA line and rallying back above its 8/04/09 high. It was featured in the October 2009 issue of CANSLIM.net News (read here).
>>> The latest Featured Stock Update with an annotated graph appeared on 9/30/2009. click here.
|
|
C
A
S
I |
News |
Chart |
SEC
View all notes Alert
me of new notes
Company
Profile
|
WNS
- NYSE
W N S Holdings Ltd Ads
DIVERSIFIED SERVICES - Business/Management Services
|
$15.56
|
+0.18
|
25,787
48% DAV
53,200
|
9/28/2009
(Date
Featured) |
$15.28
(Price
Featured) |
PP = $16.10 |
Y |
| MB = $16.91 |
Most Recent Note - 10/7/2009 6:08:04 PM
Y - Today's gain on half its average volume total followed 5 consecutive losses on higher volume that were recently noted as "churning" action and "distributional pressure". However, it is still perched above its 50 DMA line and stubbornly holding its ground. Rallied as high as $16.50 on two sessions last week but encountered stubborn resistance after a considerable 9/29/09 gain for a new 52-week high and new high close with volume 11 times its daily average volume. It formed an orderly flat base for at least 5-weeks, and it was featured in yellow in the 9/28/09 mid-day report (read here). Quarterly earnings have been above the +25% guideline and its annual earnings history has been great, satisfying the C & A criteria. However, sales revenues growth has decelerated.
>>> The latest Featured Stock Update with an annotated graph appeared on 9/28/2009. click here.
|
|
C
A
S
I |
News |
Chart |
SEC
View all notes Alert
me of new notes
Company
Profile
|
|
|
|
THESE ARE NOT BUY RECOMMENDATIONS!
Comments contained in the body of this report are technical
opinions only. The material herein has been obtained
from sources believed to be reliable and accurate, however,
its accuracy and completeness cannot be guaranteed.
This site is not an investment advisor, hence it does
not endorse or recommend any securities or other investments.
Any recommendation contained in this report may not
be suitable for all investors and it is not to be deemed
an offer or solicitation on our part with respect to
the purchase or sale of any securities. All trademarks,
service marks and trade names appearing in this report
are the property of their respective owners, and are
likewise used for identification purposes only.
This report is a service available
only to active Paid Premium Members.
You may opt-out of receiving report notifications
at any time. Questions or comments may be submitted
by writing to Premium Membership Services 665 S.E. 10 Street, Suite 201 Deerfield Beach, FL 33441-5634 or by calling 1-800-965-8307
or 954-785-1121.
|
|
|


