You are not logged in.
This means you
CAN ONLY VIEW reports that were published prior to Monday, April 14, 2025.
You
MUST UPGRADE YOUR MEMBERSHIP if you want to see any current reports.
AFTER MARKET UPDATE - MONDAY, OCTOBER 6TH, 2014
Previous After Market Report Next After Market Report >>>
|
|
|
|
DOW |
-17.78 |
16,991.91 |
-0.10% |
|
Volume |
680,961,310 |
-15% |
|
Volume |
1,707,270,980 |
+5% |
|
NASDAQ |
-20.82 |
4,454.80 |
-0.47% |
|
Advancers |
1,542 |
48% |
|
Advancers |
902 |
31% |
|
S&P 500 |
-3.08 |
1,964.82 |
-0.16% |
|
Decliners |
1,553 |
49% |
|
Decliners |
1,909 |
66% |
|
Russell 2000 |
-10.10 |
1,094.65 |
-0.91% |
|
52 Wk Highs |
41 |
|
|
52 Wk Highs |
31 |
|
|
S&P 600 |
-5.54 |
630.77 |
-0.87% |
|
52 Wk Lows |
69 |
|
|
52 Wk Lows |
116 |
|
|
 |
Major Averages Erased Gains to End Session Lower
Kenneth J. Gruneisen - Passed the CAN SLIM® Master's Exam
The major averages finished lower in a volatile trading session on Monday. The Dow declined 17 points to 16,991. The S&P 500 fell 3 points to 1,964. The NASDAQ dropped 20 points to 4,454. The volume totals were reported mixed, lighter than the prior session total on the NYSE and higher on the Nasdaq exchange. Decliners outnumbered advancers by a 2-1 margin on the Nasdaq exchange while the mix as even on the NYSE. There were 21 high-ranked companies from the CANSLIM.net Leaders List that made new 52-week highs and appeared on the CANSLIM.net BreakOuts Page, down from the prior session total of 26 stocks. New 52-week lows outnumbered new 52-week highs on the NYSE and on the Nasdaq exchange. There was only 1 gainer among the 6 high-ranked companies currently included on the Featured Stocks Page. Distributional action raised concerns while leadership (stocks hitting new 52-week highs) waned and a deteriorating market (M criteria) environment was repeatedly noted in this commentary. New buying efforts are discouraged during market corrections while the fact-based investment system prompts disciplined investors to lean toward reducing market exposure.
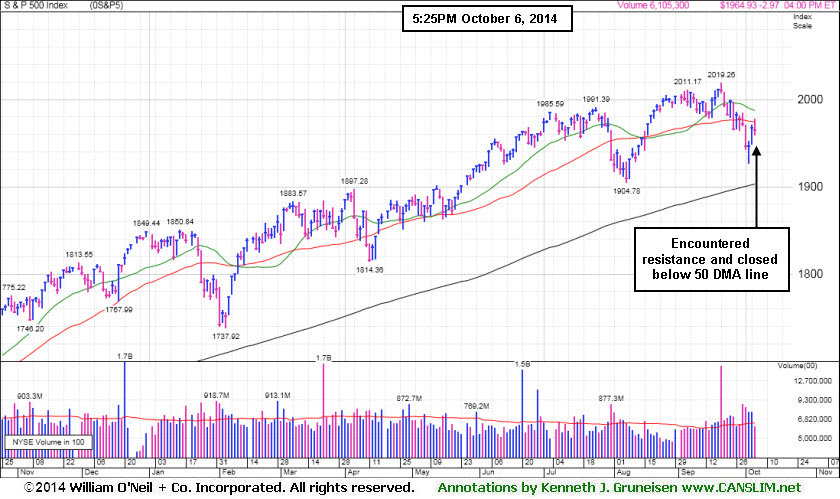
PICTURED: The S&P 500 Index ran into resistance at its 50-day moving average (DMA) line and reversed early gains to end the session lower.
Stocks declined amid a round of profit taking following last Friday's rally. Investors were also cautious before the start of third quarter earnings season. Alcoa (AA +2.5%) rose before it kicks off the reporting season after the close on Wednesday and eight other S&P 500 companies are scheduled to post results this week.
Seven of the 10 sectors in the S&P 500 declined. Consumer discretionary and health care were the worst performing groups with Nike (NKE -1%) and Gilead Sciences (GILD -1.4%) among the decliners.
On the upside, telecom stocks advanced led by Verizon's (VZ +0.8%) gain. Energy and technology also gained ground. Exxon Mobil (XOM +0.8%) edged higher as WTI crude rebounded from last week's -4.1% drop. Hewlett-Packard (HPQ +4.7%) rose after saying it plans to split into two publicly traded companies.
Treasuries were mixed. The 10-year note rose 4/32 to yield 2.42%. The 30-year bond was flat to yield 3.12%.
The CANSLIM.net Featured Stocks Page shows the most action-worthy candidates and their latest notes and a Headline Link directs members to the latest detailed analysis with data-packed graphs annotated by a Certified expert along with links to additional resources. The Premium Member Homepage includes "dynamic archives" to all prior pay reports published.
|
 Kenneth J. Gruneisen started out as a licensed stockbroker in August 1987, a couple of months prior to the historic stock market crash that took the Dow Jones Industrial Average down -22.6% in a single day. He has published daily fact-based fundamental and technical analysis on high-ranked stocks online for two decades. Through FACTBASEDINVESTING.COM, Kenneth provides educational articles, news, market commentary, and other information regarding proven investment systems that work in good times and bad.
Comments contained in the body of this report are technical opinions only and are not necessarily those of Gruneisen Growth Corp. The material herein has been obtained from sources believed to be reliable and accurate, however, its accuracy and completeness cannot be guaranteed. Our firm, employees, and customers may effect transactions, including transactions contrary to any recommendation herein, or have positions in the securities mentioned herein or options with respect thereto. Any recommendation contained in this report may not be suitable for all investors and it is not to be deemed an offer or solicitation on our part with respect to the purchase or sale of any securities. |
|
 |
Tech, Retail, and Financial Groups Fell; Commodity-Linked Groups Rose
Kenneth J. Gruneisen - Passed the CAN SLIM® Master's Exam
The tech sector endured some pressure as the Biotechnology Index ($BTK -1.46%), Networking Index ($NWX -1.06%), and the Semiconductor Index ($SOX -0.83%) ended unanimously lower. The Retail Index ($RLX -0.67%) was a negative influence on the major averages and the financial group also backpedaled as the Broker/Dealer Index ($XBD -0.45%) and the Bank Index ($BKX -0.36%) ended modestly lower. Meanwhile, commodity-linked groups had a positive bias as the Gold & Silver Index ($XAU +1.57%) posted a solid gain while the Integrated Oil Index ($XOI +0.14%) and the Oil Services Index ($OSX +0.33%) posted modest gains.
Charts courtesy www.stockcharts.com
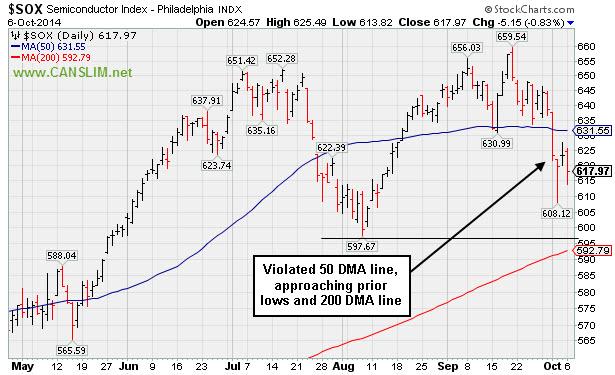
PICTURED: The Semiconductor Index ($SOX -0.83%) recently violated its 50-day moving average (DMA) line, approaching prior lows and its 200 DMA line.
| Oil Services |
$OSX |
255.44 |
+0.85 |
+0.33% |
-9.11% |
| Integrated Oil |
$XOI |
1,513.89 |
+2.15 |
+0.14% |
+0.72% |
| Semiconductor |
$SOX |
617.97 |
-5.15 |
-0.83% |
+15.50% |
| Networking |
$NWX |
316.32 |
-3.38 |
-1.06% |
-2.35% |
| Broker/Dealer |
$XBD |
168.50 |
-0.76 |
-0.45% |
+4.95% |
| Retail |
$RLX |
932.40 |
-6.30 |
-0.67% |
-0.79% |
| Gold & Silver |
$XAU |
79.65 |
+1.23 |
+1.57% |
-5.35% |
| Bank |
$BKX |
71.52 |
-0.26 |
-0.36% |
+3.26% |
| Biotech |
$BTK |
3,047.98 |
-45.07 |
-1.46% |
+30.79% |
|
|
|
 |
Halted Slide After Negating Breakout and Undercutting 50-Day Average
Kenneth J. Gruneisen - Passed the CAN SLIM® Master's Exam
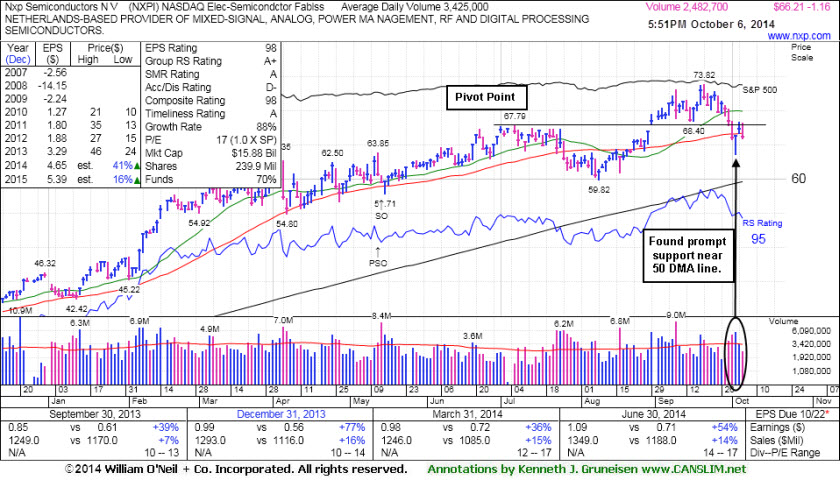
Nxp Semiconductors N V (NXPI -$1.16 or -1.72% to $66.21) is consolidating near its 50-day moving average (DMA) line after finding prompt support. It undercut prior highs in the $67 area with damaging volume-driven losses which recently negated the prior breakout. Disciplined investors avoid chasing stocks more than +5% above their prior high or pivot point and always limit losses by selling any stock that falls more than -7% from their purchase price. Keep in mind that weakening market conditions (M criteria) have been prompting investors to reduce exposure in any faltering stocks and avoid new buying efforts until strength returns.
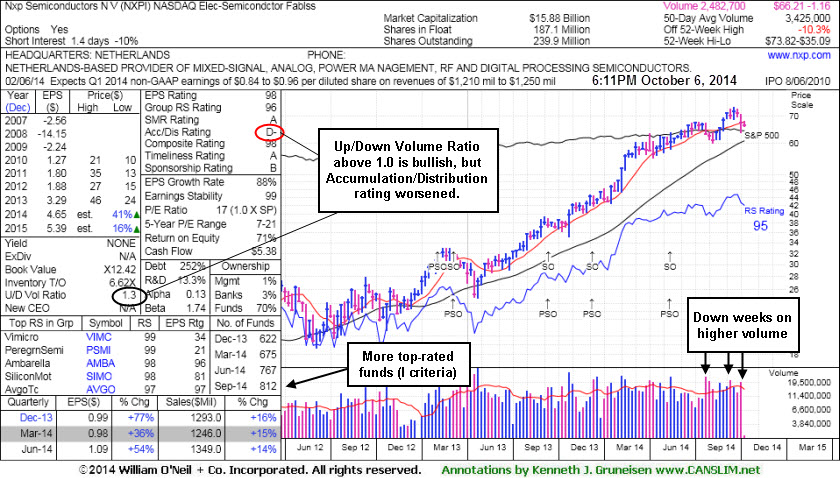
In recent weeks it tallied losses with higher volume as seen on the weekly graph below and it still has a bullish Up/Down Volume Ratio above 1.0, however its Accumulation/Distribution rating fell to D- from C+ since last shown in this FSU section on 9/17/14 with annotated graphs under the headline "Consolidating Above Pivot Point and Below 'Max Buy' Level". NXPI was highlighted in yellow with pivot point cited based on its 7/07/14 high plus 10 cents in the 8/29/14 mid-day report (read here). Its gap up gain backed by +95% above average volume helped it trigger a technical buy signal. Quarterly earnings (C criteria) through Jun '14 have shown strong growth and its annual earnings (A criteria) history is a good match the investment system guidelines. The number of top-rated funds owning its shares rose from 530 in Sep '13 to 812 in Jun '14, a reassuring sign concerning the I criteria. The Elec - Semicondctor Fablss group has a high 96 Group Relative Strength Rating and leadership from others in the industry group is a reassuring sign concerning the L criteria. It completed a Secondary Offering on 5/14/14 and earlier Secondary Offerings on 2/04/13, 3/08/13, 9/13/13, and 12/10/13.
|
|
|
Color Codes Explained :
Y - Better candidates highlighted by our
staff of experts.
G - Previously featured
in past reports as yellow but may no longer be buyable under the
guidelines.
***Last / Change / Volume data in this table is the closing quote data***
Symbol/Exchange
Company Name
Industry Group |
PRICE |
CHANGE
(%Change) |
Day High |
Volume
(% DAV)
(% 50 day avg vol) |
52 Wk Hi
% From Hi |
Featured
Date |
Price
Featured |
Pivot Featured |
|
Max Buy |
ACT
-
NYSE
Actavis plc
Medical-Generic Drugs
|
$243.95
|
-2.12
-0.86% |
$246.82
|
1,730,343
73.98% of 50 DAV
50 DAV is 2,339,000
|
$249.94
-2.40%
|
6/20/2014
|
$216.53
|
PP = $230.87
|
|
MB = $242.41
|
Most Recent Note - 10/3/2014 11:43:35 AM
G - Rallying back above its "max buy" level and its color code is changed to green. Prior highs near $230 define near-term support to watch on pullbacks.
>>> FEATURED STOCK ARTICLE : Finally Volume-backed Gains Confirmed a Technical Buy Signal - 9/19/2014
View all notes |
Set NEW NOTE alert |
CANSLIM.net Company Profile |
SEC
News |
Chart |
Request a new note
C
A N
S L
I M


|
FB
-
NASDAQ
Facebook Inc Cl A
INTERNET
|
$77.56
|
+0.12
0.15% |
$77.89
|
25,696,469
78.51% of 50 DAV
50 DAV is 32,732,000
|
$79.71
-2.70%
|
9/9/2014
|
$76.67
|
PP = $76.84
|
|
MB = $80.68
|
Most Recent Note - 10/1/2014 1:53:21 PM
Y - Pulling back with higher volume today after wedging higher with gains lacking great volume conviction. Its 50 DMA line ($75.41) defines important near term support where a violation would trigger a technical sell signal
>>> FEATURED STOCK ARTICLE : Fell Toward 50-day Moving Average; Recent Gains Lacked Great Volume - 9/25/2014
View all notes |
Set NEW NOTE alert |
CANSLIM.net Company Profile |
SEC
News |
Chart |
Request a new note
C
A N
S L
I M
|
NXPI
-
NASDAQ
Nxp Semiconductors N V
ELECTRONICS - Semiconductor - Broad Line
|
$66.21
|
-1.16
-1.72% |
$68.17
|
2,482,948
72.49% of 50 DAV
50 DAV is 3,425,000
|
$73.82
-10.31%
|
8/29/2014
|
$68.50
|
PP = $67.89
|
|
MB = $71.28
|
 Most Recent Note - 10/6/2014 6:37:05 PM
Y- Halted its slide near 50 DMA line after undercutting prior highs. Weakening market conditions (M criteria) are prompting investors to reduce exposure in any faltering stocks and avoid new buying efforts until strength returns. See the latest FSU analysis for more details and new annotated graphs.
>>> FEATURED STOCK ARTICLE : Halted Slide After Negating Breakout and Undercutting 50-Day Average - 10/6/2014
View all notes |
Set NEW NOTE alert |
CANSLIM.net Company Profile |
SEC
News |
Chart |
Request a new note
C
A N
S L
I M
|
PANW
-
NYSE
Palo Alto Networks
Computer Sftwr-Security
|
$102.25
|
-2.45
-2.34% |
$104.67
|
2,425,143
135.48% of 50 DAV
50 DAV is 1,790,000
|
$106.79
-4.25%
|
7/30/2014
|
$84.21
|
PP = $85.88
|
|
MB = $90.17
|
Most Recent Note - 10/6/2014 1:45:03 PM
G - Perched near its 52-week high following volume-driven gains. Held its ground stubbornly while widespread market (M criteria) weakness recently prompted concerns. The recent low ($103.00 on 10/01/14) defines initial support to watch above its 50 DMA line.
>>> FEATURED STOCK ARTICLE : Holding Ground Near Highs After Big Volume-Driven Gains - 9/24/2014
View all notes |
Set NEW NOTE alert |
CANSLIM.net Company Profile |
SEC
News |
Chart |
Request a new note
C
A N
S L
I M
|
STRT
-
NASDAQ
Strattec Security Corp
AUTOMOTIVE - Auto Parts
|
$80.59
|
-1.47
-1.79% |
$82.05
|
23,434
101.89% of 50 DAV
50 DAV is 23,000
|
$89.87
-10.33%
|
9/19/2014
|
$86.06
|
PP = $89.97
|
|
MB = $94.47
|
Most Recent Note - 10/1/2014 2:05:31 PM
Y - Still quietly consolidating, however eroding market conditions (M criteria) have raised concerns. Previously noted - "Volume-driven gains above the new pivot point cited may trigger a new (or add-on) technical buy signal. Its 50 DMA line and prior highs define important support to watch on pullbacks."
>>> FEATURED STOCK ARTICLE : Consolidating Above Prior Highs and 50-Day Moving Average Line - 9/26/2014
View all notes |
Set NEW NOTE alert |
CANSLIM.net Company Profile |
SEC
News |
Chart |
Request a new note
C
A N
S L
I M
|
Symbol/Exchange
Company Name
Industry Group |
PRICE |
CHANGE
(%Change) |
Day High |
Volume
(% DAV)
(% 50 day avg vol) |
52 Wk Hi
% From Hi |
Featured
Date |
Price
Featured |
Pivot Featured |
|
Max Buy |
TARO
-
NYSE
Taro Pharmaceutical Inds
DRUGS - Drug Manufacturers - Other
|
$152.38
|
-0.55
-0.36% |
$154.54
|
199,760
210.27% of 50 DAV
50 DAV is 95,000
|
$165.30
-7.82%
|
7/30/2014
|
$144.24
|
PP = $149.99
|
|
MB = $157.49
|
Most Recent Note - 10/6/2014 1:51:27 PM
G - Consolidating near its 50 DMA line. Recent losses raised concerns and triggered a technical sell signal. Repeatedly noted with caution - "Recently reported earnings for the Jun '14 quarter below the +25% minimum earnings guideline (C criteria) raising fundamental concerns."
>>> FEATURED STOCK ARTICLE : Consolidating Above 50-day Moving Average and Prior Highs - 9/23/2014
View all notes |
Set NEW NOTE alert |
CANSLIM.net Company Profile |
SEC
News |
Chart |
Request a new note
C
A N
S L
I M
|
|
|
|
THESE ARE NOT BUY RECOMMENDATIONS!
Comments contained in the body of this report are technical
opinions only. The material herein has been obtained
from sources believed to be reliable and accurate, however,
its accuracy and completeness cannot be guaranteed.
This site is not an investment advisor, hence it does
not endorse or recommend any securities or other investments.
Any recommendation contained in this report may not
be suitable for all investors and it is not to be deemed
an offer or solicitation on our part with respect to
the purchase or sale of any securities. All trademarks,
service marks and trade names appearing in this report
are the property of their respective owners, and are
likewise used for identification purposes only.
This report is a service available
only to active Paid Premium Members.
You may opt-out of receiving report notifications
at any time. Questions or comments may be submitted
by writing to Premium Membership Services 665 S.E. 10 Street, Suite 201 Deerfield Beach, FL 33441-5634 or by calling 1-800-965-8307
or 954-785-1121.
|
|
|

