***Last / Change / Volume data in this table is the closing quote data***
Symbol/Exchange
Company Name
Industry Group |
PRICE |
CHANGE
(%Change) |
Day High |
Volume
(% DAV)
(% 50 day avg vol) |
52 Wk Hi
% From Hi |
Featured
Date |
Price
Featured |
Pivot Featured |
|
Max Buy |
AVG
-
NYSE
A V G Technologies N.V.
INTERNET - Internet Software and Services
|
$24.41
|
+1.16
4.99% |
$24.65
|
861,098
92.09% of 50 DAV
50 DAV is 935,100
|
$26.56
-8.08%
|
9/13/2013
|
$23.06
|
PP = $23.88
|
|
MB = $25.07
|
 Most Recent Note - 10/4/2013 11:34:38 PM
Y - Rallied from support near prior highs in the $23 area and its 50 DMA line ($22.88 now). Subsequent damaging violations may trigger technical sell signals.
>>> The latest Featured Stock Update with an annotated graph appeared on 9/13/2013. Click here.
View all notes |
Alert me of new notes |
CANSLIM.net Company Profile |
SEC |
Zacks Reports |
StockTalk |
News |
Chart |
Request a new note
C
A N
S L
I M


|
BITA
-
NYSE
Bitauto Hldgs Ltd Ads
INTERNET - Internet Information Providers
|
$20.48
|
+1.36
7.11% |
$21.08
|
988,339
200.76% of 50 DAV
50 DAV is 492,300
|
$19.93
2.76%
|
9/24/2013
|
$16.40
|
PP = $17.31
|
|
MB = $18.18
|
Most Recent Note - 10/4/2013 12:13:30 PM
G - Gain today has it rallying further above its "max buy" level to new 52-week highs. Prior highs in the $18 area define define initial support on pullbacks. See the latest FSU analysis for more details and a new annotated graph.
>>> The latest Featured Stock Update with an annotated graph appeared on 10/2/2013. Click here.
View all notes |
Alert me of new notes |
CANSLIM.net Company Profile |
SEC |
Zacks Reports |
StockTalk |
News |
Chart |
Request a new note
C
A N
S L
I M
|
CELG
-
NASDAQ
Celgene Corp
DRUGS - Drug Manufacturers - Major
|
$157.27
|
+4.65
3.05% |
$157.95
|
2,725,501
108.59% of 50 DAV
50 DAV is 2,509,900
|
$157.50
-0.15%
|
9/12/2013
|
$149.50
|
PP = $150.02
|
|
MB = $157.52
|
Most Recent Note - 10/4/2013 11:32:47 PM
Y - Rallied for a best-ever close and hit another new 52-week high today. It is trading near its "max buy" level. Its 50 DMA line ($144.88 now) defines near-term support to watch.
>>> The latest Featured Stock Update with an annotated graph appeared on 9/20/2013. Click here.
View all notes |
Alert me of new notes |
CANSLIM.net Company Profile |
SEC |
Zacks Reports |
StockTalk |
News |
Chart |
Request a new note
C
A N
S L
I M
|
EGBN
-
NASDAQ
Eagle Bancorp Inc
BANKING - Regional - Mid-Atlantic Banks
|
$28.18
|
+0.10
0.36% |
$28.59
|
46,966
63.04% of 50 DAV
50 DAV is 74,500
|
$28.48
-1.05%
|
9/16/2013
|
$27.48
|
PP = $27.77
|
|
MB = $29.16
|
Most Recent Note - 10/1/2013 6:04:28 PM
Y - Inched to new high territory with light volume behind today's 4th consecutive gain. Stubbornly held its ground after a recent spurt of volume-driven gains and it remains below its "max buy" level.
>>> The latest Featured Stock Update with an annotated graph appeared on 9/16/2013. Click here.
View all notes |
Alert me of new notes |
CANSLIM.net Company Profile |
SEC |
Zacks Reports |
StockTalk |
News |
Chart |
Request a new note
C
A N
S L
I M
|
FLT
-
NYSE
Fleetcor Technologies
DIVERSIFIED SERVICES - Business/Management Services
|
$112.04
|
+0.89
0.80% |
$112.25
|
636,256
95.92% of 50 DAV
50 DAV is 663,300
|
$113.68
-1.44%
|
8/19/2013
|
$99.01
|
PP = $100.97
|
|
MB = $106.02
|
Most Recent Note - 10/3/2013 5:51:30 PM
G - Hovering near all-time highs after wedging higher since completing a Secondary Offering on 9/11/13. Its 50 DMA line defines important near term support to watch on pullbacks. FLT has traded up as much as +59.8% since first featured in yellow in the mid-day report on 3/21/13 (read here).
>>> The latest Featured Stock Update with an annotated graph appeared on 9/6/2013. Click here.
View all notes |
Alert me of new notes |
CANSLIM.net Company Profile |
SEC |
Zacks Reports |
StockTalk |
News |
Chart |
Request a new note
C
A N
S L
I M
|
Symbol/Exchange
Company Name
Industry Group |
PRICE |
CHANGE
(%Change) |
Day High |
Volume
(% DAV)
(% 50 day avg vol) |
52 Wk Hi
% From Hi |
Featured
Date |
Price
Featured |
Pivot Featured |
|
Max Buy |
GNRC
-
NYSE
Generac Hldgs Inc
CONSUMER DURABLES - Electronic Equipment
|
$42.05
|
-0.08
-0.19% |
$42.73
|
502,286
63.14% of 50 DAV
50 DAV is 795,500
|
$44.30
-5.08%
|
9/12/2013
|
$41.40
|
PP = $43.27
|
|
MB = $45.43
|
Most Recent Note - 9/30/2013 11:55:20 AM
Y - Pulling back near its 50 DMA line today. It stalled after triggering a technical buy signal on 9/20/13. Disciplined investors limit losses by selling if any stock falls more than -7% from their purchase price.
>>> The latest Featured Stock Update with an annotated graph appeared on 9/23/2013. Click here.
View all notes |
Alert me of new notes |
CANSLIM.net Company Profile |
SEC |
Zacks Reports |
StockTalk |
News |
Chart |
Request a new note
C
A N
S L
I M
|
JAZZ
-
NASDAQ
Jazz Pharmaceuticals Plc
DRUGS - Biotechnology
|
$90.99
|
+1.46
1.63% |
$92.25
|
601,802
89.01% of 50 DAV
50 DAV is 676,100
|
$93.84
-3.04%
|
9/30/2013
|
$93.20
|
PP = $89.10
|
|
MB = $93.56
|
Most Recent Note - 9/30/2013 6:04:16 PM
Y- Finished strong today with a solid gain backed by +160% above average volume while rallying above the pivot point cited based its 9/03/13 high plus 10 cents after an advanced "3-weeks tight" base. See the latest FSU analysis for more details and a new annotated graph.
>>> The latest Featured Stock Update with an annotated graph appeared on 9/30/2013. Click here.
View all notes |
Alert me of new notes |
CANSLIM.net Company Profile |
SEC |
Zacks Reports |
StockTalk |
News |
Chart |
Request a new note
C
A N
S L
I M
|
KORS
-
NYSE
Michael Kors Hldgs Ltd
RETAIL - Apparel Stores
|
$76.35
|
+1.52
2.03% |
$77.05
|
1,904,219
55.26% of 50 DAV
50 DAV is 3,445,900
|
$78.62
-2.89%
|
8/6/2013
|
$69.66
|
PP = $66.28
|
|
MB = $69.59
|
Most Recent Note - 9/27/2013 5:21:05 PM
G - Extended from its prior base and consolidating near its 52-week high. Its 50 DMA line (now $71.33) defines support above prior highs in the $66 area. See the latest FSU analysis for more details and a new annotated graph.
>>> The latest Featured Stock Update with an annotated graph appeared on 9/27/2013. Click here.
View all notes |
Alert me of new notes |
CANSLIM.net Company Profile |
SEC |
Zacks Reports |
StockTalk |
News |
Chart |
Request a new note
C
A N
S L
I M
|
LOPE
-
NASDAQ
Grand Canyon Education
DIVERSIFIED SERVICES - Education and; Training Services
|
$40.31
|
+0.26
0.65% |
$40.66
|
143,485
38.39% of 50 DAV
50 DAV is 373,800
|
$41.33
-2.47%
|
6/19/2013
|
$31.47
|
PP = $34.17
|
|
MB = $35.88
|
Most Recent Note - 10/3/2013 5:53:22 PM
G - Pulling back from new all-time high with small losses on light or average volume. Fundamental concerns remain while technical action has been reassuring.
>>> The latest Featured Stock Update with an annotated graph appeared on 9/12/2013. Click here.
View all notes |
Alert me of new notes |
CANSLIM.net Company Profile |
SEC |
Zacks Reports |
StockTalk |
News |
Chart |
Request a new note
C
A N
S L
I M
|
MRLN
-
NASDAQ
Marlin Business Services
DIVERSIFIED SERVICES - Rental and Leasing Services
|
$24.69
|
+0.31
1.27% |
$24.90
|
17,584
48.57% of 50 DAV
50 DAV is 36,200
|
$26.96
-8.42%
|
9/9/2013
|
$23.75
|
PP = $24.03
|
|
MB = $25.23
|
Most Recent Note - 10/2/2013 7:47:19 PM
G - Finished well above the session low today but tallied its 5th consecutive loss with light volume while retreating from its 52-week high. Gains lacked great volume conviction since recently paying a $2.00 per share Special Dividend.
>>> The latest Featured Stock Update with an annotated graph appeared on 9/9/2013. Click here.
View all notes |
Alert me of new notes |
CANSLIM.net Company Profile |
SEC |
Zacks Reports |
StockTalk |
News |
Chart |
Request a new note
C
A N
S L
I M
|
Symbol/Exchange
Company Name
Industry Group |
PRICE |
CHANGE
(%Change) |
Day High |
Volume
(% DAV)
(% 50 day avg vol) |
52 Wk Hi
% From Hi |
Featured
Date |
Price
Featured |
Pivot Featured |
|
Max Buy |
PCLN
-
NASDAQ
Priceline.Com Inc
INTERNET - Internet Software and Services
|
$1,062.17
|
+12.86
1.23% |
$1,064.00
|
558,084
89.93% of 50 DAV
50 DAV is 620,600
|
$1,074.89
-1.18%
|
9/13/2013
|
$966.82
|
PP = $995.08
|
|
MB = $1,044.83
|
Most Recent Note - 10/2/2013 7:52:26 PM
G - Volume was +92% above average pace today, enough to clinch a technical buy signal while quickly rising beyond its "max buy" level and getting extended from its prior base.
>>> The latest Featured Stock Update with an annotated graph appeared on 9/19/2013. Click here.
View all notes |
Alert me of new notes |
CANSLIM.net Company Profile |
SEC |
Zacks Reports |
StockTalk |
News |
Chart |
Request a new note
C
A N
S L
I M
|
PRAA
-
NASDAQ
Portfolio Recovery Assoc
DIVERSIFIED SERVICES - Business/Management Services
|
$58.77
|
-0.09
-0.15% |
$59.59
|
384,906
75.27% of 50 DAV
50 DAV is 511,400
|
$61.60
-4.59%
|
7/31/2013
|
$51.43
|
PP = $54.72
|
|
MB = $57.46
|
Most Recent Note - 9/27/2013 4:12:31 PM
G - Small gap down today on light volume, pulling back from new 52-week highs after 4 consecutive gains on light volume, wedging higher and getting more extended from its prior base. See the latest FSU analysis for more details and an annotated graph.
>>> The latest Featured Stock Update with an annotated graph appeared on 9/26/2013. Click here.
View all notes |
Alert me of new notes |
CANSLIM.net Company Profile |
SEC |
Zacks Reports |
StockTalk |
News |
Chart |
Request a new note
C
A N
S L
I M
|
PRLB
-
NYSE
Proto Labs Inc
MANUFACTURING - Small Tools and Accessories
|
$80.47
|
+2.56
3.29% |
$80.91
|
195,248
47.42% of 50 DAV
50 DAV is 411,700
|
$80.66
-0.24%
|
7/29/2013
|
$64.86
|
PP = $67.50
|
|
MB = $70.88
|
Most Recent Note - 10/4/2013 11:35:56 PM
G - Gain on light volume for a new 52-week high today. Extended from any sound base. Support to watch is at its 50 DMA line.
>>> The latest Featured Stock Update with an annotated graph appeared on 9/25/2013. Click here.
View all notes |
Alert me of new notes |
CANSLIM.net Company Profile |
SEC |
Zacks Reports |
StockTalk |
News |
Chart |
Request a new note
C
A N
S L
I M
|
SFUN
-
NYSE
Soufun Hldgs Ltd Ads A
INTERNET - Internet Information Providers
|
$50.36
|
+2.94
6.20% |
$51.16
|
1,546,271
134.67% of 50 DAV
50 DAV is 1,148,200
|
$53.77
-6.34%
|
7/16/2013
|
$29.54
|
PP = $27.90
|
|
MB = $29.30
|
Most Recent Note - 10/4/2013 11:37:35 PM
G - Posted a solid gain with above average volume today following an abrupt volume-driven retreat from its 52-week high. It has not formed a new base of sufficient length. The 50 DMA line and prior highs coincide in the $42 area defining important near-term support to watch on pullbacks.
>>> The latest Featured Stock Update with an annotated graph appeared on 10/1/2013. Click here.
View all notes |
Alert me of new notes |
CANSLIM.net Company Profile |
SEC |
Zacks Reports |
StockTalk |
News |
Chart |
Request a new note
C
A N
S L
I M
|
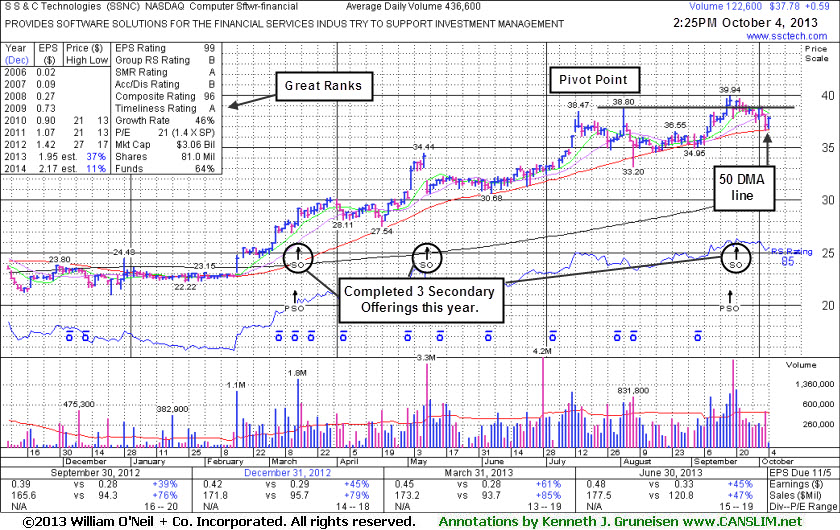
SSNC
-
NASDAQ
S S & C Technologies
COMPUTER SOFTWARE and SERVICES - Application Software
|
$37.55
|
+0.36
0.97% |
$37.94
|
360,584
82.59% of 50 DAV
50 DAV is 436,600
|
$39.94
-5.98%
|
9/5/2013
|
$36.01
|
PP = $38.90
|
|
MB = $40.85
|
Most Recent Note - 9/27/2013 5:23:22 PM
Y - Volume totals have been cooling while holding its ground in a tight range near its 52-week high and near the pivot point cited based on its 8/02/13 high plus 10 cents. Completed a Secondary Offering on 9/20/13 while perched at all-time highs.
>>> The latest Featured Stock Update with an annotated graph appeared on 10/4/2013. Click here.
View all notes |
Alert me of new notes |
CANSLIM.net Company Profile |
SEC |
Zacks Reports |
StockTalk |
News |
Chart |
Request a new note
C
A N
S L
I M
|
Symbol/Exchange
Company Name
Industry Group |
PRICE |
CHANGE
(%Change) |
Day High |
Volume
(% DAV)
(% 50 day avg vol) |
52 Wk Hi
% From Hi |
Featured
Date |
Price
Featured |
Pivot Featured |
|
Max Buy |
SSYS
-
NASDAQ
Stratasys Ltd
COMPUTER HARDWARE - Computer Peripherals
|
$99.61
|
-0.20
-0.20% |
$101.15
|
794,658
71.69% of 50 DAV
50 DAV is 1,108,400
|
$113.49
-12.23%
|
7/8/2013
|
$91.44
|
PP = $95.00
|
|
MB = $99.75
|
Most Recent Note - 10/3/2013 5:59:50 PM
G - Pulled back today on average but higher volume while testing its 50 DMA line again. Completed a new Public Offering on 9/13/13. It has not formed a sound base.
>>> The latest Featured Stock Update with an annotated graph appeared on 9/10/2013. Click here.
View all notes |
Alert me of new notes |
CANSLIM.net Company Profile |
SEC |
Zacks Reports |
StockTalk |
News |
Chart |
Request a new note
C
A N
S L
I M
|
STMP
-
NASDAQ
Stamps.Com Inc
INTERNET - Internet Software and Services
|
$44.93
|
+0.28
0.63% |
$45.51
|
68,946
57.50% of 50 DAV
50 DAV is 119,900
|
$46.80
-3.99%
|
9/24/2013
|
$45.54
|
PP = $46.57
|
|
MB = $48.90
|
Most Recent Note - 10/1/2013 6:05:51 PM
Y - Finished at a best-ever close with today's 4th consecutive small gain on light volume. A new pivot point was cited based on its 8/01/13 high plus 10 cents. Recently found encouraging support at its 50 DMA line. Volume-driven gains to new highs may trigger a new (or add-on) technical buy signal.
>>> The latest Featured Stock Update with an annotated graph appeared on 9/24/2013. Click here.
View all notes |
Alert me of new notes |
CANSLIM.net Company Profile |
SEC |
Zacks Reports |
StockTalk |
News |
Chart |
Request a new note
C
A N
S L
I M
|
TBBK
-
NASDAQ
Bancorp Inc
BANKING - Regional - Mid-Atlantic Banks
|
$17.50
|
-0.07
-0.40% |
$17.91
|
105,159
54.12% of 50 DAV
50 DAV is 194,300
|
$18.61
-5.96%
|
9/4/2013
|
$16.26
|
PP = $16.79
|
|
MB = $17.63
|
Most Recent Note - 10/3/2013 5:54:51 PM
Y - Color code is changed to yellow while consolidating just below its "max buy" level. Prior highs and its 50 DMA line define important support to watch on pullbacks. See the latest FSU analysis for more details and a new annotated graph.
>>> The latest Featured Stock Update with an annotated graph appeared on 10/3/2013. Click here.
View all notes |
Alert me of new notes |
CANSLIM.net Company Profile |
SEC |
Zacks Reports |
StockTalk |
News |
Chart |
Request a new note
C
A N
S L
I M
|
TNGO
-
NASDAQ
Tangoe Inc
COMPUTER SOFTWARE and SERVICES - Technical and System Software
|
$24.07
|
+0.42
1.78% |
$24.39
|
309,046
54.81% of 50 DAV
50 DAV is 563,800
|
$24.60
-2.14%
|
9/12/2013
|
$21.30
|
PP = $23.15
|
|
MB = $24.31
|
Most Recent Note - 10/3/2013 5:56:06 PM
Y - Pulled back today with above average volume, encountering distributional pressure. Convincing volume-driven gains above its pivot point cited based on its May 2012 high plus 10 cents may signal the beginning of a substantial leg higher.
>>> The latest Featured Stock Update with an annotated graph appeared on 9/17/2013. Click here.
View all notes |
Alert me of new notes |
CANSLIM.net Company Profile |
SEC |
Zacks Reports |
StockTalk |
News |
Chart |
Request a new note
C
A N
S L
I M
|
VRX
-
NYSE
Valeant Pharmaceuticals
DRUGS - Drug Manufacturers - Other
|
$111.01
|
-0.39
-0.35% |
$112.81
|
1,743,115
147.85% of 50 DAV
50 DAV is 1,179,000
|
$113.79
-2.44%
|
9/11/2013
|
$100.26
|
PP = $105.50
|
|
MB = $110.78
|
Most Recent Note - 10/4/2013 12:41:06 PM
G- Color code is changed to green after rallying above its "max buy" level. Gains above the pivot point with volume helped clinch a technical buy signal. Recent insider buying while trading near its highs has been noted as an encouraging sign.
>>> The latest Featured Stock Update with an annotated graph appeared on 9/11/2013. Click here.
View all notes |
Alert me of new notes |
CANSLIM.net Company Profile |
SEC |
Zacks Reports |
StockTalk |
News |
Chart |
Request a new note
C
A N
S L
I M
|
Symbol/Exchange
Company Name
Industry Group |
PRICE |
CHANGE
(%Change) |
Day High |
Volume
(% DAV)
(% 50 day avg vol) |
52 Wk Hi
% From Hi |
Featured
Date |
Price
Featured |
Pivot Featured |
|
Max Buy |
YNDX
-
NASDAQ
Yandex N V Class A
INTERNET - Internet Information Providers
|
$38.35
|
-0.03
-0.08% |
$38.75
|
1,988,024
85.72% of 50 DAV
50 DAV is 2,319,100
|
$39.44
-2.76%
|
9/5/2013
|
$34.24
|
PP = $34.79
|
|
MB = $36.53
|
Most Recent Note - 10/3/2013 1:06:46 PM
G - Hit another new all-time high with today's volume-driven gain, getting more extended from its prior base. Prior highs in the $34 area and its 50 DMA line define support to watch on pullbacks.
>>> The latest Featured Stock Update with an annotated graph appeared on 9/18/2013. Click here.
View all notes |
Alert me of new notes |
CANSLIM.net Company Profile |
SEC |
Zacks Reports |
StockTalk |
News |
Chart |
Request a new note
C
A N
S L
I M
|