You are not logged in.
This means you
CAN ONLY VIEW reports that were published prior to Monday, April 14, 2025.
You
MUST UPGRADE YOUR MEMBERSHIP if you want to see any current reports.
AFTER MARKET UPDATE - FRIDAY, OCTOBER 3RD, 2014
Previous After Market Report Next After Market Report >>>
|
|
|
|
DOW |
+208.64 |
17,009.69 |
+1.24% |
|
Volume |
797,842,920 |
+2% |
|
Volume |
1,626,041,100 |
-19% |
|
NASDAQ |
+45.43 |
4,475.62 |
+1.03% |
|
Advancers |
2,087 |
66% |
|
Advancers |
1,855 |
64% |
|
S&P 500 |
+21.73 |
1,967.90 |
+1.12% |
|
Decliners |
991 |
31% |
|
Decliners |
904 |
31% |
|
Russell 2000 |
+8.36 |
1,104.74 |
+0.76% |
|
52 Wk Highs |
36 |
|
|
52 Wk Highs |
37 |
|
|
S&P 600 |
+4.22 |
636.31 |
+0.67% |
|
52 Wk Lows |
80 |
|
|
52 Wk Lows |
72 |
|
|
 |
Dow Jones Industrial Average Rebounded Above 50-Day Average
Kenneth J. Gruneisen - Passed the CAN SLIM® Master's Exam
Friday's gains helped recover some of the weekly losses. The Dow finished the week down -0.6%. The S&P 500 declined -0.8% and the NASDAQ fell -0.8%. The volume totals were reported mixed, higher than the prior session total on the NYSE and lower on the Nasdaq exchange. Breadth was positive as advancers led decliners by a 2-1 margin on the NYSE and on the NASDAQ exchange. There was an encouraging expansion in leadership as 26 high-ranked companies from the CANSLIM.net Leaders List that made new 52-week highs and appeared on the CANSLIM.net BreakOuts Page, up from the prior session total of 11 stocks. The new 52-week lows list solidly outnumbered new 52-week highs on the NYSE and on the Nasdaq exchange. There were gains for all 6 high-ranked companies currently included on the Featured Stocks Page. Distributional action raised concerns while leadership (stocks hitting new 52-week highs) waned and a deteriorating market (M criteria) environment was repeatedly noted in this commentary since last Thursday. New buying efforts are discouraged during market corrections while the fact-based investment system prompts disciplined investors to lean toward reducing market exposure.
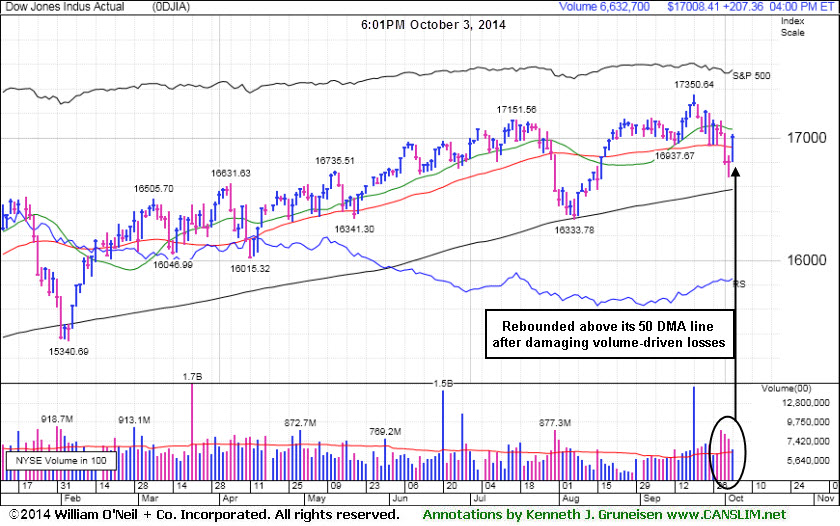
PICTURED: The Dow Jones Industrial Average surged 208 points to 17,009, rebounding after damaging volume-driven losses to close the week above its 50-day moving average line.
Stocks marched higher on Friday. The S&P 500 Index advanced 22 points to 1,967 and the Nasdaq Composite Index finished up by 45 points to 4,475, however both indexes remain below their respective 50-day moving average (DMA) lines. Subsequent improvements to watch for include a confirming follow-through day of big gains by at least one major average backed by higher volume coupled with an expansion in leadership. Remember that selling any faltering stocks during rough market periods preserves your confidence and your capital for whenever strength eventually returns to the market.
The major averages regained some of their losses from the week thanks to an encouraging employment report. In September non-farm payrolls increased by 248,000, following an upwardly revised gain of 180,000 in August. The unemployment rate declined to 5.9% from 6.1% in the prior month. Separately, a report showed that the trade deficit fell to the lowest level in seven months. In the services sector, two reports showed sentiment improved more than expected in September.
At the close nine of the 10 sectors of the S&P 500 were in positive territory. Healthcare led the advance, as Mylan (MYL +8.02%) rallied after lifting forward guidance. Energy limited the rally, as the group was flat on the session while WTI crude fell -1.4% to $89.75 per barrel. National Oilwell Varco (NOV -0.93%), but Halliburton (HAL +0.685) climbed.
Treasuries finished the day lower. The benchmark 10-year note fell 3/32 to yield 2.44%.
The CANSLIM.net Featured Stocks Page shows the most action-worthy candidates and their latest notes and a Headline Link directs members to the latest detailed analysis with data-packed graphs annotated by a Certified expert along with links to additional resources. The Premium Member Homepage includes "dynamic archives" to all prior pay reports published.
|
 Kenneth J. Gruneisen started out as a licensed stockbroker in August 1987, a couple of months prior to the historic stock market crash that took the Dow Jones Industrial Average down -22.6% in a single day. He has published daily fact-based fundamental and technical analysis on high-ranked stocks online for two decades. Through FACTBASEDINVESTING.COM, Kenneth provides educational articles, news, market commentary, and other information regarding proven investment systems that work in good times and bad.
Comments contained in the body of this report are technical opinions only and are not necessarily those of Gruneisen Growth Corp. The material herein has been obtained from sources believed to be reliable and accurate, however, its accuracy and completeness cannot be guaranteed. Our firm, employees, and customers may effect transactions, including transactions contrary to any recommendation herein, or have positions in the securities mentioned herein or options with respect thereto. Any recommendation contained in this report may not be suitable for all investors and it is not to be deemed an offer or solicitation on our part with respect to the purchase or sale of any securities. |
|
 |
Financial, Retail, and Tech Gains Led Rebound
Kenneth J. Gruneisen - Passed the CAN SLIM® Master's Exam
A solid gain from the Retail Index ($RLX +1.26%) and gains in financial shares underpinned the major averages' rebound on Friday as the Bank Index ($BKX +1.44%) and the Broker/Dealer Index ($XBD +1.07%) rose. The Biotechnology Index ($BTK +1.58%) led the tech sector while the Networking Index ($NWX +0.24%) and the Semiconductor Index ($SOX +0.56%) posted modest gains. The Gold & Silver Index ($XAU -3.93%) was a standout decliner. Weakness in energy-related shares pushed the Oil Services Index ($OSX -1.03%) lower while the Integrated Oil Index ($XOI -0.15%) held its ground.
Charts courtesy www.stockcharts.com
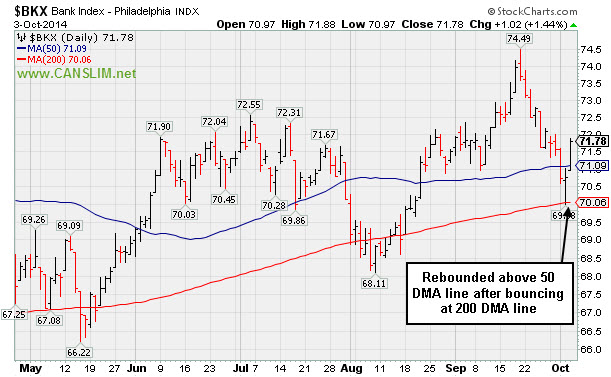
PICTURED 1: The Bank Index ($BKX +1.44%) rebounded above its 50-day moving average (DMA) liner after bouncing at its 200 DMA line.
Charts courtesy www.stockcharts.com
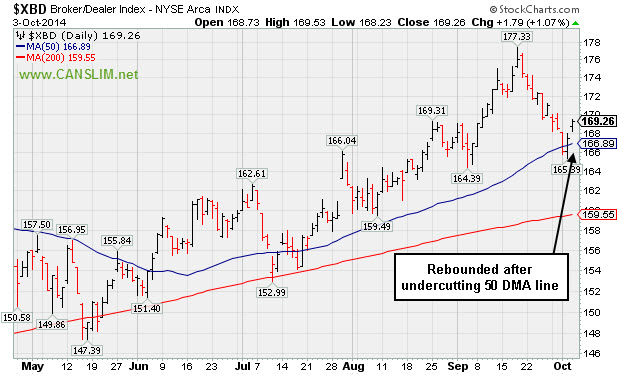
PICTURED 2: The Broker/Dealer Index ($XBD +1.07%) rebounded after undercutting its 50 DMA line.
| Oil Services |
$OSX |
254.59 |
-2.66 |
-1.03% |
-9.41% |
| Integrated Oil |
$XOI |
1,511.74 |
-2.30 |
-0.15% |
+0.57% |
| Semiconductor |
$SOX |
623.12 |
+3.46 |
+0.56% |
+16.46% |
| Networking |
$NWX |
319.70 |
+0.77 |
+0.24% |
-1.31% |
| Broker/Dealer |
$XBD |
169.26 |
+1.79 |
+1.07% |
+5.42% |
| Retail |
$RLX |
938.70 |
+11.64 |
+1.26% |
-0.12% |
| Gold & Silver |
$XAU |
78.42 |
-3.21 |
-3.93% |
-6.81% |
| Bank |
$BKX |
71.78 |
+1.02 |
+1.44% |
+3.64% |
| Biotech |
$BTK |
3,093.05 |
+48.09 |
+1.58% |
+32.72% |
|
|
|
 |
Submit Your Request for a Featured Stock Update
Kenneth J. Gruneisen - Passed the CAN SLIM® Master's Exam
There are few stocks currently included on the Featured Stocks list and none of the companies need additional review in detail with annotated graphs. At times like these we have an opportunity to look back and review previously featured stocks which were dropped. This can serve as an educational review of the investment system's tactics and a reminder that even high-ranked leaders eventually fall out of favor. If you wish to request for a specific stock to receive more detailed coverage in this section please use the inquiry form to submit your request. Thank you! |
|
|
Color Codes Explained :
Y - Better candidates highlighted by our
staff of experts.
G - Previously featured
in past reports as yellow but may no longer be buyable under the
guidelines.
***Last / Change / Volume data in this table is the closing quote data***
Symbol/Exchange
Company Name
Industry Group |
PRICE |
CHANGE
(%Change) |
Day High |
Volume
(% DAV)
(% 50 day avg vol) |
52 Wk Hi
% From Hi |
Featured
Date |
Price
Featured |
Pivot Featured |
|
Max Buy |
ACT
-
NYSE
Actavis plc
Medical-Generic Drugs
|
$246.07
|
+10.07
4.27% |
$246.90
|
4,055,870
176.80% of 50 DAV
50 DAV is 2,294,000
|
$249.94
-1.55%
|
6/20/2014
|
$216.53
|
PP = $230.87
|
|
MB = $242.41
|
 Most Recent Note - 10/3/2014 11:43:35 AM
G - Rallying back above its "max buy" level and its color code is changed to green. Prior highs near $230 define near-term support to watch on pullbacks.
>>> FEATURED STOCK ARTICLE : Finally Volume-backed Gains Confirmed a Technical Buy Signal - 9/19/2014
View all notes |
Set NEW NOTE alert |
CANSLIM.net Company Profile |
SEC
News |
Chart |
Request a new note
C
A N
S L
I M


|
FB
-
NASDAQ
Facebook Inc Cl A
INTERNET
|
$77.44
|
+0.36
0.47% |
$78.06
|
23,281,295
67.00% of 50 DAV
50 DAV is 34,749,000
|
$79.71
-2.84%
|
9/9/2014
|
$76.67
|
PP = $76.84
|
|
MB = $80.68
|
Most Recent Note - 10/1/2014 1:53:21 PM
Y - Pulling back with higher volume today after wedging higher with gains lacking great volume conviction. Its 50 DMA line ($75.41) defines important near term support where a violation would trigger a technical sell signal
>>> FEATURED STOCK ARTICLE : Fell Toward 50-day Moving Average; Recent Gains Lacked Great Volume - 9/25/2014
View all notes |
Set NEW NOTE alert |
CANSLIM.net Company Profile |
SEC
News |
Chart |
Request a new note
C
A N
S L
I M
|
NXPI
-
NASDAQ
Nxp Semiconductors N V
ELECTRONICS - Semiconductor - Broad Line
|
$67.37
|
+1.06
1.60% |
$68.34
|
3,399,488
97.83% of 50 DAV
50 DAV is 3,475,000
|
$73.82
-8.74%
|
8/29/2014
|
$68.50
|
PP = $67.89
|
|
MB = $71.28
|
Most Recent Note - 10/1/2014 1:49:56 PM
Y- Slumping near its 50 DMA line and prior highs in the $67 area defining important support with today's 3rd consecutive loss on ever-increasing volume. Weakening market conditions (M criteria) are prompting investors to reduce exposure in any faltering stocks and avoid new buying efforts until strength returns.
>>> FEATURED STOCK ARTICLE : Consolidating Above Pivot Point and Below "Max Buy" Level - 9/17/2014
View all notes |
Set NEW NOTE alert |
CANSLIM.net Company Profile |
SEC
News |
Chart |
Request a new note
C
A N
S L
I M
|
PANW
-
NYSE
Palo Alto Networks
Computer Sftwr-Security
|
$104.70
|
+6.52
6.64% |
$106.79
|
4,981,621
287.79% of 50 DAV
50 DAV is 1,731,000
|
$102.45
2.20%
|
7/30/2014
|
$84.21
|
PP = $85.88
|
|
MB = $90.17
|
Most Recent Note - 10/3/2014 12:06:56 PM
G - Hit a new 52-week high with above average volume behind today's considerable gap up gain. Held its ground stubbornly while widespread market (M criteria) weakness recently prompted concerns. The recent low ($103.00 on 10/01/14) defines initial support to watch above its 50 DMA line.
>>> FEATURED STOCK ARTICLE : Holding Ground Near Highs After Big Volume-Driven Gains - 9/24/2014
View all notes |
Set NEW NOTE alert |
CANSLIM.net Company Profile |
SEC
News |
Chart |
Request a new note
C
A N
S L
I M
|
STRT
-
NASDAQ
Strattec Security Corp
AUTOMOTIVE - Auto Parts
|
$82.06
|
+0.97
1.20% |
$83.12
|
12,578
54.69% of 50 DAV
50 DAV is 23,000
|
$89.87
-8.69%
|
9/19/2014
|
$86.06
|
PP = $89.97
|
|
MB = $94.47
|
Most Recent Note - 10/1/2014 2:05:31 PM
Y - Still quietly consolidating, however eroding market conditions (M criteria) have raised concerns. Previously noted - "Volume-driven gains above the new pivot point cited may trigger a new (or add-on) technical buy signal. Its 50 DMA line and prior highs define important support to watch on pullbacks."
>>> FEATURED STOCK ARTICLE : Consolidating Above Prior Highs and 50-Day Moving Average Line - 9/26/2014
View all notes |
Set NEW NOTE alert |
CANSLIM.net Company Profile |
SEC
News |
Chart |
Request a new note
C
A N
S L
I M
|
Symbol/Exchange
Company Name
Industry Group |
PRICE |
CHANGE
(%Change) |
Day High |
Volume
(% DAV)
(% 50 day avg vol) |
52 Wk Hi
% From Hi |
Featured
Date |
Price
Featured |
Pivot Featured |
|
Max Buy |
TARO
-
NYSE
Taro Pharmaceutical Inds
DRUGS - Drug Manufacturers - Other
|
$152.93
|
+3.95
2.65% |
$153.44
|
80,519
85.66% of 50 DAV
50 DAV is 94,000
|
$165.30
-7.48%
|
7/30/2014
|
$144.24
|
PP = $149.99
|
|
MB = $157.49
|
Most Recent Note - 10/3/2014 12:17:49 PM
G - Rebounding near its 50 DMA line today. Recent losses raised concerns and triggered a technical sell signal. Repeatedly noted with caution - "Recently reported earnings for the Jun '14 quarter below the +25% minimum earnings guideline (C criteria) raising fundamental concerns."
>>> FEATURED STOCK ARTICLE : Consolidating Above 50-day Moving Average and Prior Highs - 9/23/2014
View all notes |
Set NEW NOTE alert |
CANSLIM.net Company Profile |
SEC
News |
Chart |
Request a new note
C
A N
S L
I M
|
|
|
|
THESE ARE NOT BUY RECOMMENDATIONS!
Comments contained in the body of this report are technical
opinions only. The material herein has been obtained
from sources believed to be reliable and accurate, however,
its accuracy and completeness cannot be guaranteed.
This site is not an investment advisor, hence it does
not endorse or recommend any securities or other investments.
Any recommendation contained in this report may not
be suitable for all investors and it is not to be deemed
an offer or solicitation on our part with respect to
the purchase or sale of any securities. All trademarks,
service marks and trade names appearing in this report
are the property of their respective owners, and are
likewise used for identification purposes only.
This report is a service available
only to active Paid Premium Members.
You may opt-out of receiving report notifications
at any time. Questions or comments may be submitted
by writing to Premium Membership Services 665 S.E. 10 Street, Suite 201 Deerfield Beach, FL 33441-5634 or by calling 1-800-965-8307
or 954-785-1121.
|
|
|

