***Last / Change / Volume data in this table is the closing quote data***
Symbol/Exchange
Company Name
Industry Group |
PRICE |
CHANGE
(%Change) |
Day High |
Volume
(% DAV)
(% 50 day avg vol) |
52 Wk Hi
% From Hi |
Featured
Date |
Price
Featured |
Pivot Featured |
|
Max Buy |
AVG
-
NYSE
A V G Technologies N.V.
INTERNET - Internet Software and Services
|
$23.25
|
-0.85
-3.53% |
$24.12
|
971,027
105.15% of 50 DAV
50 DAV is 923,500
|
$26.56
-12.45%
|
9/13/2013
|
$23.06
|
PP = $23.88
|
|
MB = $25.07
|
 Most Recent Note - 10/3/2013 5:58:41 PM
Y - Color code is changed to yellow while consolidating near prior highs in the $23 area defining support to watch above its 50 DMA line ($22.79 now). Subsequent damaging violations may trigger technical sell signals.
>>> The latest Featured Stock Update with an annotated graph appeared on 9/13/2013. Click here.
View all notes |
Alert me of new notes |
CANSLIM.net Company Profile |
SEC |
Zacks Reports |
StockTalk |
News |
Chart |
Request a new note
C
A N
S L
I M


|
BITA
-
NYSE
Bitauto Hldgs Ltd Ads
INTERNET - Internet Information Providers
|
$19.12
|
-0.10
-0.52% |
$19.93
|
830,848
174.15% of 50 DAV
50 DAV is 477,100
|
$19.60
-2.45%
|
9/24/2013
|
$16.40
|
PP = $17.31
|
|
MB = $18.18
|
Most Recent Note - 10/3/2013 12:20:16 PM
G - Color code is changed to green after getting extended from its prior base and rallying beyond its "max buy" level to new 52-week highs with considerable volume-driven gains. Prior highs in the $18 area define define initial support on pullbacks. See the latest FSU analysis for more details and a new annotated graph.
>>> The latest Featured Stock Update with an annotated graph appeared on 10/2/2013. Click here.
View all notes |
Alert me of new notes |
CANSLIM.net Company Profile |
SEC |
Zacks Reports |
StockTalk |
News |
Chart |
Request a new note
C
A N
S L
I M
|
CELG
-
NASDAQ
Celgene Corp
DRUGS - Drug Manufacturers - Major
|
$152.62
|
-3.31
-2.12% |
$155.95
|
2,798,746
112.08% of 50 DAV
50 DAV is 2,497,200
|
$157.50
-3.10%
|
9/12/2013
|
$149.50
|
PP = $150.02
|
|
MB = $157.52
|
Most Recent Note - 9/30/2013 12:08:55 PM
Y - Hitting another new 52-week high today. Finished strong on Friday with +53% above average volume while rising above its previously cited pivot point confirming a technical buy signal. Its 50 DMA line ($143.44 now) defines near-term support to watch.
>>> The latest Featured Stock Update with an annotated graph appeared on 9/20/2013. Click here.
View all notes |
Alert me of new notes |
CANSLIM.net Company Profile |
SEC |
Zacks Reports |
StockTalk |
News |
Chart |
Request a new note
C
A N
S L
I M
|
EGBN
-
NASDAQ
Eagle Bancorp Inc
BANKING - Regional - Mid-Atlantic Banks
|
$28.08
|
-0.10
-0.35% |
$28.21
|
68,257
91.74% of 50 DAV
50 DAV is 74,400
|
$28.48
-1.40%
|
9/16/2013
|
$27.48
|
PP = $27.77
|
|
MB = $29.16
|
Most Recent Note - 10/1/2013 6:04:28 PM
Y - Inched to new high territory with light volume behind today's 4th consecutive gain. Stubbornly held its ground after a recent spurt of volume-driven gains and it remains below its "max buy" level.
>>> The latest Featured Stock Update with an annotated graph appeared on 9/16/2013. Click here.
View all notes |
Alert me of new notes |
CANSLIM.net Company Profile |
SEC |
Zacks Reports |
StockTalk |
News |
Chart |
Request a new note
C
A N
S L
I M
|
FLT
-
NYSE
Fleetcor Technologies
DIVERSIFIED SERVICES - Business/Management Services
|
$111.15
|
-2.45
-2.16% |
$113.61
|
727,262
111.15% of 50 DAV
50 DAV is 654,300
|
$113.68
-2.23%
|
8/19/2013
|
$99.01
|
PP = $100.97
|
|
MB = $106.02
|
Most Recent Note - 10/3/2013 5:51:30 PM
G - Hovering near all-time highs after wedging higher since completing a Secondary Offering on 9/11/13. Its 50 DMA line defines important near term support to watch on pullbacks. FLT has traded up as much as +59.8% since first featured in yellow in the mid-day report on 3/21/13 (read here).
>>> The latest Featured Stock Update with an annotated graph appeared on 9/6/2013. Click here.
View all notes |
Alert me of new notes |
CANSLIM.net Company Profile |
SEC |
Zacks Reports |
StockTalk |
News |
Chart |
Request a new note
C
A N
S L
I M
|
Symbol/Exchange
Company Name
Industry Group |
PRICE |
CHANGE
(%Change) |
Day High |
Volume
(% DAV)
(% 50 day avg vol) |
52 Wk Hi
% From Hi |
Featured
Date |
Price
Featured |
Pivot Featured |
|
Max Buy |
GNRC
-
NYSE
Generac Hldgs Inc
CONSUMER DURABLES - Electronic Equipment
|
$42.13
|
-0.25
-0.59% |
$42.49
|
550,966
69.24% of 50 DAV
50 DAV is 795,700
|
$44.30
-4.90%
|
9/12/2013
|
$41.40
|
PP = $43.27
|
|
MB = $45.43
|
Most Recent Note - 9/30/2013 11:55:20 AM
Y - Pulling back near its 50 DMA line today. It stalled after triggering a technical buy signal on 9/20/13. Disciplined investors limit losses by selling if any stock falls more than -7% from their purchase price.
>>> The latest Featured Stock Update with an annotated graph appeared on 9/23/2013. Click here.
View all notes |
Alert me of new notes |
CANSLIM.net Company Profile |
SEC |
Zacks Reports |
StockTalk |
News |
Chart |
Request a new note
C
A N
S L
I M
|
JAZZ
-
NASDAQ
Jazz Pharmaceuticals Plc
DRUGS - Biotechnology
|
$89.53
|
-0.75
-0.83% |
$91.37
|
898,130
134.11% of 50 DAV
50 DAV is 669,700
|
$93.84
-4.59%
|
9/30/2013
|
$93.20
|
PP = $89.10
|
|
MB = $93.56
|
Most Recent Note - 9/30/2013 6:04:16 PM
Y- Finished strong today with a solid gain backed by +160% above average volume while rallying above the pivot point cited based its 9/03/13 high plus 10 cents after an advanced "3-weeks tight" base. See the latest FSU analysis for more details and a new annotated graph.
>>> The latest Featured Stock Update with an annotated graph appeared on 9/30/2013. Click here.
View all notes |
Alert me of new notes |
CANSLIM.net Company Profile |
SEC |
Zacks Reports |
StockTalk |
News |
Chart |
Request a new note
C
A N
S L
I M
|
KORS
-
NYSE
Michael Kors Hldgs Ltd
RETAIL - Apparel Stores
|
$74.83
|
-1.06
-1.40% |
$76.97
|
2,466,014
70.91% of 50 DAV
50 DAV is 3,477,500
|
$78.62
-4.82%
|
8/6/2013
|
$69.66
|
PP = $66.28
|
|
MB = $69.59
|
Most Recent Note - 9/27/2013 5:21:05 PM
G - Extended from its prior base and consolidating near its 52-week high. Its 50 DMA line (now $71.33) defines support above prior highs in the $66 area. See the latest FSU analysis for more details and a new annotated graph.
>>> The latest Featured Stock Update with an annotated graph appeared on 9/27/2013. Click here.
View all notes |
Alert me of new notes |
CANSLIM.net Company Profile |
SEC |
Zacks Reports |
StockTalk |
News |
Chart |
Request a new note
C
A N
S L
I M
|
LOPE
-
NASDAQ
Grand Canyon Education
DIVERSIFIED SERVICES - Education and; Training Services
|
$40.05
|
-0.66
-1.62% |
$40.72
|
249,556
64.89% of 50 DAV
50 DAV is 384,600
|
$41.33
-3.10%
|
6/19/2013
|
$31.47
|
PP = $34.17
|
|
MB = $35.88
|
Most Recent Note - 10/3/2013 5:53:22 PM
G - Pulling back from new all-time high with small losses on light or average volume. Fundamental concerns remain while technical action has been reassuring.
>>> The latest Featured Stock Update with an annotated graph appeared on 9/12/2013. Click here.
View all notes |
Alert me of new notes |
CANSLIM.net Company Profile |
SEC |
Zacks Reports |
StockTalk |
News |
Chart |
Request a new note
C
A N
S L
I M
|
MRLN
-
NASDAQ
Marlin Business Services
DIVERSIFIED SERVICES - Rental and Leasing Services
|
$24.38
|
-0.08
-0.33% |
$24.50
|
12,021
33.21% of 50 DAV
50 DAV is 36,200
|
$26.96
-9.57%
|
9/9/2013
|
$23.75
|
PP = $24.03
|
|
MB = $25.23
|
Most Recent Note - 10/2/2013 7:47:19 PM
G - Finished well above the session low today but tallied its 5th consecutive loss with light volume while retreating from its 52-week high. Gains lacked great volume conviction since recently paying a $2.00 per share Special Dividend.
>>> The latest Featured Stock Update with an annotated graph appeared on 9/9/2013. Click here.
View all notes |
Alert me of new notes |
CANSLIM.net Company Profile |
SEC |
Zacks Reports |
StockTalk |
News |
Chart |
Request a new note
C
A N
S L
I M
|
Symbol/Exchange
Company Name
Industry Group |
PRICE |
CHANGE
(%Change) |
Day High |
Volume
(% DAV)
(% 50 day avg vol) |
52 Wk Hi
% From Hi |
Featured
Date |
Price
Featured |
Pivot Featured |
|
Max Buy |
PCLN
-
NASDAQ
Priceline.Com Inc
INTERNET - Internet Software and Services
|
$1,049.31
|
-18.07
-1.69% |
$1,074.89
|
726,517
118.15% of 50 DAV
50 DAV is 614,900
|
$1,073.00
-2.21%
|
9/13/2013
|
$966.82
|
PP = $995.08
|
|
MB = $1,044.83
|
Most Recent Note - 10/2/2013 7:52:26 PM
G - Volume was +92% above average pace today, enough to clinch a technical buy signal while quickly rising beyond its "max buy" level and getting extended from its prior base.
>>> The latest Featured Stock Update with an annotated graph appeared on 9/19/2013. Click here.
View all notes |
Alert me of new notes |
CANSLIM.net Company Profile |
SEC |
Zacks Reports |
StockTalk |
News |
Chart |
Request a new note
C
A N
S L
I M
|
PRAA
-
NASDAQ
Portfolio Recovery Assoc
DIVERSIFIED SERVICES - Business/Management Services
|
$58.86
|
-0.73
-1.23% |
$59.92
|
442,440
86.79% of 50 DAV
50 DAV is 509,800
|
$61.60
-4.45%
|
7/31/2013
|
$51.43
|
PP = $54.72
|
|
MB = $57.46
|
Most Recent Note - 9/27/2013 4:12:31 PM
G - Small gap down today on light volume, pulling back from new 52-week highs after 4 consecutive gains on light volume, wedging higher and getting more extended from its prior base. See the latest FSU analysis for more details and an annotated graph.
>>> The latest Featured Stock Update with an annotated graph appeared on 9/26/2013. Click here.
View all notes |
Alert me of new notes |
CANSLIM.net Company Profile |
SEC |
Zacks Reports |
StockTalk |
News |
Chart |
Request a new note
C
A N
S L
I M
|
PRLB
-
NYSE
Proto Labs Inc
MANUFACTURING - Small Tools and Accessories
|
$77.91
|
-1.76
-2.21% |
$80.05
|
396,686
97.54% of 50 DAV
50 DAV is 406,700
|
$80.66
-3.41%
|
7/29/2013
|
$64.86
|
PP = $67.50
|
|
MB = $70.88
|
Most Recent Note - 10/2/2013 7:44:49 PM
G - Ended at a best-ever close with today's 3rd consecutive gain backed by light volume. Extended from any sound base. Support to watch is at its 50 DMA line.
>>> The latest Featured Stock Update with an annotated graph appeared on 9/25/2013. Click here.
View all notes |
Alert me of new notes |
CANSLIM.net Company Profile |
SEC |
Zacks Reports |
StockTalk |
News |
Chart |
Request a new note
C
A N
S L
I M
|
SFUN
-
NYSE
Soufun Hldgs Ltd Ads A
INTERNET - Internet Information Providers
|
$47.42
|
-4.30
-8.31% |
$53.64
|
3,138,644
286.92% of 50 DAV
50 DAV is 1,093,900
|
$53.77
-11.81%
|
7/16/2013
|
$29.54
|
PP = $27.90
|
|
MB = $29.30
|
Most Recent Note - 10/3/2013 12:45:51 PM
G - Reversed into the red after early gains today challenged its 52-week high. It has not formed a new base of sufficient length. The 50 DMA line and prior highs coincide in the $42 area defining important near-term support to watch on pullbacks.
>>> The latest Featured Stock Update with an annotated graph appeared on 10/1/2013. Click here.
View all notes |
Alert me of new notes |
CANSLIM.net Company Profile |
SEC |
Zacks Reports |
StockTalk |
News |
Chart |
Request a new note
C
A N
S L
I M
|
SSNC
-
NASDAQ
S S & C Technologies
COMPUTER SOFTWARE and SERVICES - Application Software
|
$37.19
|
-0.95
-2.49% |
$38.14
|
452,223
104.85% of 50 DAV
50 DAV is 431,300
|
$39.94
-6.89%
|
9/5/2013
|
$36.01
|
PP = $38.90
|
|
MB = $40.85
|
Most Recent Note - 9/27/2013 5:23:22 PM
Y - Volume totals have been cooling while holding its ground in a tight range near its 52-week high and near the pivot point cited based on its 8/02/13 high plus 10 cents. Completed a Secondary Offering on 9/20/13 while perched at all-time highs.
>>> The latest Featured Stock Update with an annotated graph appeared on 9/5/2013. Click here.
View all notes |
Alert me of new notes |
CANSLIM.net Company Profile |
SEC |
Zacks Reports |
StockTalk |
News |
Chart |
Request a new note
C
A N
S L
I M
|
Symbol/Exchange
Company Name
Industry Group |
PRICE |
CHANGE
(%Change) |
Day High |
Volume
(% DAV)
(% 50 day avg vol) |
52 Wk Hi
% From Hi |
Featured
Date |
Price
Featured |
Pivot Featured |
|
Max Buy |
SSYS
-
NASDAQ
Stratasys Ltd
COMPUTER HARDWARE - Computer Peripherals
|
$99.81
|
-3.69
-3.57% |
$103.81
|
1,062,225
97.08% of 50 DAV
50 DAV is 1,094,200
|
$113.49
-12.05%
|
7/8/2013
|
$91.44
|
PP = $95.00
|
|
MB = $99.75
|
Most Recent Note - 10/3/2013 5:59:50 PM
G - Pulled back today on average but higher volume while testing its 50 DMA line again. Completed a new Public Offering on 9/13/13. It has not formed a sound base.
>>> The latest Featured Stock Update with an annotated graph appeared on 9/10/2013. Click here.
View all notes |
Alert me of new notes |
CANSLIM.net Company Profile |
SEC |
Zacks Reports |
StockTalk |
News |
Chart |
Request a new note
C
A N
S L
I M
|
STMP
-
NASDAQ
Stamps.Com Inc
INTERNET - Internet Software and Services
|
$44.65
|
-1.18
-2.57% |
$46.00
|
80,466
66.89% of 50 DAV
50 DAV is 120,300
|
$46.80
-4.59%
|
9/24/2013
|
$45.54
|
PP = $46.57
|
|
MB = $48.90
|
Most Recent Note - 10/1/2013 6:05:51 PM
Y - Finished at a best-ever close with today's 4th consecutive small gain on light volume. A new pivot point was cited based on its 8/01/13 high plus 10 cents. Recently found encouraging support at its 50 DMA line. Volume-driven gains to new highs may trigger a new (or add-on) technical buy signal.
>>> The latest Featured Stock Update with an annotated graph appeared on 9/24/2013. Click here.
View all notes |
Alert me of new notes |
CANSLIM.net Company Profile |
SEC |
Zacks Reports |
StockTalk |
News |
Chart |
Request a new note
C
A N
S L
I M
|
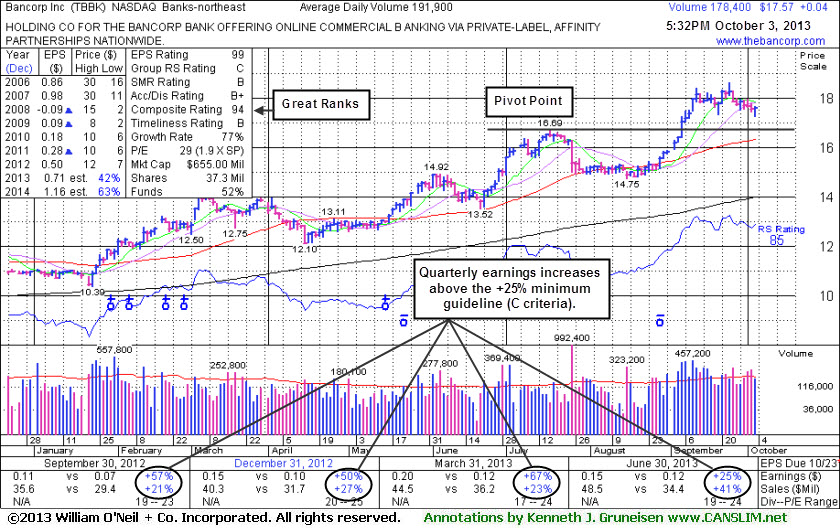
TBBK
-
NASDAQ
Bancorp Inc
BANKING - Regional - Mid-Atlantic Banks
|
$17.57
|
+0.04
0.23% |
$17.66
|
178,448
92.99% of 50 DAV
50 DAV is 191,900
|
$18.61
-5.59%
|
9/4/2013
|
$16.26
|
PP = $16.79
|
|
MB = $17.63
|
Most Recent Note - 10/3/2013 5:54:51 PM
Y - Color code is changed to yellow while consolidating just below its "max buy" level. Prior highs and its 50 DMA line define important support to watch on pullbacks. See the latest FSU analysis for more details and a new annotated graph.
>>> The latest Featured Stock Update with an annotated graph appeared on 10/3/2013. Click here.
View all notes |
Alert me of new notes |
CANSLIM.net Company Profile |
SEC |
Zacks Reports |
StockTalk |
News |
Chart |
Request a new note
C
A N
S L
I M
|
TNGO
-
NASDAQ
Tangoe Inc
COMPUTER SOFTWARE and SERVICES - Technical and System Software
|
$23.65
|
-0.47
-1.95% |
$24.18
|
745,045
134.68% of 50 DAV
50 DAV is 553,200
|
$24.60
-3.85%
|
9/12/2013
|
$21.30
|
PP = $23.15
|
|
MB = $24.31
|
Most Recent Note - 10/3/2013 5:56:06 PM
Y - Pulled back today with above average volume, encountering distributional pressure. Convincing volume-driven gains above its pivot point cited based on its May 2012 high plus 10 cents may signal the beginning of a substantial leg higher.
>>> The latest Featured Stock Update with an annotated graph appeared on 9/17/2013. Click here.
View all notes |
Alert me of new notes |
CANSLIM.net Company Profile |
SEC |
Zacks Reports |
StockTalk |
News |
Chart |
Request a new note
C
A N
S L
I M
|
VRX
-
NYSE
Valeant Pharmaceuticals
DRUGS - Drug Manufacturers - Other
|
$111.40
|
+1.60
1.46% |
$113.79
|
2,856,007
248.26% of 50 DAV
50 DAV is 1,150,400
|
$109.84
1.42%
|
9/11/2013
|
$100.26
|
PP = $105.50
|
|
MB = $110.78
|
Most Recent Note - 10/3/2013 12:58:09 PM
Y- Today's 3rd consecutive gain with ever-increasing and above average volume has it rallying further above the pivot point and trading slightly above its "max buy" level. Gains above the pivot point with volume at least +40% above average are needed to trigger a proper technical buy signal. Recent insider buying while trading near its highs has been noted as an encouraging sign.
>>> The latest Featured Stock Update with an annotated graph appeared on 9/11/2013. Click here.
View all notes |
Alert me of new notes |
CANSLIM.net Company Profile |
SEC |
Zacks Reports |
StockTalk |
News |
Chart |
Request a new note
C
A N
S L
I M
|
Symbol/Exchange
Company Name
Industry Group |
PRICE |
CHANGE
(%Change) |
Day High |
Volume
(% DAV)
(% 50 day avg vol) |
52 Wk Hi
% From Hi |
Featured
Date |
Price
Featured |
Pivot Featured |
|
Max Buy |
YNDX
-
NASDAQ
Yandex N V Class A
INTERNET - Internet Information Providers
|
$38.38
|
+0.63
1.67% |
$39.44
|
3,330,973
142.00% of 50 DAV
50 DAV is 2,345,800
|
$38.10
0.73%
|
9/5/2013
|
$34.24
|
PP = $34.79
|
|
MB = $36.53
|
Most Recent Note - 10/3/2013 1:06:46 PM
G - Hit another new all-time high with today's volume-driven gain, getting more extended from its prior base. Prior highs in the $34 area and its 50 DMA line define support to watch on pullbacks.
>>> The latest Featured Stock Update with an annotated graph appeared on 9/18/2013. Click here.
View all notes |
Alert me of new notes |
CANSLIM.net Company Profile |
SEC |
Zacks Reports |
StockTalk |
News |
Chart |
Request a new note
C
A N
S L
I M
|