You are not logged in.
This means you
CAN ONLY VIEW reports that were published prior to Friday, April 25, 2025.
You
MUST UPGRADE YOUR MEMBERSHIP if you want to see any current reports.
AFTER MARKET UPDATE - MONDAY, OCTOBER 3RD, 2011
Previous After Market Report Next After Market Report >>>
|
|
|
|
DOW |
-258.08 |
10,655.30 |
-2.36% |
|
Volume |
1,403,703,760 |
+6% |
|
Volume |
2,487,166,950 |
+25% |
|
NASDAQ |
-79.57 |
2,335.83 |
-3.29% |
|
Advancers |
285 |
9% |
|
Advancers |
246 |
9% |
|
S&P 500 |
-32.19 |
1,099.23 |
-2.85% |
|
Decliners |
2,799 |
90% |
|
Decliners |
2,388 |
89% |
|
Russell 2000 |
-34.67 |
609.49 |
-5.38% |
|
52 Wk Highs |
15 |
|
|
52 Wk Highs |
4 |
|
|
S&P 600 |
-17.97 |
337.42 |
-5.06% |
|
52 Wk Lows |
835 |
|
|
52 Wk Lows |
643 |
|
|
 |
Major Averages Tumble With Higher Volume and Poor Breadth
Kenneth J. Gruneisen - Passed the CAN SLIM® Master's Exam
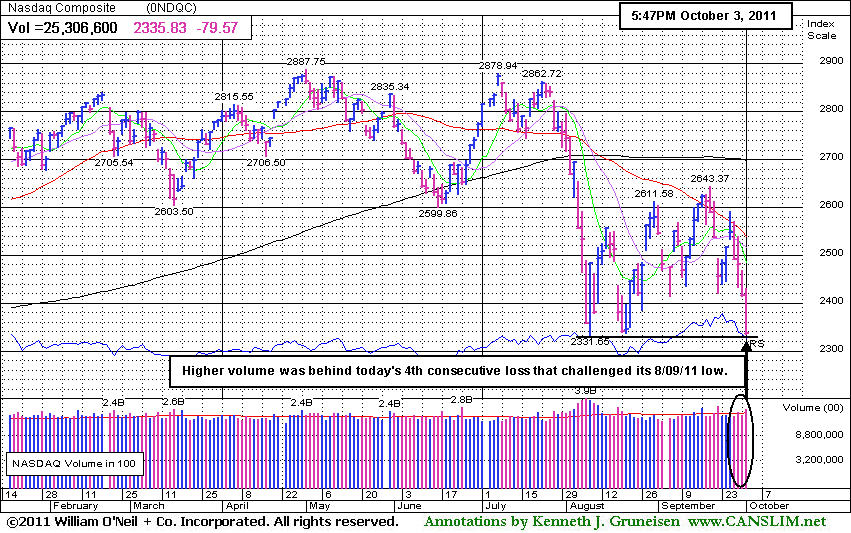
The Dow Jones Industrial Average, S&P 500 Index, and the Nasdaq Composite Index collectively finished at their lowest closes of the year after suffering more damaging losses to kick off October. Monday's session had higher volume totals reported on the NYSE and on the Nasdaq exchange, a clear sign that institutional selling pressure was intensifying. Breadth was very negative as declining issues beat advancers almost 10-1 on the NYSE and on the Nasdaq exchange. The new 52-week lows totals on both the Nasdaq exchange and the NYSE swelled above their recent peaks hit on September 22nd and new lows easily outnumbered new 52-week highs. The new highs total on the Nasdaq exchange remained in the single digits. There was only 1 high-ranked company from the CANSLIM.net Leaders List that made a new 52-week high and appeared on the CANSLIM.net BreakOuts Page, down from 2 on the prior session. There were losses for all but one of the 11 high-ranked companies currently included on the Featured Stocks Page, a list that is quickly shrinking again.
The Dow and Nasdaq had rebounded from early losses after a pair of better-than-expected U.S. economic reports. The September ISM manufacturing index rose to 51.6 from an August reading of 50.6, signaling greater expansion. Analysts were looking for 50.6. August construction spending increased 1.4% from July. Analysts were looking for a decrease. The market's early rebound was short lived, and stocks slumped throughout the afternoon. Meanwhile, Greece said it will miss its deficit targets for 2011 and 2012.
Airline stocks took some of the most dramatic tumbles, led by AMR Corporation (AMR -33.11%), on growing concerns about its balance sheet. Morgan Stanley (MS -7.7%) added to its sharp losses, even though analysts defended the stock amid confusing reports on its European debt exposure. The new General Motors Company (GM -2.2%) said U.S. sales jumped 20% in September, more than expected, but the stock still fell.
The price of oil fell to its lowest level of the year in New York. Treasury 30-year bonds rose as the Federal Reserve bought $2.5 billion of longer-term debt under the program known as Operation Twist. The 10-year Treasury note rallied a full point to yield 1.76%.
The market environment (M criteria) is clearly under pressure and back in a correction after the heavy wave of distributional action. The Q3 2011 Webcast (aired on September 28th) is now available "ON DEMAND" - (CLICK HERE) It provides an informative review of current market conditions, leading groups, and best buy candidates. All upgraded members are eligible to access the webcast presentation at no additional cost! Via the Premium Member Homepage links to all prior reports and webcasts are always available.
PICTURED: The Nasdaq Composite Index had higher volume behind its 4th consecutive loss as it challenged its low hit on 8/09/11.
|
 Kenneth J. Gruneisen started out as a licensed stockbroker in August 1987, a couple of months prior to the historic stock market crash that took the Dow Jones Industrial Average down -22.6% in a single day. He has published daily fact-based fundamental and technical analysis on high-ranked stocks online for two decades. Through FACTBASEDINVESTING.COM, Kenneth provides educational articles, news, market commentary, and other information regarding proven investment systems that work in good times and bad.
Comments contained in the body of this report are technical opinions only and are not necessarily those of Gruneisen Growth Corp. The material herein has been obtained from sources believed to be reliable and accurate, however, its accuracy and completeness cannot be guaranteed. Our firm, employees, and customers may effect transactions, including transactions contrary to any recommendation herein, or have positions in the securities mentioned herein or options with respect thereto. Any recommendation contained in this report may not be suitable for all investors and it is not to be deemed an offer or solicitation on our part with respect to the purchase or sale of any securities. |
|
 |
Financial, Healthcare, Tech, and Energy Shares Led Decliners
Kenneth J. Gruneisen - Passed the CAN SLIM® Master's Exam
The Broker/Dealer Index ($XBD -5.04%) and Bank Index ($BKX -4.81%) were among the weakest groups on Monday. The Healthcare Index ($HMO -5.92%) was also smacked with a large loss. The tech sector saw unanimous losses from the Networking Index ($NWX -5.02%), Biotechnology Index ($BTK -4.69%), Semiconductor Index ($SOX -3.67%), and Internet Index ($IIX -3.24%). Weakness in energy-related areas dragged the Oil Services Index ($OSX -4.32%) and Integrated Oil Index ($XOI -3.55%) lower. The Retail Index ($RLX -2.58%) and Gold & Silver Index ($XAU -1.09%) were among the session's mildest declining groups.
Charts courtesy www.stockcharts.com
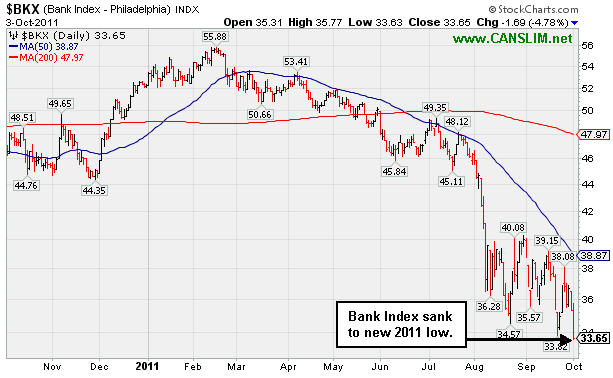
PICTURED 1: The Bank Index ($BKX -4.81%) sank to a new 2011 low.
Charts courtesy www.stockcharts.com
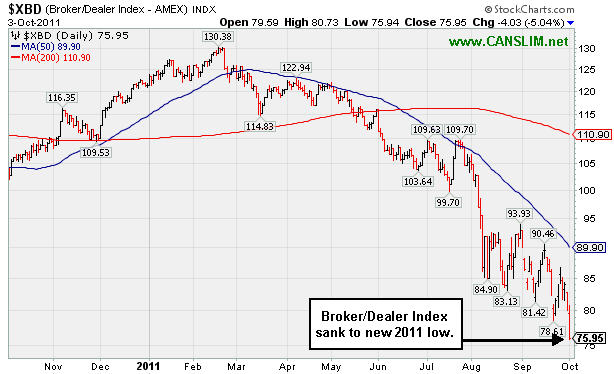
PICTURED 2: The Broker/Dealer Index ($XBD -5.04%) sank to a new 2011 low.
| Oil Services |
$OSX |
182.02 |
-8.21 |
-4.32% |
-25.74% |
| Healthcare |
$HMO |
1,762.10 |
-110.86 |
-5.92% |
+4.14% |
| Integrated Oil |
$XOI |
995.22 |
-36.60 |
-3.55% |
-17.96% |
| Semiconductor |
$SOX |
326.37 |
-12.45 |
-3.67% |
-20.75% |
| Networking |
$NWX |
202.72 |
-10.72 |
-5.02% |
-27.74% |
| Internet |
$IIX |
252.90 |
-8.46 |
-3.24% |
-17.82% |
| Broker/Dealer |
$XBD |
75.95 |
-4.03 |
-5.04% |
-37.49% |
| Retail |
$RLX |
480.19 |
-12.72 |
-2.58% |
-5.55% |
| Gold & Silver |
$XAU |
182.98 |
-2.02 |
-1.09% |
-19.24% |
| Bank |
$BKX |
33.64 |
-1.70 |
-4.81% |
-35.57% |
| Biotech |
$BTK |
1,050.85 |
-51.72 |
-4.69% |
-19.02% |
|
|
|
 |
Failed to Find Support Following Earlier Breakout
Kenneth J. Gruneisen - Passed the CAN SLIM® Master's Exam
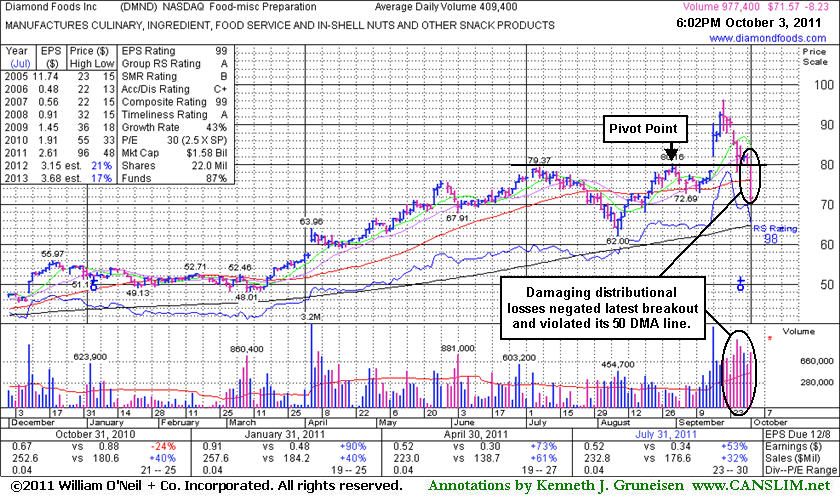
Diamond Foods Inc (DMND -$8.23 or -10.31% to $71.57) violated prior highs in the $80 area previously noted as initial chart support to watch on pullbacks, and also violated its 50-day moving average (DMA) line today raising more serious concerns while triggering technical sell signals and finishing near the session low. Its small supply of only 22 million outstanding shares (S criteria) could contribute to greater volatility in the event of any institutional maneuvering.
Its last appearance in this FSU section was on 9/13/11 with an annotated graph included under the headline, "Set-Up Has Bullish Characteristics Yet Requires Patience" after highlighted in yellow earlier that day in the mid-day report (read here). On 9/16/11 it reported earnings +53% on +32% sales revenues for the quarter ended July 31, 2011 versus the year ago period. On that session a considerable "breakaway gap" with heavy volume cleared its pivot point and triggered a technical buy signal. It tallied additional volume-driven gains, but as quickly as it got extended from its prior base, it soon came falling back. A streak of losses was marked by above average volume indicative of distributional pressure. Its slump back into its prior base has completely negated its latest breakout. Based on weak action it finished -25.5% off its 52-week high, and it will be dropped from the Featured Stocks list tonight. A prompt rebound above its 50 DMA line could help its outlook improve, but it faces resistance due to overhead supply up through the $96 area now. Meanwhile, its 200 DMA line and earlier chart lows in the $62 area define the next nearest support level that may come into play.
|
|
|
Color Codes Explained :
Y - Better candidates highlighted by our
staff of experts.
G - Previously featured
in past reports as yellow but may no longer be buyable under the
guidelines.
***Last / Change / Volume data in this table is the closing quote data***
Symbol/Exchange
Company Name
Industry Group |
PRICE |
CHANGE
(%Change) |
Day High |
Volume
(% DAV)
(% 50 day avg vol) |
52 Wk Hi
% From Hi |
Featured
Date |
Price
Featured |
Pivot Featured |
|
Max Buy |
AAPL
-
NASDAQ
Apple Inc
COMPUTER HARDWARE - Personal Computers
|
$374.60
|
-6.72
-1.76% |
$382.64
|
23,831,838
105.62% of 50 DAV
50 DAV is 22,563,400
|
$422.86
-11.41%
|
9/16/2011
|
$399.14
|
PP = $404.60
|
|
MB = $424.83
|
Most Recent Note - 9/30/2011 6:53:56 PM
G - Loss today with lighter than average volume violated its 50 DMA line raising concerns. Color code is changed to green, meanwhile a prompt rebound above that important chart support level is needed for its outlook to improve.
>>> The latest Featured Stock Update with an annotated graph appeared on 9/19/2011. Click here.
View all notes |
Alert me of new notes |
CANSLIM.net Company Profile |
SEC |
Zacks Reports |
StockTalk |
News |
Chart |
Request a new note
C
A N
S L
I M


|
ALXN
-
NASDAQ
Alexion Pharmaceuticals
DRUGS - Drug Manufacturers - Other
|
$60.87
|
-3.19
-4.98% |
$64.12
|
2,613,628
160.26% of 50 DAV
50 DAV is 1,630,900
|
$68.50
-11.14%
|
9/15/2011
|
$63.20
|
PP = $60.81
|
|
MB = $63.85
|
 Most Recent Note - 10/3/2011 5:14:59 PM
G - Heavier distributional volume was behind its 4th consecutive loss today. Prior resistance in the $59-60 area defines initial support to watch on pullbacks.
>>> The latest Featured Stock Update with an annotated graph appeared on 9/15/2011. Click here.
View all notes |
Alert me of new notes |
CANSLIM.net Company Profile |
SEC |
Zacks Reports |
StockTalk |
News |
Chart |
Request a new note
C
A N
S L
I M
|
ATHN
-
NASDAQ
Athenahealth Inc
DIVERSIFIED SERVICES - Business/Management Services
|
$56.03
|
-3.52
-5.91% |
$62.32
|
800,739
93.45% of 50 DAV
50 DAV is 856,900
|
$72.70
-22.93%
|
9/8/2011
|
$61.93
|
PP = $61.78
|
|
MB = $64.87
|
Most Recent Note - 10/3/2011 5:04:34 PM
Technically it negated its recent breakout last week, and today's violation of its 50 DMA line raised greater concerns and triggered a technical sell signal. Based on weak action it will be dropped from the Featured Stock tonight. Only a prompt rebound above its short-term average could help its outlook.
>>> The latest Featured Stock Update with an annotated graph appeared on 9/29/2011. Click here.
View all notes |
Alert me of new notes |
CANSLIM.net Company Profile |
SEC |
Zacks Reports |
StockTalk |
News |
Chart |
Request a new note
C
A N
S L
I M
|
CELG
-
NASDAQ
Celgene Corp
DRUGS - Drug Manufacturers - Major
|
$60.70
|
-1.21
-1.95% |
$62.41
|
3,704,506
85.32% of 50 DAV
50 DAV is 4,341,900
|
$65.86
-7.83%
|
9/16/2011
|
$61.21
|
PP = $62.59
|
|
MB = $65.72
|
Most Recent Note - 9/30/2011 6:59:44 PM
Y - Down today with a loss on below average volume, slumping further below its pivot point. Following its breakout on 9/20/11 it abruptly pulled back near previously stubborn resistance in the $62 area which has acted as a support level.
>>> The latest Featured Stock Update with an annotated graph appeared on 9/16/2011. Click here.
View all notes |
Alert me of new notes |
CANSLIM.net Company Profile |
SEC |
Zacks Reports |
StockTalk |
News |
Chart |
Request a new note
C
A N
S L
I M
|
DMND
-
NASDAQ
Diamond Foods Inc
FOOD and; BEVERAGE - Processed and; Packaged Goods
|
$71.57
|
-8.23
-10.31% |
$79.75
|
977,790
238.83% of 50 DAV
50 DAV is 409,400
|
$96.13
-25.55%
|
9/13/2011
|
$75.57
|
PP = $80.16
|
|
MB = $84.17
|
Most Recent Note - 10/3/2011 4:57:04 PM
Violated prior highs in the $80 area previously noted as initial chart support to watch on pullbacks, and also violated its 50 DMA line today raising more serious concerns while triggering technical sell signals and finishing near the session low. Based on weak action it will be dropped from the Featured Stocks list tonight.
>>> The latest Featured Stock Update with an annotated graph appeared on 10/3/2011. Click here.
View all notes |
Alert me of new notes |
CANSLIM.net Company Profile |
SEC |
Zacks Reports |
StockTalk |
News |
Chart |
Request a new note
C
A N
S L
I M
|
Symbol/Exchange
Company Name
Industry Group |
PRICE |
CHANGE
(%Change) |
Day High |
Volume
(% DAV)
(% 50 day avg vol) |
52 Wk Hi
% From Hi |
Featured
Date |
Price
Featured |
Pivot Featured |
|
Max Buy |
JAZZ
-
NASDAQ
Jazz Pharmaceuticals Inc
DRUGS - Biotechnology
|
$37.35
|
-4.15
-10.00% |
$42.67
|
1,065,849
110.13% of 50 DAV
50 DAV is 967,800
|
$47.88
-22.00%
|
9/20/2011
|
$46.56
|
PP = $44.63
|
|
MB = $46.86
|
Most Recent Note - 10/3/2011 5:09:51 PM
A damaging loss today with higher (slightly above average) volume indicated distributional pressure as it violated its 50 DMA line triggering a technical sell signal. Based on weak action it will be dropped from the Featured Stocks list tonight. Only a prompt rebound above that short-term average would help its outlook improve.
>>> The latest Featured Stock Update with an annotated graph appeared on 9/20/2011. Click here.
View all notes |
Alert me of new notes |
CANSLIM.net Company Profile |
SEC |
Zacks Reports |
StockTalk |
News |
Chart |
Request a new note
C
A N
S L
I M
|
MA
-
NYSE
Mastercard Inc Cl A
DIVERSIFIED SERVICES - Business/Management Services
|
$310.88
|
-6.28
-1.98% |
$324.00
|
1,436,711
87.94% of 50 DAV
50 DAV is 1,633,800
|
$361.94
-14.11%
|
8/3/2011
|
$324.82
|
PP = $322.38
|
|
MB = $338.50
|
Most Recent Note - 10/3/2011 5:11:08 PM
G - Slumped further below important support at its 50 DMA line today, raising more serious concerns after the violation last week triggered a technical sell signal.
>>> The latest Featured Stock Update with an annotated graph appeared on 9/12/2011. Click here.
View all notes |
Alert me of new notes |
CANSLIM.net Company Profile |
SEC |
Zacks Reports |
StockTalk |
News |
Chart |
Request a new note
C
A N
S L
I M
|
MG
-
NYSE
Mistras Group Inc
DIVERSIFIED SERVICES - Bulding and Faci;ity Management Services
|
$18.00
|
+0.44
2.51% |
$18.26
|
226,869
110.56% of 50 DAV
50 DAV is 205,200
|
$20.82
-13.54%
|
8/10/2011
|
$17.89
|
PP = $17.58
|
|
MB = $18.46
|
Most Recent Note - 10/3/2011 5:12:36 PM
G - Rose toward its 50 DMA line and bucked a mostly negative market, but its short-term average may now act as resistance. See the latest FSU analysis for more details and an new annotated daily graph.
>>> The latest Featured Stock Update with an annotated graph appeared on 9/30/2011. Click here.
View all notes |
Alert me of new notes |
CANSLIM.net Company Profile |
SEC |
Zacks Reports |
StockTalk |
News |
Chart |
Request a new note
C
A N
S L
I M
|
MKTX
-
NASDAQ
Marketaxess Holdings Inc
FINANCIAL SERVICES - Investment Brokerage - Nationa
|
$24.57
|
-1.45
-5.57% |
$26.48
|
320,097
105.92% of 50 DAV
50 DAV is 302,200
|
$30.95
-20.61%
|
7/29/2011
|
$25.87
|
PP = $26.35
|
|
MB = $27.67
|
Most Recent Note - 10/3/2011 5:13:09 PM
Slumped on higher volume today while falling further below its 50 DMA line and under recent support, approaching its 200 DMA line. A rebound above its short-term average is needed to help its outlook. Based on weak action it will be dropped from the Featured Stocks list tonight.
>>> The latest Featured Stock Update with an annotated graph appeared on 9/27/2011. Click here.
View all notes |
Alert me of new notes |
CANSLIM.net Company Profile |
SEC |
Zacks Reports |
StockTalk |
News |
Chart |
Request a new note
C
A N
S L
I M
|
PSMT
-
NASDAQ
Pricesmart Inc
RETAIL - Drug Stores
|
$57.80
|
-4.52
-7.25% |
$62.57
|
462,365
143.68% of 50 DAV
50 DAV is 321,800
|
$75.16
-23.10%
|
8/30/2011
|
$63.01
|
PP = $62.37
|
|
MB = $65.49
|
Most Recent Note - 10/3/2011 5:00:21 PM
Violated prior highs and its 50 DMA line today with a damaging loss backed by above average volume raising greater concerns and triggering technical sell signals. Based on weak action it will be dropped from the Featured Stocks list tonight.
>>> The latest Featured Stock Update with an annotated graph appeared on 9/14/2011. Click here.
View all notes |
Alert me of new notes |
CANSLIM.net Company Profile |
SEC |
Zacks Reports |
StockTalk |
News |
Chart |
Request a new note
C
A N
S L
I M
|
Symbol/Exchange
Company Name
Industry Group |
PRICE |
CHANGE
(%Change) |
Day High |
Volume
(% DAV)
(% 50 day avg vol) |
52 Wk Hi
% From Hi |
Featured
Date |
Price
Featured |
Pivot Featured |
|
Max Buy |
V
-
NYSE
Visa Inc Cl A
DIVERSIFIED SERVICES - Business/Management Services
|
$84.26
|
-1.46
-1.70% |
$86.64
|
6,554,541
107.54% of 50 DAV
50 DAV is 6,095,200
|
$94.75
-11.07%
|
9/20/2011
|
$93.91
|
PP = $90.93
|
|
MB = $95.48
|
Most Recent Note - 9/30/2011 7:48:38 PM
G - Loss today on lighter than average volume violated its 50 DMA line raising concerns. Color code is changed to green, meanwhile a prompt rebound above its short-term average is needed for its outlook to improve. It recently stalled after rallying to a new all-time high.
>>> The latest Featured Stock Update with an annotated graph appeared on 9/21/2011. Click here.
View all notes |
Alert me of new notes |
CANSLIM.net Company Profile |
SEC |
Zacks Reports |
StockTalk |
News |
Chart |
Request a new note
C
A N
S L
I M
|
|
|
|
THESE ARE NOT BUY RECOMMENDATIONS!
Comments contained in the body of this report are technical
opinions only. The material herein has been obtained
from sources believed to be reliable and accurate, however,
its accuracy and completeness cannot be guaranteed.
This site is not an investment advisor, hence it does
not endorse or recommend any securities or other investments.
Any recommendation contained in this report may not
be suitable for all investors and it is not to be deemed
an offer or solicitation on our part with respect to
the purchase or sale of any securities. All trademarks,
service marks and trade names appearing in this report
are the property of their respective owners, and are
likewise used for identification purposes only.
This report is a service available
only to active Paid Premium Members.
You may opt-out of receiving report notifications
at any time. Questions or comments may be submitted
by writing to Premium Membership Services 665 S.E. 10 Street, Suite 201 Deerfield Beach, FL 33441-5634 or by calling 1-800-965-8307
or 954-785-1121.
|
|
|

