You are not logged in.
This means you
CAN ONLY VIEW reports that were published prior to Monday, April 14, 2025.
You
MUST UPGRADE YOUR MEMBERSHIP if you want to see any current reports.
AFTER MARKET UPDATE - FRIDAY, OCTOBER 2ND, 2009
Previous After Market Report Next After Market Report >>>
|
|
|
|
DOW |
-21.61 |
9,487.67 |
-0.23% |
|
Volume |
1,403,524,930 |
-12% |
|
Volume |
2,513,371,720 |
-9% |
|
NASDAQ |
-9.37 |
2,048.11 |
-0.46% |
|
Advancers |
987 |
32% |
|
Advancers |
967 |
34% |
|
S&P 500 |
-4.64 |
1,025.21 |
-0.45% |
|
Decliners |
2,016 |
65% |
|
Decliners |
1,747 |
62% |
|
Russell 2000 |
-3.55 |
580.20 |
-0.61% |
|
52 Wk Highs |
85 |
|
|
52 Wk Highs |
28 |
|
|
S&P 600 |
-2.45 |
305.08 |
-0.80% |
|
52 Wk Lows |
8 |
|
|
52 Wk Lows |
16 |
|
|
 |
Rally Looks Tired As 4th Quarter Begins
Adam Sarhan, Contributing Writer,
The major averages ended lower on Friday, and down for the week, as the fourth quarter officially began. Volume was reported above average but under the prior session's totals which helped the major averages avoid another distribution day. Decliners led advancers by a 2-to-1 ratio on the NYSE and by nearly a 2-to-1 ratio on the Nasdaq exchange. There were only 4 high-ranked companies from the CANSLIM.net Leaders List that made a new 52-week high and appeared on the CANSLIM.net BreakOuts Page, down from the 8 issues that appeared on the prior session. New 52-week highs still outnumbered new 52-week lows on both exchanges.
On Monday, stocks rallied nicely after several multi billion dollar deals were announced. On Tuesday, the major averages negatively reversed (opened higher and closed lower) and suffered a distribution day after the S&P/Case-Shiller home-price index was released. The index, which measures home prices in 20 major metropolitan areas, rose +1.2% in July from the prior month. This was the largest monthly increase in nearly four years but stocks could not rally on the news- a negative divergence. Stocks ended lower as the third quarter ended on Wednesday. The Chicago Purchasing Managers Index was below estimates which sent lower. The Commerce Department revised its reading for the second-quarter gross domestic product. The government said GDP, the broadest measure of the economy, fell to a pace of just +0.7% in the spring. The new reading was better than the annualized -1.1% decline that economists were expecting. Even with the declines the third quarter was the strongest quarterly gain since 1998 for the major averages!
On Thursday, the bears showed up and sent the market lower after the Institute for Supply Management (ISM) said its manufacturing index slid to 52.6 in September which was lower than the reading of 54 projected by economists. This echoed yesterday's weaker than expected Chicago PMI report. The benchmark S&P 500 Index surged nearly +15% in the third quarter which was the strongest quarterly gain in over a decade. The S&P 500 Index rallied a stunning +34% in the past two quarters which is the largest back-to-back quarterly gain since a +42% surge in the first half of 1975. The blue chip Dow Industrial Average vaulted +15% last quarter and advanced +29% since the end of Q1, which is the largest two-quarter rally since 1986!
On Friday, the labor department said US employers slashed 263,000 jobs in September which was fell short of the Street's forecast for a decline of -175,000. The unemployment rate was 9.8% which matched the Street's estimate and was the worst level since June 1983 (when it was -10.1%). Payrolls have declined for the past 21 consecutive months and a total of 7.2 million jobs were shed during that time. Since the start of the recession there are 15.1 million people unemployed which is more than double the number when the recession began. Many people are concerned that unemployment woes will continue which might adversely affect the economic recovery. The International Monetary Fund (IMF) said this week that they believe higher unemployment coupled with the waning effects of the global stimulus package will hinder economic growth for 2010. The IMF believes that the US economy will grow by +1.5% in 2010, after contracting -2.7% in 2009.
From our perspective the current rally is in its 30th week, looking tired, and clearly under pressure since the September 23, 2009 negative reversal. Since then, there have been a flurry of distribution days and a series of leading stocks have been hit. Looking forward, the next area of support is the 7-month upward trendline and 50-day moving average (DMA) line for each of the major averages. If those technical levels are breached, downward momentum could more likely build and be expected to bring even lower prices. That said, raising cash and avoiding a considerable setback is easy, and it is definitely the thing to do if the market conditions continue to erode. Take a look carefully at each of your holdings on a case by case basis, and simply remove the weakest performers first. Never let any losses grow larger than 7-8% without taking action and selling.
PICTURED: The S&P 500 Index's 7-month upward trendline and 10-week moving average line (which tightly tracks the 50-day moving average line) coincide closely as important support levels all chart readers will be watching in the near-term. Deterioration in the market's technical trend would be undeniable if they are decisively violated.
|
|
|
 |
Retail Index Pulls Back To Short Term Average
Kenneth J. Gruneisen - Passed the CAN SLIM® Master's Exam
Widespread weakness on Friday weighed on all industry groups, and defensive areas offered investors no safe haven as the Healthcare Index ($HMO -1.71%) lagged. Commodity-linked areas slid as the Oil Services Index ($OSX -1.57%), Integrated Oil Index ($XOI -0.75%), and Gold & Silver Index ($XAU -0.40%) lost ground. The Networking Index ($NWX -1.37%), Semiconductor Index ($SOX -1.09%), and Internet Index ($IIX -0.93%) lost about -1% each while the Biotechnology Index ($BTK -0.17%) held up better. A loss for the Retail Index ($RLX -0.81%) also was a negative influence weighing on the major averages, meanwhile financial shares were virtually unchanged as the Bank Index ($BKX -0.07%) and Broker/Dealer Index ($XBD -0.03%) essentially ended the session flat.
Charts courtesy www.stockcharts.com
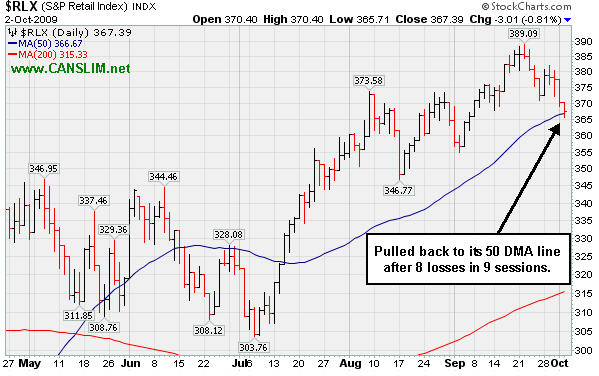
PICTURED: The Retail Index ($RLX -0.81%) has pulled back to its 50-day moving average (DMA) line after 8 losses in 9 sessions.
| Oil Services |
$OSX |
182.80 |
-2.91 |
-1.57% |
+50.59% |
| Healthcare |
$HMO |
1,126.33 |
-19.57 |
-1.71% |
+17.30% |
| Integrated Oil |
$XOI |
989.96 |
-7.46 |
-0.75% |
+1.05% |
| Semiconductor |
$SOX |
306.59 |
-3.38 |
-1.09% |
+44.50% |
| Networking |
$NWX |
224.53 |
-3.12 |
-1.37% |
+56.04% |
| Internet |
$IIX |
211.21 |
-1.99 |
-0.93% |
+57.89% |
| Broker/Dealer |
$XBD |
116.40 |
-0.03 |
-0.03% |
+50.25% |
| Retail |
$RLX |
367.39 |
-3.01 |
-0.81% |
+31.56% |
| Gold & Silver |
$XAU |
157.17 |
-0.63 |
-0.40% |
+26.90% |
| Bank |
$BKX |
44.82 |
-0.03 |
-0.07% |
+1.13% |
| Biotech |
$BTK |
888.90 |
-1.52 |
-0.17% |
+37.35% |
|
|
|
 |
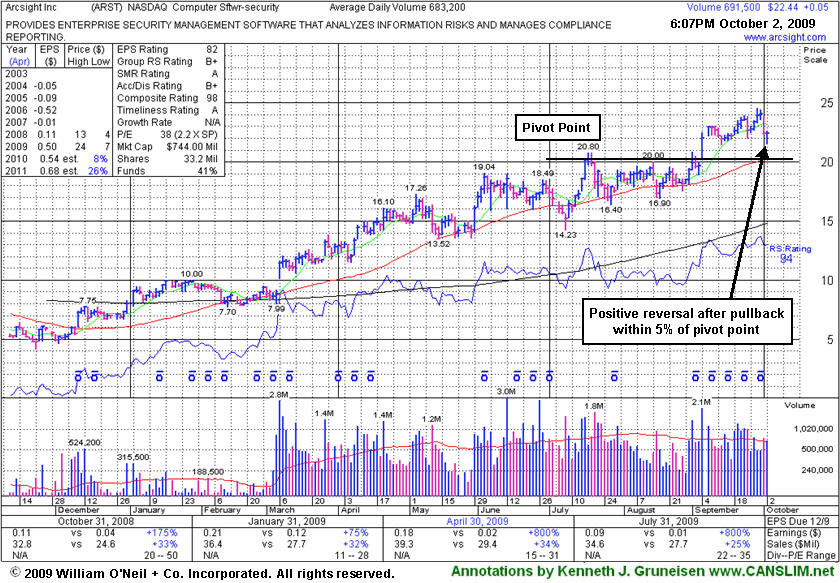
Positive Reversal After Intra-Day Pullback Under Max Buy Level
Kenneth J. Gruneisen - Passed the CAN SLIM® Master's Exam
ArcSight, Inc. (ARST +$0.05 or +0.22% to $22.44) positively reversed after early losses led to a brief intra-day dip under its previously cited "max buy" level. It has stubbornly held its ground near all-time highs after a consideable 5-fold rally from its November '08 low. It also has encountered very little distributional pressure since its latest breakout, and since its last appearance in this FSU section on 9/17/09 under the headline, "Healthy Post-Breakout Action".
Prior chart highs and its 50-day moving average (DMA) line closely coincide now as a very important support level to watch on pullbacks. Deterioration back into its prior base and under the 50 DMA line would raise concerns and trigger technical sell signals. Remember, disciplined investors avoid chasing stocks more than +5% above their pivot point, and always limit losses by selling whenever any stock falls 7-8% from their buy price. ARST was first featured in yellow at $19.91 in the 9/01/09 mid-day report with an annotated daily graph (read here) and it was also featured with more detailed analysis in the September 2009 CANSLIM.net News with an annotated weekly graph (read here).
|
|
|
Color Codes Explained :
Y - Better candidates highlighted by our
staff of experts.
G - Previously featured
in past reports as yellow but may no longer be buyable under the
guidelines.
***Last / Change / Volume quote data in this table corresponds with the timestamp on the note***
Symbol/Exchange
Company Name
Industry Group |
Last |
Chg. |
Vol
% DAV |
Date Featured |
Price Featured |
Latest Pivot Point
Featured |
Status |
| Latest Max Buy Price |
ARO
- NYSE
Aeropostale Inc
RETAIL - Apparel Stores
|
$41.89
|
-0.13
|
1,284,175
48% DAV
2,688,100
|
8/21/2009
(Date
Featured) |
$39.21
(Price
Featured) |
PP = $38.84 |
G |
| MB = $40.78 |
Most Recent Note - 10/2/2009 4:08:47 PM
G - This high-ranked leader in the Retail - Clothing/shoe group is consolidating above support at its 50 DMA line, with the next support to watch at prior highs in the $38 area. It was featured in yellow in the 8/21/09 Mid-Day BreakOuts Report (read here).
>>> The latest Featured Stock Update with an annotated graph appeared on 9/18/2009. click here.
|
|
C
A
S
I |
News |
Chart |
SEC
View all notes Alert
me of new notes
Company
Profile
|
ARST
-
|
$22.44
|
+0.05
|
690,838
101% DAV
683,200
|
9/1/2009
(Date
Featured) |
$19.91
(Price
Featured) |
PP = $20.90 |
G |
| MB = $21.95 |
Most Recent Note - 10/2/2009 4:15:08 PM
G - Traded down near 4-week lows and then positively reversed and closed near the session high today amid widespread market weakness. As previously noted, "Recent lows may be considered an initial support level. Prior chart highs and its 50 DMA line, coinciding in the $20 area, define an important technical support level to watch on pullbacks."
>>> The latest Featured Stock Update with an annotated graph appeared on 10/2/2009. click here.
|
|
C
A
S
I |
News |
Chart |
SEC
View all notes Alert
me of new notes
Company
Profile
|
BIDU
- NASDAQ
Baidu Inc Ads
INTERNET - Internet Information Providers
|
$375.21
|
+3.19
|
1,423,573
82% DAV
1,736,800
|
9/8/2009
(Date
Featured) |
$351.80
(Price
Featured) |
PP = $368.59 |
Y |
| MB = $387.02 |
Most Recent Note - 10/2/2009 4:19:49 PM
Y - Positively reversed today while consolidating near prior chart highs and sinking near its 50 DMA line after distributional pressure in recent weeks. Color code was changed to yellow, yet deteriorating market conditions (the M criteria) give cause for great caution. BIDU was featured in yellow in the 9/08/09 Mid-Day BreakOuts Report (read here).
>>> The latest Featured Stock Update with an annotated graph appeared on 9/21/2009. click here.
|
|
C
A
S
I |
News |
Chart |
SEC
View all notes Alert
me of new notes
Company
Profile
|
CACC
- NASDAQ
Credit Acceptance Corp
FINANCIAL SERVICES - Credit Services
|
$32.20
|
+1.24
|
60,381
145% DAV
41,500
|
9/29/2009
(Date
Featured) |
$33.48
(Price
Featured) |
PP = $32.60 |
Y |
| MB = $34.23 |
Most Recent Note - 10/2/2009 4:26:28 PM
Y - Gain today on above average volume helped it promptly rally back above August's high closes. That helped it finish the week in better shape after a dose of distributional pressure followed its 9/29/09 breakout from a 6-week base. The Finance - Consumer/Commercial Loans firm has maintained a great track record of annual and quarterly sales revenues and earnings increases. It was featured on 9/29/09 in yellow in the mid-day report (read here).
>>> The latest Featured Stock Update with an annotated graph appeared on 9/29/2009. click here.
|
|
C
A
S
I |
News |
Chart |
SEC
View all notes Alert
me of new notes
Company
Profile
|
CRM
- NYSE
Salesforce.com Inc
INTERNET - Internet Software & Services
|
$54.51
|
-0.04
|
1,358,307
65% DAV
2,079,500
|
8/16/2009
(Date
Featured) |
$47.12
(Price
Featured) |
PP = $45.59 |
G |
| MB = $47.87 |
Most Recent Note - 10/2/2009 4:28:01 PM
G - After wedging higher in recent weeks, today's 4th consecutive loss on light volume leaves it near prior highs in the $55 area, an intial support level. More substantial technical support to watch is at its upward trendline and 50 DMA line now coinciding in the $51 area.
>>> The latest Featured Stock Update with an annotated graph appeared on 9/15/2009. click here.
|
|
C
A
S
I |
News |
Chart |
SEC
View all notes Alert
me of new notes
Company
Profile
|
EBIX
- NASDAQ
Ebix Inc
COMPUTER SOFTWARE & SERVICES - Business Software & Services
|
$52.91
|
+0.44
|
388,886
234% DAV
166,200
|
8/28/2009
(Date
Featured) |
$45.86
(Price
Featured) |
PP = $45.35 |
G |
| MB = $47.62 |
Most Recent Note - 10/2/2009 4:35:47 PM
G - Repaired a considerable early loss today as it positively reversed and closed near its session high, closing out a week of big gains on heavy volume. It has not formed a new sound base since heavy distributional pressure led to a pullback near support at early-August chart highs and its 50 DMA line in the $45 area.
>>> The latest Featured Stock Update with an annotated graph appeared on 9/24/2009. click here.
|
|
C
A
S
I |
News |
Chart |
SEC
View all notes Alert
me of new notes
Company
Profile
|
GMCR
- NASDAQ
Green Mtn Coffee Roastrs
FOOD & BEVERAGE - Processed & Packaged Goods
|
$69.56
|
-1.24
|
1,339,346
89% DAV
1,504,400
|
7/17/2009
(Date
Featured) |
$60.15
(Price
Featured) |
PP = $63.79 |
G |
| MB = $66.98 |
Most Recent Note - 10/2/2009 4:56:13 PM
G - Loss today on light volume, closing just under its July-September high closes in the $70 area, possibly forming a high handle.
>>> The latest Featured Stock Update with an annotated graph appeared on 9/23/2009. click here.
|
|
C
A
S
I |
News |
Chart |
SEC
View all notes Alert
me of new notes
Company
Profile
|
NTES
- NASDAQ
Netease Inc Adr
INTERNET - Internet Information Providers
|
$43.94
|
-0.84
|
1,363,180
68% DAV
1,997,000
|
9/23/2009
(Date
Featured) |
$47.11
(Price
Featured) |
PP = $47.04 |
G |
| MB = $49.39 |
Most Recent Note - 10/2/2009 4:57:18 PM
G- Quietly consolidating just above important support at its 50 DMA line and upward trendline. Deterioration below those levels would raise more serious concerns and trigger technical sell signals. Color code was changed to green based on promptly negating its latest breakout and then trading more than -7% below its pivot point. This may also be considered a riskier late-stage base.
>>> The latest Featured Stock Update with an annotated graph appeared on 9/25/2009. click here.
|
|
C
A
S
I |
News |
Chart |
SEC
View all notes Alert
me of new notes
Company
Profile
|
NVEC
- NASDAQ
N V E Corp
ELECTRONICS - Semiconductor - Specialized
|
$50.15
|
-0.59
|
76,610
82% DAV
93,500
|
8/26/2009
(Date
Featured) |
$55.32
(Price
Featured) |
PP = $57.60 |
G |
| MB = $60.48 |
Most Recent Note - 10/2/2009 5:02:31 PM
G - Today was its 4th consecutive loss on light volume, slumping further below its 50 DMA line, near prior chart lows in the $49 area. Further deterioration, especially if on heavy volume, may negate its 7/23/09 breakaway gap and raise serious concerns, triggering a more worrisome technical sell signal.
>>> The latest Featured Stock Update with an annotated graph appeared on 9/30/2009. click here.
|
|
C
A
S
I |
News |
Chart |
SEC
View all notes Alert
me of new notes
Company
Profile
|
PEGA
- NASDAQ
Pegasystems Inc
COMPUTER SOFTWARE & SERVICES - Business Software & Services
|
$32.00
|
-0.68
|
441,828
112% DAV
396,200
|
9/9/2009
(Date
Featured) |
$31.14
(Price
Featured) |
PP = $33.35 |
Y |
| MB = $35.02 |
Most Recent Note - 10/2/2009 5:06:54 PM
Y - This high-ranked Computer Software - Financial firm gapped down today and traded under its 50 DMA line, then found prompt support and rallied to close near the session high for a loss on average volume. However it raised some concerns as it violated an upward trendline connecting its July-September chart lows, an initial support level.
>>> The latest Featured Stock Update with an annotated graph appeared on 9/22/2009. click here.
|
|
C
A
S
I |
News |
Chart |
SEC
View all notes Alert
me of new notes
Company
Profile
|
SWI
- NYSE
Solarwinds Inc
COMPUTER SOFTWARE & SERVICES - Application Software
|
$20.54
|
-0.89
|
371,427
74% DAV
502,600
|
9/30/2029
(Date
Featured) |
$22.03
(Price
Featured) |
PP = $21.72 |
Y |
| MB = $22.81 |
Most Recent Note - 10/2/2009 5:10:15 PM
Y - Gapped down today for a 4th consecutive loss on light volume and closed under its 8/04/09 high close of $21.35, technically negating its latest breakout. It was featured in the October 2009 issue of CANSLIM.net News (read here).
>>> The latest Featured Stock Update with an annotated graph appeared on 9/30/2009. click here.
|
|
C
A
S
I |
News |
Chart |
SEC
View all notes Alert
me of new notes
Company
Profile
|
WNS
- NYSE
W N S Holdings Ltd Ads
DIVERSIFIED SERVICES - Business/Management Services
|
$15.75
|
-0.07
|
108,721
224% DAV
48,500
|
9/28/2009
(Date
Featured) |
$15.28
(Price
Featured) |
PP = $16.10 |
Y |
| MB = $16.91 |
Most Recent Note - 10/2/2009 5:12:36 PM
Y - Small loss on high volume today exemplified the "churning" and lack of meaningful price progress (chart-wise) in recent weeks - action indicative of distributional pressure. Still perched above its 50 DMA line and stubbornly holding its ground, it traded up as high as $16.50 on two sessions this week but encountered stubborn resistance after a considerable 9/29/09 gain for a new 52-week high and new high close with volume 11 times its daily average volume. It formed an orderly flat base for at least 5-weeks, and it was featured in yellow in the 9/28/09 mid-day report (read here). Quarterly earnings have been above the +25% guideline and its annual earnings history has been great, satisfying the C & A criteria. However, sales revenues growth has decelerated.
>>> The latest Featured Stock Update with an annotated graph appeared on 9/28/2009. click here.
|
|
C
A
S
I |
News |
Chart |
SEC
View all notes Alert
me of new notes
Company
Profile
|
|
|
|
THESE ARE NOT BUY RECOMMENDATIONS!
Comments contained in the body of this report are technical
opinions only. The material herein has been obtained
from sources believed to be reliable and accurate, however,
its accuracy and completeness cannot be guaranteed.
This site is not an investment advisor, hence it does
not endorse or recommend any securities or other investments.
Any recommendation contained in this report may not
be suitable for all investors and it is not to be deemed
an offer or solicitation on our part with respect to
the purchase or sale of any securities. All trademarks,
service marks and trade names appearing in this report
are the property of their respective owners, and are
likewise used for identification purposes only.
This report is a service available
only to active Paid Premium Members.
You may opt-out of receiving report notifications
at any time. Questions or comments may be submitted
by writing to Premium Membership Services 665 S.E. 10 Street, Suite 201 Deerfield Beach, FL 33441-5634 or by calling 1-800-965-8307
or 954-785-1121.
|
|
|


