You are not logged in.
This means you
CAN ONLY VIEW reports that were published prior to Tuesday, February 27, 2024.
You
MUST UPGRADE YOUR MEMBERSHIP if you want to see any current reports.
AFTER MARKET UPDATE - THURSDAY, OCTOBER 1ST, 2020
Previous After Market Report Next After Market Report >>>
|
|
|
|
DOW |
+35.20 |
27,816.90 |
+0.13% |
|
Volume |
859,127,785 |
-32% |
|
Volume |
3,952,224,600 |
-6% |
|
NASDAQ |
+159.90 |
11,327.40 |
+1.43% |
|
Advancers |
2,039 |
69% |
|
Advancers |
2,212 |
66% |
|
S&P 500 |
+17.80 |
3,380.80 |
+0.53% |
|
Decliners |
933 |
31% |
|
Decliners |
1,142 |
34% |
|
Russell 2000 |
+23.51 |
1,531.20 |
+1.56% |
|
52 Wk Highs |
78 |
|
|
52 Wk Highs |
93 |
|
|
S&P 600 |
+12.20 |
867.47 |
+1.43% |
|
52 Wk Lows |
22 |
|
|
52 Wk Lows |
39 |
|
|
The major indices have shown improvement and have resumed a market uptrend as leadership has improved. Disciplined investors carefully may buy leading stocks on a case-by-case basis. Always remain ready to reduce market exposure in the event of any more substantial market downdrafts.
|
 |
Tech Heavy Nasdaq Leads Major Indices Higher
Kenneth J. Gruneisen - Passed the CAN SLIM® Master's Exam
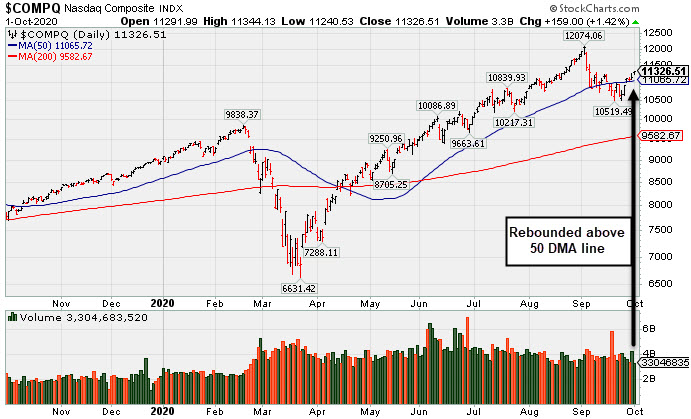
The Dow added 35 points, paring an early session gain of as much as 250 points as hopes of a bipartisan stimulus bill dwindled. The S&P 500 rose 0.5%, building on to its best back-to-back quarterly performance since 2009. The Nasdaq Composite climbed 1.4% on strength in Tech and related shares. Thursday's reported volume totals were lighter than the prior session on the NYSE and on the Nasdaq exchange. Breadth was positive as advancers led decliners by a 2-1 margin on the NYSE and nearly 2-1 on the Nasdaq exchange. Leadership improved as 43 high-ranked companies from the Leaders List that hit new 52-week highs and were listed on the BreakOuts Page, versus the total of 35 on the prior session. New 52-week highs outnumbered new 52-week lows totals on the NYSE and on the Nasdaq exchange. The major indices appear to have avoided a more serious market correction and have shifted back to a confirmed uptrend (M criteria). New buying efforts may be justified in leading stocks on a case-by-case basis.
PICTURED: The Nasdaq Composite Index rebounded further above its 50-day moving average (DMA) line on Thursday. Recent technical improvement was coupled with an expansion in leadership (stocks hitting new 52-week highs). Wednesday's session was considered a sufficient follow-through day by the Dow Jones Industrial Average to shift the market direction (M criteria) back to a confirmed uptrend.
Stocks finished higher on Thursday, as investors digested another data deluge and eyed fiscal stimulus negotiations in Washington. The White House reportedly boosted the size of its coronavirus relief offer to $1.6 trillion, but key issues are still preventing a compromise with Democratic lawmakers’ proposed $2.2 trillion package.
On the data front, the Institute for Supply Management’s (ISM) gauge of manufacturing activity showed the pace of sector expansion unexpectedly slowed in September. Separately, personal spending increased 1% in August, though personal income declined more than expected, down 2.7% during the same period. Additionally, initial jobless claims came in at 837,000 in the latest week, easing from the prior 873,000 figure. Treasuries were little changed, with the yield on the 10-year note steady at 0.68%.
Seven of 11 S&P 500 sectors ended in positive territory with the Consumer Discretionary group outperforming. Amazon (AMZN +2.30%) rose after being the subject of a Wall Street analyst price target increase. In earnings, Bed Bath & Beyond (BBBY +25.17%) surged following a surprise profit tally. Energy shares lagged amid a drop in oil prices. WTI crude slumped nearly 4%, closing below its 100-day moving average (a closely watched technical level) for the first time since June amid oversupply worries. |
 Kenneth J. Gruneisen started out as a licensed stockbroker in August 1987, a couple of months prior to the historic stock market crash that took the Dow Jones Industrial Average down -22.6% in a single day. He has published daily fact-based fundamental and technical analysis on high-ranked stocks online for two decades. Through FACTBASEDINVESTING.COM, Kenneth provides educational articles, news, market commentary, and other information regarding proven investment systems that work in good times and bad.
Comments contained in the body of this report are technical opinions only and are not necessarily those of Gruneisen Growth Corp. The material herein has been obtained from sources believed to be reliable and accurate, however, its accuracy and completeness cannot be guaranteed. Our firm, employees, and customers may effect transactions, including transactions contrary to any recommendation herein, or have positions in the securities mentioned herein or options with respect thereto. Any recommendation contained in this report may not be suitable for all investors and it is not to be deemed an offer or solicitation on our part with respect to the purchase or sale of any securities. |
|
 |
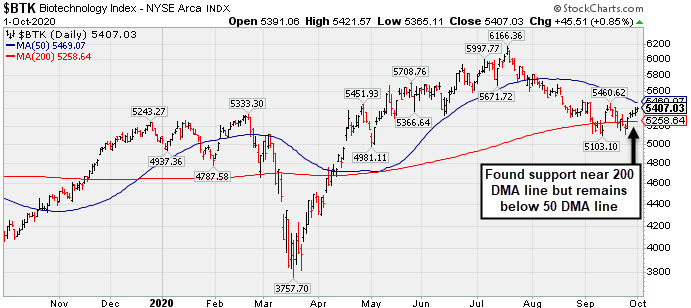
Retail, Financial, Tech, and Gold & Silver Indexes Rose
Kenneth J. Gruneisen - Passed the CAN SLIM® Master's Exam
The Retail Index ($RLX +1.71%) posted a big gain that had a positive influence on the major indices while the Broker/Dealer Index ($XBD +0.77%) and Bank Index ($BKX +0.29%) each posted smaller gains. The Semiconductor Index ($SOX +2.11%) led the tech sector higher while the Biotech Index ($BTK +0.85%) and the Networking Index ($NWX +0.55%) also rose. Commodity-linked groups were mixed as the Oil Services Index ($OSX -2.63%) and Integrated Oil Index ($XOI -3.21%) both lost ground, yet the Gold & Silver Index ($XAU +1.02%) posted a gain. PICTURED: The Biotech Index ($BTK +0.85%) found support near its 200-day moving average (DMA) line but remains below its 50 DMA line.
| Oil Services |
$OSX |
27.11 |
-0.73 |
-2.63% |
-65.38% |
| Integrated Oil |
$XOI |
588.73 |
-19.50 |
-3.21% |
-53.66% |
| Semiconductor |
$SOX |
2,291.53 |
+47.40 |
+2.11% |
+23.89% |
| Networking |
$NWX |
536.19 |
+2.91 |
+0.55% |
-8.09% |
| Broker/Dealer |
$XBD |
281.60 |
+2.15 |
+0.77% |
-3.02% |
| Retail |
$RLX |
3,462.71 |
+58.19 |
+1.71% |
+41.38% |
| Gold & Silver |
$XAU |
144.55 |
+1.46 |
+1.02% |
+35.19% |
| Bank |
$BKX |
73.30 |
+0.21 |
+0.29% |
-35.33% |
| Biotech |
$BTK |
5,407.03 |
+45.51 |
+0.85% |
+6.70% |
|
|
|
 |
New Base Formed by Strong Homebuilder
Kenneth J. Gruneisen - Passed the CAN SLIM® Master's Exam
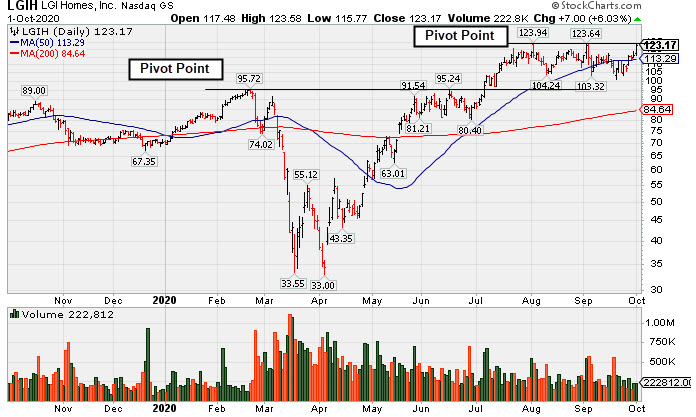
L G I Homes Inc (LGIH +$7.00 or +6.03% to $123.17) rallied for a best ever close today with a big gain on below average volume. The recent rebound above the 50-day moving average (DMA) line ($113.29) helped its outlook to improve. Its color code was changed to yellow with a new pivot point cited based on its 8/04/20 high plus 10 cents. Subsequent gains above the pivot point backed by at least +40% above average volume may trigger a new (or add-on) technical buy signal. Any losses below the latest low ($101.30 on 9/21/20) would raise greater concerns and trigger a worrisome technical sell signal.
It still has the highest possible earnings Per Share Rating of 99. However, not long ago the company reported Jun '20 quarterly earnings +21% on +4% sales revenues versus the year ago period, breaking a streak of 4 comparisons above the +25% minimum guideline (C criteria). LGIH traded up as much as +21.5% since highlighted in yellow with pivot point cited based on its 2/21/20 high plus 10 cents in the 7/07/20 mid-day report (read here). It was last shown in this FSU section on 9/18/20 under the headline, "Violation of 50-Day Average on Volume Triggered Technical Sell Signal". Its annual earnings (A criteria) history has been strong. The Building - Residential / Commercial Group Relative Strength Rating is now A+ (97). In recent weeks there has been greater leadership (L criteria) noted in the industry group. It has a small supply (S criteria) of only 22.1 million shares in the public float (S criteria). The number of top-rated funds owning its shares rose from 372 in Dec '19 to 389 in Jun '20, and its current Up/Down Volume Ratio of 0.9 is an unbiased indication its shares have been under slight distributional pressure over the past 50 days. It has a Timeliness Rating of A and a Sponsorship Rating of D. LGIH completed its IPO at $11 on 11/07/13. Charts courtesy www.stockcharts.com
 |
|
|
Color Codes Explained :
Y - Better candidates highlighted by our
staff of experts.
G - Previously featured
in past reports as yellow but may no longer be buyable under the
guidelines.
***Last / Change / Volume data in this table is the closing quote data***
Symbol/Exchange
Company Name
Industry Group |
PRICE |
CHANGE
(%Change) |
Day High |
Volume
(% DAV)
(% 50 day avg vol) |
52 Wk Hi
% From Hi |
Featured
Date |
Price
Featured |
Pivot Featured |
|
Max Buy |
 ADBE
-
NASDAQ
ADBE
-
NASDAQ
Adobe Inc
COMPUTER SOFTWARE and SERVICES - Application Software
|
$499.51
|
+9.08
1.85% |
$501.50
|
2,240,391
73.22% of 50 DAV
50 DAV is 3,060,000
|
$536.88
-6.96%
|
9/10/2020
|
$488.46
|
PP = $536.88
|
|
MB = $563.72
|
 Most Recent Note - 10/1/2020 5:53:34 PM
G - Posted a 5th consecutive gain today with light volume since finding prompt support near its 50 DMA line ($472). Faces near-term resistance due to overhead supply up to the $536 level. Fundamentals remain strong.
>>> FEATURED STOCK ARTICLE : Light Volume Loss Falling Near 50-Day Moving Average Line Again - 9/23/2020 |
View all notes |
Set NEW NOTE alert |
Company Profile |
SEC
News |
Chart |
Request a new note
C
A
S
I |
CRL
-
NYSE
Charles River Labs Intl
DRUGS - Biotechnology
|
$230.46
|
+4.01
1.77% |
$230.64
|
412,237
130.04% of 50 DAV
50 DAV is 317,000
|
$228.86
0.70%
|
7/15/2020
|
$192.66
|
PP = $189.95
|
|
MB = $199.45
|
Most Recent Note - 10/1/2020 5:56:40 PM
G - Posted a solid gain with +30% above average volume today for a new all-time high. Found prompt support at its 50 DMA line ($214) where any subsequent violation would raise concerns and trigger a technical sell signal. Raised fundamental concerns when it recently reported Jun '20 quarterly earnings -3% on +4% sales revenues, below the +25% minimum guideline (C criteria).
>>> FEATURED STOCK ARTICLE : Showed Resilience When Testing 50-Day Moving Average Line Again - 9/24/2020 |
View all notes |
Set NEW NOTE alert |
Company Profile |
SEC
News |
Chart |
Request a new note
C
A
S
I |
AMD
-
NASDAQ
Advanced Micro Devices
ELECTRONICS - Semiconductor - Broad Line
|
$84.86
|
+2.87
3.50% |
$85.25
|
52,024,659
78.27% of 50 DAV
50 DAV is 66,471,000
|
$94.28
-9.99%
|
8/31/2020
|
$90.42
|
PP = $87.39
|
|
MB = $91.76
|
Most Recent Note - 10/1/2020 5:55:03 PM
G - Rebounded further above its 50 DMA line ($80.19) with today's 6th consecutive gain on near average or lighter than average volume. Any losses below the 50 DMA line and below the recent low ($73.85 on 9/18/20) would raise greater concerns and trigger more worrisome technical sell signals. Faces near-term resistance due to overhead supply up to the $94 level. Fundamentals remain strong.
>>> FEATURED STOCK ARTICLE : Rebound Above 50-Day Average With Light Volume Helped Stance - 9/28/2020 |
View all notes |
Set NEW NOTE alert |
Company Profile |
SEC
News |
Chart |
Request a new note
C
A
S
I |
TREX
-
NYSE
Trex Company Inc
MATERIALS and CONSTRUCTION - General Building Materials
|
$73.45
|
+1.85
2.58% |
$73.62
|
482,510
49.04% of 50 DAV
50 DAV is 984,000
|
$78.32
-6.22%
|
6/26/2020
|
$54.53
|
PP = $66.47
|
|
MB = $69.79
|
Most Recent Note - 10/1/2020 6:01:02 PM
G - Recently rebounding well above its 50 DMA line ($70.61) helping its outlook to improve, but again lighter than average volume was behind today's gain. Any losses below the 50 DMA line or recent low ($63.32 on 9/21/20) would raise concerns and trigger technical sell signals. Do not be confused by the 2:1 share split effective 9/15/20 (Featured Price, Pivot Point, and Max Buy prices have been adjusted accordingly). Fundamentals remain strong. See the latest FSU analysis for more details and an annotated graph.
>>> FEATURED STOCK ARTICLE : TREX Rebounded Above 50-Day Moving Average - 9/30/2020 |
View all notes |
Set NEW NOTE alert |
Company Profile |
SEC
News |
Chart |
Request a new note
C
A
S
I |
NFLX
-
NASDAQ
Netflix Inc
SPECIALTY RETAIL - Music and Video Stores
|
$527.51
|
+27.48
5.50% |
$529.55
|
8,070,694
138.91% of 50 DAV
50 DAV is 5,810,000
|
$575.37
-8.32%
|
9/1/2020
|
$547.45
|
PP = $575.47
|
|
MB = $604.24
|
Most Recent Note - 10/1/2020 5:51:22 PM
G - Higher volume was behind today's big 6th consecutive gain, rebounding well above its 50 DMA line ($496) and helping its outlook to improve. Faces near-term resistance at prior highs. The recent low ($458.60 on 9/18/20) defines important near term support where any further deterioration would raise more serious concerns.
>>> FEATURED STOCK ARTICLE : Quiet Rebound Meeting Resistance at 50-Day Moving Average - 9/29/2020 |
View all notes |
Set NEW NOTE alert |
Company Profile |
SEC
News |
Chart |
Request a new note
C
A
S
I |
Symbol/Exchange
Company Name
Industry Group |
PRICE |
CHANGE
(%Change) |
Day High |
Volume
(% DAV)
(% 50 day avg vol) |
52 Wk Hi
% From Hi |
Featured
Date |
Price
Featured |
Pivot Featured |
|
Max Buy |
LGIH
-
NASDAQ
L G I Homes Inc
Bldg-Resident/Comml
|
$123.17
|
+7.00
6.03% |
$123.58
|
222,811
75.79% of 50 DAV
50 DAV is 294,000
|
$123.94
-0.62%
|
10/1/2020
|
$123.17
|
PP = $124.04
|
|
MB = $130.24
|
Most Recent Note - 10/1/2020 5:47:48 PM
Y - Color code is changed to yellow with new pivot point cited based on its 8/04/20 high plus 10 cents. Subsequent gains above the pivot point backed by at least +40% above average volume are needed to trigger a new (or add-on) technical buy signal. Recent rebound above its 50 DMA line ($113.29) helped its outlook to improve. Any losses below the 50 DMA line and latest low ($101.30 on 9/21/20) would raise greater concerns and trigger worrisome technical sell signals. Reported Jun '20 quarterly earnings +21% on +4% sales revenues, breaking a streak of 4 comparisons above the +25% minimum guideline (C criteria). See the latest FSU analysis for more details and a new annotated graph.
>>> FEATURED STOCK ARTICLE : New Base Formed by Strong Homebuilder - 10/1/2020 |
View all notes |
Set NEW NOTE alert |
Company Profile |
SEC
News |
Chart |
Request a new note
C
A
S
I |
NOW
-
NYSE
Servicenow Inc
Computer Sftwr-Enterprse
|
$492.52
|
+7.52
1.55% |
$495.13
|
921,582
58.18% of 50 DAV
50 DAV is 1,584,000
|
$501.82
-1.85%
|
8/20/2020
|
$453.34
|
PP = $454.79
|
|
MB = $477.53
|
Most Recent Note - 10/1/2020 5:59:06 PM
G - Perched within striking distance of its all-time high, it found support at its 50 DMA line ($454.72) but has not quite formed a new base of sufficient length. Fundamentals remain strong. Any losses below the 50 DMA line and prior low ($432.85 on 9/08/20) would raise concerns and trigger technical sell signals.
>>> FEATURED STOCK ARTICLE : Gain Back Above "Max Buy" Level for ServiceNow - 9/25/2020 |
View all notes |
Set NEW NOTE alert |
Company Profile |
SEC
News |
Chart |
Request a new note
C
A
S
I |
|
|
|
THESE ARE NOT BUY RECOMMENDATIONS!
Comments contained in the body of this report are technical
opinions only. The material herein has been obtained
from sources believed to be reliable and accurate, however,
its accuracy and completeness cannot be guaranteed.
This site is not an investment advisor, hence it does
not endorse or recommend any securities or other investments.
Any recommendation contained in this report may not
be suitable for all investors and it is not to be deemed
an offer or solicitation on our part with respect to
the purchase or sale of any securities. All trademarks,
service marks and trade names appearing in this report
are the property of their respective owners, and are
likewise used for identification purposes only.
This report is a service available
only to active Paid Premium Members.
You may opt-out of receiving report notifications
at any time. Questions or comments may be submitted
by writing to Premium Membership Services 665 S.E. 10 Street, Suite 201 Deerfield Beach, FL 33441-5634 or by calling 1-800-965-8307
or 954-785-1121.
|
|
|