Symbol/Exchange
Company Name
Industry Group |
PRICE |
CHANGE
(%Change) |
Day High |
Volume
(% DAV)
(% 50 day avg vol) |
52 Wk Hi
% From Hi |
Featured
Date |
Price
Featured |
Pivot Featured |
|
Max Buy |
ABV
-
NYSE
Comp De Bebidas Adr
FOOD and BEVERAGE - Beverages - Brewers
|
$124.95
|
+1.31
1.06% |
$126.02
|
562,778
93.13% of 50 DAV
50 DAV is 604,300
|
$123.27
1.36%
|
6/29/2010
|
$104.74
|
PP = $109.33
|
|
MB = $114.80
|
Most Recent Note - 9/24/2010 4:12:57 PM
G - This Brazil-based beverage firm is hovering at its all-time high, stubbornly holding its ground after recent gains. Extended from a sound base, its prior highs in the $111-112 area define support above its 50 DMA line.
>>> The latest Featured Stock Update with an annotated graph appeared on 8/18/2010. Click here.
View all notes |
Alert me of new notes |
CANSLIM.net Company Profile |
SEC |
Zacks Reports |
StockTalk |
News |
Chart |
Request a new note
C
A N
S L
I M


|
ARUN
-
NASDAQ
Aruba Networks Inc
COMPUTER HARDWARE - Networking andamp; Communication Dev
|
$21.08
|
-0.26
-1.22% |
$21.88
|
2,733,211
132.76% of 50 DAV
50 DAV is 2,058,800
|
$22.80
-7.54%
|
8/30/2010
|
$18.12
|
PP = $18.51
|
|
MB = $19.44
|
 Most Recent Note - 10/1/2010 4:55:42 PM
G - Higher than average volume behind today's 3rd consecutive loss is a sign of mild distributional pressure. Prior highs near $18 and its 50 DMA line define chart support levels to watch.
>>> The latest Featured Stock Update with an annotated graph appeared on 9/2/2010. Click here.
View all notes |
Alert me of new notes |
CANSLIM.net Company Profile |
SEC |
Zacks Reports |
StockTalk |
News |
Chart |
Request a new note
C
A N
S L
I M
|
ASPS
-
NASDAQ
Altisource Ptf Sltns Sa
REAL ESTATE - Property Management/Developmen
|
$30.64
|
-0.50
-1.61% |
$31.35
|
125,408
109.62% of 50 DAV
50 DAV is 114,400
|
$30.20
1.47%
|
9/23/2010
|
$28.36
|
PP = $28.90
|
|
MB = $30.35
|
Most Recent Note - 9/30/2010 1:01:28 PM
G - Patient and disciplined investors may watch for light volume pullbacks while avoiding chasing stocks extended more than +5% above prior highs. This Luxembourg-based Financial Services firm has been strong since featured 9/23/10 in the mid-day report.
>>> The latest Featured Stock Update with an annotated graph appeared on 9/23/2010. Click here.
View all notes |
Alert me of new notes |
CANSLIM.net Company Profile |
SEC |
Zacks Reports |
StockTalk |
News |
Chart |
Request a new note
C
A N
S L
I M
|
BIDU
-
NASDAQ
Baidu Inc Ads
INTERNET - Internet Information Providers
|
$98.80
|
-3.82
-3.72% |
$103.50
|
13,826,673
140.22% of 50 DAV
50 DAV is 9,860,700
|
$107.19
-7.83%
|
9/17/2010
|
$85.73
|
PP = $88.42
|
|
MB = $92.84
|
Most Recent Note - 10/1/2010 4:19:26 PM
G - Churned above average volume this week while holding its ground. Extended from any sound base, yet it could go on to produce more climactic gains. Prior highs in the $88 area define support now.
>>> The latest Featured Stock Update with an annotated graph appeared on 8/13/2010. Click here.
View all notes |
Alert me of new notes |
CANSLIM.net Company Profile |
SEC |
Zacks Reports |
StockTalk |
News |
Chart |
Request a new note
C
A N
S L
I M
|
CACC
-
NASDAQ
Credit Acceptance Corp
FINANCIAL SERVICES - Credit Services
|
$57.58
|
-2.98
-4.92% |
$61.20
|
59,547
138.80% of 50 DAV
50 DAV is 42,900
|
$63.45
-9.25%
|
7/29/2010
|
$52.04
|
PP = $54.07
|
|
MB = $56.77
|
Most Recent Note - 10/1/2010 4:25:52 PM
Y - Violated its 50 DMA line today with a loss on above average volume, raising concerns. A prompt show of support would help its outlook, while a violation of its prior chart low ($56.06) would raise greater concerns and trigger a more worrisome technical sell signal. Please read the latest FSU for additional analysis concerning add-on points under the investment system's guidelines.
>>> The latest Featured Stock Update with an annotated graph appeared on 9/30/2010. Click here.
View all notes |
Alert me of new notes |
CANSLIM.net Company Profile |
SEC |
Zacks Reports |
StockTalk |
News |
Chart |
Request a new note
C
A N
S L
I M
|
Symbol/Exchange
Company Name
Industry Group |
PRICE |
CHANGE
(%Change) |
Day High |
Volume
(% DAV)
(% 50 day avg vol) |
52 Wk Hi
% From Hi |
Featured
Date |
Price
Featured |
Pivot Featured |
|
Max Buy |
CMG
-
NYSE
Chipotle Mexican Grill
LEISURE - Restaurants
|
$174.50
|
+2.50
1.45% |
$175.00
|
689,888
99.81% of 50 DAV
50 DAV is 691,200
|
$176.99
-1.41%
|
9/1/2010
|
$158.31
|
PP = $155.52
|
|
MB = $163.30
|
Most Recent Note - 9/30/2010 3:57:53 PM
G - Touched a new all-time high today then reversed into the red for a loss on light volume following gains with greater volume conviction. Extended from prior highs in the $155 area that define chart support.
>>> The latest Featured Stock Update with an annotated graph appeared on 9/1/2010. Click here.
View all notes |
Alert me of new notes |
CANSLIM.net Company Profile |
SEC |
Zacks Reports |
StockTalk |
News |
Chart |
Request a new note
C
A N
S L
I M
|
CRM
-
NYSE
Salesforce.Com Inc
INTERNET - Internet Software and Services
|
$112.00
|
+0.20
0.18% |
$113.15
|
2,568,940
94.03% of 50 DAV
50 DAV is 2,732,000
|
$123.77
-9.51%
|
6/2/2010
|
$88.44
|
PP = $89.60
|
|
MB = $94.08
|
Most Recent Note - 9/28/2010 4:48:38 PM
G - Loss today with slightly higher volume led to a damaging loss under its recent lows. It stalled following its 9/20/10 gain with +54% above average volume from an advanced "3-weeks tight" type pattern.
>>> The latest Featured Stock Update with an annotated graph appeared on 8/16/2010. Click here.
View all notes |
Alert me of new notes |
CANSLIM.net Company Profile |
SEC |
Zacks Reports |
StockTalk |
News |
Chart |
Request a new note
C
A N
S L
I M
|
CTRP
-
NASDAQ
Ctrip.Com Intl Ltd Adr
LEISURE - Resorts and Casinos
|
$47.45
|
-0.30
-0.63% |
$48.95
|
1,478,825
81.81% of 50 DAV
50 DAV is 1,807,600
|
$49.23
-3.62%
|
9/24/2010
|
$46.75
|
PP = $47.11
|
|
MB = $49.47
|
Most Recent Note - 9/28/2010 6:15:03 PM
Y - Pulled back from its 52-week high today after 7 consecutive gains with ever-increasing volume. Volume total +74% above average on 9/27/10 with its gain above the pivot point triggered a technical buy signal soon after it was featured in yellow in the 9/24/10 mid-day report (read here). No overhead supply remains to act as resistance, while the price/volume action has been choppy since it was dropped from the Featured Stocks list on 5/06/10. Quarterly and annual earnings history has been strong (good C and A criteria). Leadership (L criteria) in the stock's Industry Group (Leisure - Travel Booking) is a reassuring sign.
>>> The latest Featured Stock Update with an annotated graph appeared on 9/28/2010. Click here.
View all notes |
Alert me of new notes |
CANSLIM.net Company Profile |
SEC |
Zacks Reports |
StockTalk |
News |
Chart |
Request a new note
C
A N
S L
I M
|
EBIX
-
NASDAQ
Ebix Inc
COMPUTER SOFTWARE and SERVICES - Business Software and Services
|
$23.23
|
-0.22
-0.94% |
$23.75
|
504,608
98.65% of 50 DAV
50 DAV is 511,500
|
$24.20
-4.01%
|
9/23/2010
|
$21.78
|
PP = $22.74
|
|
MB = $23.88
|
Most Recent Note - 9/29/2010 12:38:16 PM
G - After a streak of consecutive gains with heavy volume it is perched at an all-time high, yet could go on to produce more climactic gains. Recent highs near $20 define chart support to watch.
>>> The latest Featured Stock Update with an annotated graph appeared on 9/24/2010. Click here.
View all notes |
Alert me of new notes |
CANSLIM.net Company Profile |
SEC |
Zacks Reports |
StockTalk |
News |
Chart |
Request a new note
C
A N
S L
I M
|
EGO
-
NYSE
Eldorado Gold Corp
METALS and MINING - Gold
|
$18.45
|
-0.04
-0.22% |
$18.81
|
4,718,914
105.53% of 50 DAV
50 DAV is 4,471,500
|
$20.23
-8.80%
|
8/19/2010
|
$18.25
|
PP = $19.17
|
|
MB = $20.13
|
Most Recent Note - 9/30/2010 3:19:07 PM
Y - Enduring distributional pressure and again testing its 50 DMA line.
>>> The latest Featured Stock Update with an annotated graph appeared on 8/19/2010. Click here.
View all notes |
Alert me of new notes |
CANSLIM.net Company Profile |
SEC |
Zacks Reports |
StockTalk |
News |
Chart |
Request a new note
C
A N
S L
I M
|
Symbol/Exchange
Company Name
Industry Group |
PRICE |
CHANGE
(%Change) |
Day High |
Volume
(% DAV)
(% 50 day avg vol) |
52 Wk Hi
% From Hi |
Featured
Date |
Price
Featured |
Pivot Featured |
|
Max Buy |
FFIV
-
NASDAQ
F 5 Networks Inc
INTERNET - Internet Software and Services
|
$103.29
|
-0.52
-0.50% |
$105.27
|
1,792,666
105.82% of 50 DAV
50 DAV is 1,694,100
|
$105.72
-2.30%
|
6/16/2010
|
$74.50
|
PP = $74.10
|
|
MB = $77.81
|
Most Recent Note - 9/30/2010 1:13:46 PM
G - Holding its ground near all-time highs, enduring some distributional pressure today. A steep upward trendline connecting July-August lows defines an initial chart support level above its 50 DMA line.
>>> The latest Featured Stock Update with an annotated graph appeared on 9/13/2010. Click here.
View all notes |
Alert me of new notes |
CANSLIM.net Company Profile |
SEC |
Zacks Reports |
StockTalk |
News |
Chart |
Request a new note
C
A N
S L
I M
|
FOSL
-
NASDAQ
Fossil Inc
CONSUMER DURABLES - Recreational Goods, Other
|
$53.07
|
-0.72
-1.34% |
$54.58
|
488,684
63.22% of 50 DAV
50 DAV is 773,000
|
$54.76
-3.09%
|
8/10/2010
|
$45.54
|
PP = $42.69
|
|
MB = $44.82
|
Most Recent Note - 9/29/2010 12:50:15 PM
G - Gapped down today for a small loss. Still near its all-time high after recent signs of distribution, an upward trendline defines initial support to watch after it has been repeatedly noted as "extended from any sound base."
>>> The latest Featured Stock Update with an annotated graph appeared on 8/11/2010. Click here.
View all notes |
Alert me of new notes |
CANSLIM.net Company Profile |
SEC |
Zacks Reports |
StockTalk |
News |
Chart |
Request a new note
C
A N
S L
I M
|
GMCR
-
NASDAQ
Green Mtn Coffee Roastrs
FOOD and BEVERAGE - Processed and Packaged Goods
|
$29.57
|
-1.62
-5.19% |
$30.68
|
20,702,474
797.57% of 50 DAV
50 DAV is 2,595,700
|
$37.97
-22.12%
|
8/17/2010
|
$33.62
|
PP = $33.30
|
|
MB = $34.97
|
Most Recent Note - 10/1/2010 4:29:12 PM
G - Another considerable loss today on heavy volume led to trading below its 200 DMA line. Its considerable 9/29/10 gap down for a damaging loss on very heavy volume amid headlines as the SEC probes its reporting of revenue. Technically it fell into its prior base and violated its 50 DMA line, triggering sell signals. Based on weak action it will be dropped from the Featured Stocks list tonight.
>>> The latest Featured Stock Update with an annotated graph appeared on 8/17/2010. Click here.
View all notes |
Alert me of new notes |
CANSLIM.net Company Profile |
SEC |
Zacks Reports |
StockTalk |
News |
Chart |
Request a new note
C
A N
S L
I M
|
HMSY
-
NASDAQ
H M S Holdings Corp
COMPUTER SOFTWARE and SERVICES - Healthcare Information Service
|
$59.32
|
+0.38
0.64% |
$59.44
|
92,588
48.30% of 50 DAV
50 DAV is 191,700
|
$58.86
0.78%
|
9/27/2010
|
$57.97
|
PP = $58.36
|
|
MB = $61.28
|
Most Recent Note - 9/27/2010 12:56:39 PM
Y - Color code is changed to yellow with pivot point cited based on its 52-week high plus ten cents. Healthy action has continued since last noted in the mid-day report on 7/30/10 - "Patient investors may watch for an ideal new base pattern to form. This high-ranked Commercial Services - Healthcare firm has maintained a solid sales revenues and earnings growth history that still satisfies the C and A criteria, and it has rebounded impressively since it was dropped from the Featured Stocks list on 8/10/09."
>>> The latest Featured Stock Update with an annotated graph appeared on 9/27/2010. Click here.
View all notes |
Alert me of new notes |
CANSLIM.net Company Profile |
SEC |
Zacks Reports |
StockTalk |
News |
Chart |
Request a new note
C
A N
S L
I M
|
HS
-
NYSE
Healthspring Inc
HEALTH SERVICES - Health Care Plans
|
$25.84
|
+0.00
0.00% |
$26.41
|
655,914
88.37% of 50 DAV
50 DAV is 742,200
|
$26.28
-1.67%
|
8/27/2010
|
$19.91
|
PP = $19.75
|
|
MB = $20.74
|
Most Recent Note - 9/30/2010 3:16:13 PM
G - Hit a new 52-week high and all-time high today then reversed into the red following 9 consecutive gains. Support to watch is prior chart highs in the $19-20 area. Disciplined investors do not chase stocks that are extended from a sound base.
>>> The latest Featured Stock Update with an annotated graph appeared on 8/27/2010. Click here.
View all notes |
Alert me of new notes |
CANSLIM.net Company Profile |
SEC |
Zacks Reports |
StockTalk |
News |
Chart |
Request a new note
C
A N
S L
I M
|
Symbol/Exchange
Company Name
Industry Group |
PRICE |
CHANGE
(%Change) |
Day High |
Volume
(% DAV)
(% 50 day avg vol) |
52 Wk Hi
% From Hi |
Featured
Date |
Price
Featured |
Pivot Featured |
|
Max Buy |
IGTE
-
NASDAQ
Igate Corp
COMPUTER SOFTWARE and SERVICES - Information Technology Service
|
$18.00
|
-0.14
-0.77% |
$18.49
|
435,070
105.68% of 50 DAV
50 DAV is 411,700
|
$19.45
-7.46%
|
9/8/2010
|
$17.29
|
PP = $18.26
|
|
MB = $19.17
|
Most Recent Note - 9/30/2010 3:27:19 PM
Y - Trading near the middle of today's intra-day range, enduring distributional pressure. Concerns are raised by its lack of meaningful price progress above prior highs in the past 2 weeks while volume totals have been above average .
>>> The latest Featured Stock Update with an annotated graph appeared on 9/10/2010. Click here.
View all notes |
Alert me of new notes |
CANSLIM.net Company Profile |
SEC |
Zacks Reports |
StockTalk |
News |
Chart |
Request a new note
C
A N
S L
I M
|
JOBS
-
NASDAQ
Fifty One Job Inc Ads
DIVERSIFIED SERVICES - Staffing and; Outsourcing Service
|
$38.96
|
+1.49
3.98% |
$39.00
|
131,538
93.22% of 50 DAV
50 DAV is 141,100
|
$39.19
-0.58%
|
9/16/2010
|
$31.59
|
PP = $30.40
|
|
MB = $31.92
|
Most Recent Note - 10/1/2010 4:38:31 PM
G - Finished at a new high close with a gain on near average volume. Stubbornly holding its ground after a recent streak of volume-driven gains, very extended from a sound base. Prior highs in the $30 area define chart support.
>>> The latest Featured Stock Update with an annotated graph appeared on 9/16/2010. Click here.
View all notes |
Alert me of new notes |
CANSLIM.net Company Profile |
SEC |
Zacks Reports |
StockTalk |
News |
Chart |
Request a new note
C
A N
S L
I M
|
MELI
-
NASDAQ
Mercadolibre Inc
INTERNET - Internet Software and; Services
|
$71.35
|
-0.83
-1.15% |
$73.53
|
792,755
96.18% of 50 DAV
50 DAV is 824,200
|
$76.81
-7.11%
|
5/13/2010
|
$54.21
|
PP = $55.85
|
|
MB = $58.64
|
Most Recent Note - 9/30/2010 3:41:14 PM
G - Holding its ground near its 52-week high today, but extended from a sound base. Its 50 DMA line defines important chart support.
>>> The latest Featured Stock Update with an annotated graph appeared on 8/26/2010. Click here.
View all notes |
Alert me of new notes |
CANSLIM.net Company Profile |
SEC |
Zacks Reports |
StockTalk |
News |
Chart |
Request a new note
C
A N
S L
I M
|
MRX
-
NYSE
Medicis Pharmaceut Cl A
DRUGS - Biotechnology
|
$29.52
|
-0.13
-0.44% |
$29.89
|
710,925
58.05% of 50 DAV
50 DAV is 1,224,600
|
$30.29
-2.54%
|
8/12/2010
|
$26.88
|
PP = $26.71
|
|
MB = $28.05
|
Most Recent Note - 9/29/2010 4:39:41 PM
G - Small gap down for a loss on light volume today. Still hovering near its 2010 high with volume totals cooling the past few sessions. Prior highs in the $28 area define the initial chart support level to watch.
>>> The latest Featured Stock Update with an annotated graph appeared on 8/12/2010. Click here.
View all notes |
Alert me of new notes |
CANSLIM.net Company Profile |
SEC |
Zacks Reports |
StockTalk |
News |
Chart |
Request a new note
C
A N
S L
I M
|
MWIV
-
NASDAQ
M W I Veterinary Supply
HEALTH SERVICES - Medical Instruments and; Supplies
|
$56.62
|
-1.10
-1.91% |
$58.23
|
22,372
30.48% of 50 DAV
50 DAV is 73,400
|
$57.99
-2.36%
|
7/29/2010
|
$52.05
|
PP = $52.09
|
|
MB = $54.69
|
Most Recent Note - 10/1/2010 4:41:30 PM
G - Volume totals have been cooling while stubbornly holding its ground near all-time highs. No overhead supply remains to act as resistance. Its 50 DMA line defines important chart support.
>>> The latest Featured Stock Update with an annotated graph appeared on 9/7/2010. Click here.
View all notes |
Alert me of new notes |
CANSLIM.net Company Profile |
SEC |
Zacks Reports |
StockTalk |
News |
Chart |
Request a new note
C
A N
S L
I M
|
Symbol/Exchange
Company Name
Industry Group |
PRICE |
CHANGE
(%Change) |
Day High |
Volume
(% DAV)
(% 50 day avg vol) |
52 Wk Hi
% From Hi |
Featured
Date |
Price
Featured |
Pivot Featured |
|
Max Buy |
NEM
-
NYSE
Newmont Mining Corp
METALS and MINING - Gold
|
$63.68
|
+0.87
1.39% |
$64.24
|
4,762,757
76.90% of 50 DAV
50 DAV is 6,193,100
|
$65.50
-2.78%
|
8/31/2010
|
$61.32
|
PP = $63.48
|
|
MB = $66.65
|
Most Recent Note - 9/28/2010 4:40:32 PM
Y - Positive reversal today for a solid gain, rallying back its pivot point with above average volume following a gap down and 3 consecutive losses on lighter volume. No overhead supply remains to hinder its progress. Leadership in the Mining - Gold/Silver/Gems group (L criteria) is a nice reassurance.
>>> The latest Featured Stock Update with an annotated graph appeared on 9/14/2010. Click here.
View all notes |
Alert me of new notes |
CANSLIM.net Company Profile |
SEC |
Zacks Reports |
StockTalk |
News |
Chart |
Request a new note
C
A N
S L
I M
|
NEOG
-
NASDAQ
Neogen Corp
DRUGS - Diagnostic Substances
|
$32.67
|
-1.18
-3.49% |
$33.96
|
151,928
141.72% of 50 DAV
50 DAV is 107,200
|
$34.76
-6.01%
|
9/1/2010
|
$30.79
|
PP = $30.49
|
|
MB = $32.01
|
Most Recent Note - 10/1/2010 4:44:05 PM
G- Loss today with slightly higher volume was indicative of mild distributional pressure . Prior highs in the $30 area define initial support to watch.
>>> The latest Featured Stock Update with an annotated graph appeared on 8/20/2010. Click here.
View all notes |
Alert me of new notes |
CANSLIM.net Company Profile |
SEC |
Zacks Reports |
StockTalk |
News |
Chart |
Request a new note
C
A N
S L
I M
|
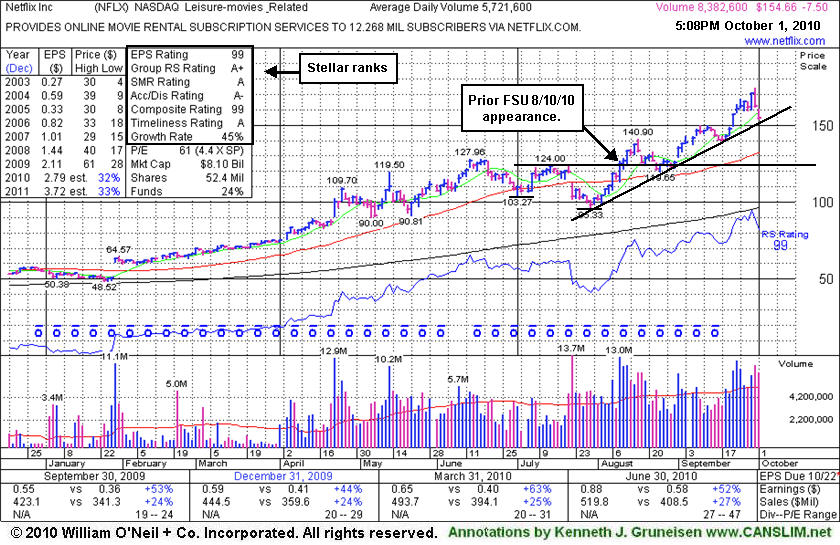
NFLX
-
NASDAQ
Netflix Inc
SPECIALTY RETAIL - Music and Video Stores
|
$154.66
|
-7.50
-4.63% |
$160.70
|
8,416,013
152.88% of 50 DAV
50 DAV is 5,504,800
|
$167.12
-7.46%
|
8/10/2010
|
$124.05
|
PP = $124.00
|
|
MB = $130.20
|
Most Recent Note - 10/1/2010 4:35:16 PM
G - Down today for a second consecutive loss with above average volume following a negative reversal at its all-time high. It is extended from a sound base pattern. Prior highs define important support to watch along with an upward trendline that comes into play well above its 50 DMA line.
>>> The latest Featured Stock Update with an annotated graph appeared on 10/1/2010. Click here.
View all notes |
Alert me of new notes |
CANSLIM.net Company Profile |
SEC |
Zacks Reports |
StockTalk |
News |
Chart |
Request a new note
C
A N
S L
I M
|
NTAP
-
NASDAQ
Netapp Inc
COMPUTER HARDWARE - Data Storage Devices
|
$48.64
|
-1.15
-2.31% |
$50.10
|
10,208,297
127.17% of 50 DAV
50 DAV is 8,027,400
|
$51.40
-5.37%
|
9/8/2010
|
$46.98
|
PP = $44.99
|
|
MB = $47.24
|
Most Recent Note - 10/1/2010 4:45:31 PM
G - Down today for a second consecutive loss with above average volume. Extended from a sound base, support to watch is at prior chart highs near its latest pivot point.
>>> The latest Featured Stock Update with an annotated graph appeared on 9/8/2010. Click here.
View all notes |
Alert me of new notes |
CANSLIM.net Company Profile |
SEC |
Zacks Reports |
StockTalk |
News |
Chart |
Request a new note
C
A N
S L
I M
|
ORCL
-
NASDAQ
Oracle Corp
COMPUTER SOFTWARE and SERVICES - Application Software
|
$27.24
|
+0.39
1.43% |
$27.61
|
33,678,444
93.13% of 50 DAV
50 DAV is 36,163,000
|
$27.63
-1.41%
|
9/20/2010
|
$27.32
|
PP = $26.73
|
|
MB = $28.07
|
Most Recent Note - 9/27/2010 5:45:16 PM
Y - Holding its ground in a tight trading range since its "breakaway gap" on 9/17/10 backed by 5 times average volume.
>>> The latest Featured Stock Update with an annotated graph appeared on 9/20/2010. Click here.
View all notes |
Alert me of new notes |
CANSLIM.net Company Profile |
SEC |
Zacks Reports |
StockTalk |
News |
Chart |
Request a new note
C
A N
S L
I M
|
Symbol/Exchange
Company Name
Industry Group |
PRICE |
CHANGE
(%Change) |
Day High |
Volume
(% DAV)
(% 50 day avg vol) |
52 Wk Hi
% From Hi |
Featured
Date |
Price
Featured |
Pivot Featured |
|
Max Buy |
PAY
-
NYSE
Verifone Systems Inc
COMPUTER HARDWARE - Transaction Automation Systems
|
$28.46
|
-2.61
-8.40% |
$31.40
|
3,055,477
223.93% of 50 DAV
50 DAV is 1,364,500
|
$29.54
-3.67%
|
8/25/2010
|
$24.30
|
PP = $23.74
|
|
MB = $24.93
|
Most Recent Note - 10/1/2010 1:28:25 PM
G - Pulling back abruptly today after a considerable gain with above average volume on the prior session. Extended from a sound base, its prior highs in the $23 area define chart support.
>>> The latest Featured Stock Update with an annotated graph appeared on 8/30/2010. Click here.
View all notes |
Alert me of new notes |
CANSLIM.net Company Profile |
SEC |
Zacks Reports |
StockTalk |
News |
Chart |
Request a new note
C
A N
S L
I M
|
PRGO
-
NASDAQ
Perrigo Co
DRUGS - Drug Related Products
|
$64.47
|
+0.25
0.39% |
$65.00
|
579,952
56.62% of 50 DAV
50 DAV is 1,024,300
|
$67.49
-4.47%
|
9/15/2010
|
$63.73
|
PP = $64.76
|
|
MB = $68.00
|
Most Recent Note - 9/27/2010 5:54:05 PM
Y - Pulled back today on lighter volume. Its 9/24/10 gap up gain with +50% above average volume for a new 52-week high triggered a technical buy signal with volume near the minimum guideline. It was first featured in the 9/15/10 mid-day report.
>>> The latest Featured Stock Update with an annotated graph appeared on 9/15/2010. Click here.
View all notes |
Alert me of new notes |
CANSLIM.net Company Profile |
SEC |
Zacks Reports |
StockTalk |
News |
Chart |
Request a new note
C
A N
S L
I M
|
RAX
-
NYSE
Rackspace Hosting Inc
INTERNET - Internet Software and; Services
|
$25.77
|
-0.21
-0.81% |
$26.29
|
2,352,643
124.92% of 50 DAV
50 DAV is 1,883,300
|
$26.50
-2.75%
|
9/21/2010
|
$22.84
|
PP = $23.61
|
|
MB = $24.79
|
Most Recent Note - 10/1/2010 1:37:28 PM
Y - Churning above average volume has recently been indicative of distributional pressure, yet it stubbornly has held its ground following a "breakaway gap" to a new 52-week high. Noted on 9/28/10 - "A breakaway gap is one exception where chasing a stock more than +5% above prior highs is permitted. While patient investors may watch for pullbacks, no overhead supply remains to hinder its progress."
>>> The latest Featured Stock Update with an annotated graph appeared on 9/21/2010. Click here.
View all notes |
Alert me of new notes |
CANSLIM.net Company Profile |
SEC |
Zacks Reports |
StockTalk |
News |
Chart |
Request a new note
C
A N
S L
I M
|
ROVI
-
NASDAQ
Rovi Corp
COMPUTER SOFTWARE andamp; SERVICES - Security Software andamp; Services
|
$50.17
|
-0.24
-0.48% |
$50.97
|
1,239,198
87.88% of 50 DAV
50 DAV is 1,410,100
|
$52.28
-4.04%
|
8/31/2010
|
$43.31
|
PP = $45.06
|
|
MB = $47.31
|
Most Recent Note - 9/30/2010 3:20:39 PM
G - Pulling back today under profit taking pressure after a streak of big gains on above average volume. It is extended from its latest base, and prior highs in the $45 area define chart support to watch now.
>>> The latest Featured Stock Update with an annotated graph appeared on 8/24/2010. Click here.
View all notes |
Alert me of new notes |
CANSLIM.net Company Profile |
SEC |
Zacks Reports |
StockTalk |
News |
Chart |
Request a new note
C
A N
S L
I M
|
SHOO
-
NASDAQ
Steven Madden Limited
CONSUMER NON-DURABLES - Textile - Apparel Footwear
|
$41.20
|
+0.14
0.34% |
$42.29
|
185,265
41.67% of 50 DAV
50 DAV is 444,600
|
$41.03
0.41%
|
9/15/2010
|
$38.94
|
PP = $40.27
|
|
MB = $42.28
|
Most Recent Note - 9/30/2010 3:56:06 PM
Y - Down on light volume today after 2 consecutive gains with above average volume for new 52-week highs. A solid gain on 9/28/10 with +50% above average volume triggered a technical buy signal.
>>> The latest Featured Stock Update with an annotated graph appeared on 9/29/2010. Click here.
View all notes |
Alert me of new notes |
CANSLIM.net Company Profile |
SEC |
Zacks Reports |
StockTalk |
News |
Chart |
Request a new note
C
A N
S L
I M
|
Symbol/Exchange
Company Name
Industry Group |
PRICE |
CHANGE
(%Change) |
Day High |
Volume
(% DAV)
(% 50 day avg vol) |
52 Wk Hi
% From Hi |
Featured
Date |
Price
Featured |
Pivot Featured |
|
Max Buy |
SLW
-
NYSE
Silver Wheaton Corp
METALS and; MINING - Silver
|
$26.67
|
+0.02
0.08% |
$27.13
|
7,537,953
142.22% of 50 DAV
50 DAV is 5,300,300
|
$27.04
-1.37%
|
8/25/2010
|
$21.40
|
PP = $21.99
|
|
MB = $23.09
|
Most Recent Note - 10/1/2010 1:40:08 PM
G - Consolidating after a streak of recent gains with above average volume, holding its ground in a tight range near an all-time high, extended from a sound base. Prior highs in the $21 area define chart support to watch.
>>> The latest Featured Stock Update with an annotated graph appeared on 8/25/2010. Click here.
View all notes |
Alert me of new notes |
CANSLIM.net Company Profile |
SEC |
Zacks Reports |
StockTalk |
News |
Chart |
Request a new note
C
A N
S L
I M
|
SVR
-
NYSE
Syniverse Holdings Inc
TELECOMMUNICATIONS - Diversified Communication Serv
|
$22.18
|
-0.49
-2.16% |
$23.01
|
1,182,455
171.00% of 50 DAV
50 DAV is 691,500
|
$24.24
-8.50%
|
9/22/2010
|
$23.60
|
PP = $23.87
|
|
MB = $25.06
|
Most Recent Note - 10/1/2010 4:53:13 PM
G - Down for a 3rd consecutive loss today with ever-increasing +71% above average volume. The prior breakout lacked heavy volume conviction and was completely negated as it promptly slumped into its prior base. Its Relative Strength rank has also slumped under the 80+ guideline, an additional red flag. Its 50 DMA line and recent chart low ($21.47) are define important support to watch.
>>> The latest Featured Stock Update with an annotated graph appeared on 9/22/2010. Click here.
View all notes |
Alert me of new notes |
CANSLIM.net Company Profile |
SEC |
Zacks Reports |
StockTalk |
News |
Chart |
Request a new note
C
A N
S L
I M
|
UA
-
NYSE
Under Armour Inc Cl A
CONSUMER NON-DURABLES - Textile - Apparel Clothing
|
$45.05
|
+0.01
0.02% |
$45.84
|
549,795
72.35% of 50 DAV
50 DAV is 759,900
|
$46.10
-2.28%
|
9/9/2010
|
$39.99
|
PP = $40.10
|
|
MB = $42.11
|
Most Recent Note - 9/28/2010 5:00:03 PM
G - Closed at a new 2010 high today with its 18th gain in 20 sessions. It is extended from its latest sound base pattern.
>>> The latest Featured Stock Update with an annotated graph appeared on 9/9/2010. Click here.
View all notes |
Alert me of new notes |
CANSLIM.net Company Profile |
SEC |
Zacks Reports |
StockTalk |
News |
Chart |
Request a new note
C
A N
S L
I M
|
UFPT
-
NASDAQ
U F P Tech Inc
CONSUMER NON-DURABLES - Packaging and Containers
|
$12.49
|
+0.80
6.82% |
$12.50
|
131,344
284.29% of 50 DAV
50 DAV is 46,200
|
$11.85
5.37%
|
9/16/2010
|
$11.20
|
PP = $11.69
|
|
MB = $12.27
|
Most Recent Note - 10/1/2010 1:49:02 PM
Y - Hit another new 52-week high while on track for a 4th consecutive gain with ever-increasing volume above average, quickly trading above its pivot point and near its "max buy" level today. Technically, a strong close may clinch a new technical buy signal. No resistance remains due to overhead supply. With only 6.21 million shares outstanding (S criteria) any institutional buying or selling can lead to great price volatility. Few institutional investors (I criteria) own its shares, but the number of top-rated funds has increased from 6 in Sep '09 to 10 in Jun '10.
>>> The latest Featured Stock Update with an annotated graph appeared on 9/17/2010. Click here.
View all notes |
Alert me of new notes |
CANSLIM.net Company Profile |
SEC |
Zacks Reports |
StockTalk |
News |
Chart |
Request a new note
C
A N
S L
I M
|
ULTA
-
NASDAQ
Ulta Salon Cosm & Frag
SPECIALTY RETAIL - Specialty Retail, Other
|
$29.35
|
+0.15
0.51% |
$29.54
|
380,149
61.91% of 50 DAV
50 DAV is 614,000
|
$29.47
-0.41%
|
9/3/2010
|
$26.36
|
PP = $25.89
|
|
MB = $27.18
|
Most Recent Note - 9/28/2010 4:44:28 PM
G - Gain today on average volume for its best close of the year. Prior highs in the $26 area define support to watch now.
>>> The latest Featured Stock Update with an annotated graph appeared on 9/3/2010. Click here.
View all notes |
Alert me of new notes |
CANSLIM.net Company Profile |
SEC |
Zacks Reports |
StockTalk |
News |
Chart |
Request a new note
C
A N
S L
I M
|
Symbol/Exchange
Company Name
Industry Group |
PRICE |
CHANGE
(%Change) |
Day High |
Volume
(% DAV)
(% 50 day avg vol) |
52 Wk Hi
% From Hi |
Featured
Date |
Price
Featured |
Pivot Featured |
|
Max Buy |
VIT
-
NYSE
Vanceinfo Tech Inc Ads
COMPUTER SOFTWARE and SERVICES - Business Software and Services
|
$32.49
|
+0.15
0.46% |
$32.75
|
681,463
113.26% of 50 DAV
50 DAV is 601,700
|
$33.30
-2.43%
|
7/8/2010
|
$25.20
|
PP = $26.58
|
|
MB = $27.91
|
Most Recent Note - 9/29/2010 1:12:35 PM
G - Holding its ground stubbornly at its all-time high. It is extended after rallying from a prior resistance level in the $26 area. Its 50 DMA line defines chart support to watch.
>>> The latest Featured Stock Update with an annotated graph appeared on 8/31/2010. Click here.
View all notes |
Alert me of new notes |
CANSLIM.net Company Profile |
SEC |
Zacks Reports |
StockTalk |
News |
Chart |
Request a new note
C
A N
S L
I M
|
WCRX
-
NASDAQ
Warner Chilcott Plc
DRUGS - Drug Manufacturers - Other
|
$21.53
|
-0.91
-4.06% |
$22.08
|
7,348,979
289.18% of 50 DAV
50 DAV is 2,541,300
|
$30.57
-29.57%
|
8/23/2010
|
$21.04
|
PP = $20.84
|
|
MB = $21.88
|
Most Recent Note - 10/1/2010 4:32:56 PM
G - Gapped down today for a loss with heavy volume, a sign of more worrisome distributional pressure. Slumping near prior highs and its 50 DMA line defining chart support in the $20-21 area.
>>> The latest Featured Stock Update with an annotated graph appeared on 8/23/2010. Click here.
View all notes |
Alert me of new notes |
CANSLIM.net Company Profile |
SEC |
Zacks Reports |
StockTalk |
News |
Chart |
Request a new note
C
A N
S L
I M
|