***Last / Change / Volume data in this table is the closing quote data***
Symbol/Exchange
Company Name
Industry Group |
PRICE |
CHANGE
(%Change) |
Day High |
Volume
(% DAV)
(% 50 day avg vol) |
52 Wk Hi
% From Hi |
Featured
Date |
Price
Featured |
Pivot Featured |
|
Max Buy |
ABV
-
NYSE
Comp De Bebidas Adr
FOOD and BEVERAGE - Beverages - Brewers
|
$125.89
|
+0.94
0.75% |
$126.48
|
504,555
83.83% of 50 DAV
50 DAV is 601,900
|
$126.02
-0.10%
|
6/29/2010
|
$104.74
|
PP = $109.33
|
|
MB = $114.80
|
Most Recent Note - 9/24/2010 4:12:57 PM
G - This Brazil-based beverage firm is hovering at its all-time high, stubbornly holding its ground after recent gains. Extended from a sound base, its prior highs in the $111-112 area define support above its 50 DMA line.
>>> The latest Featured Stock Update with an annotated graph appeared on 8/18/2010. Click here.
View all notes |
Alert me of new notes |
CANSLIM.net Company Profile |
SEC |
Zacks Reports |
StockTalk |
News |
Chart |
Request a new note
C
A N
S L
I M


|
ARUN
-
NASDAQ
Aruba Networks Inc
COMPUTER HARDWARE - Networking andamp; Communication Dev
|
$20.53
|
-0.56
-2.63% |
$21.08
|
2,644,496
127.32% of 50 DAV
50 DAV is 2,077,000
|
$22.80
-9.98%
|
8/30/2010
|
$18.12
|
PP = $18.51
|
|
MB = $19.44
|
 Most Recent Note - 10/4/2010 2:19:01 PM
G - Down today for a 4th consecutive loss, enduring mild distributional pressure after getting extended from a sound base pattern. Prior highs near $18 and its 50 DMA line define chart support levels to watch.
>>> The latest Featured Stock Update with an annotated graph appeared on 9/2/2010. Click here.
View all notes |
Alert me of new notes |
CANSLIM.net Company Profile |
SEC |
Zacks Reports |
StockTalk |
News |
Chart |
Request a new note
C
A N
S L
I M
|
ASPS
-
NASDAQ
Altisource Ptf Sltns Sa
REAL ESTATE - Property Management/Developmen
|
$29.57
|
-1.07
-3.49% |
$30.68
|
187,584
157.37% of 50 DAV
50 DAV is 119,200
|
$31.35
-5.68%
|
9/23/2010
|
$28.36
|
PP = $28.90
|
|
MB = $30.35
|
Most Recent Note - 10/4/2010 11:59:58 AM
G - Quietly consolidating since last noted on 9/30/10 - "Patient and disciplined investors may watch for light volume pullbacks while avoiding chasing stocks extended more than +5% above prior highs. This Luxembourg-based Financial Services firm has been strong since featured 9/23/10 in the mid-day report. "
>>> The latest Featured Stock Update with an annotated graph appeared on 9/23/2010. Click here.
View all notes |
Alert me of new notes |
CANSLIM.net Company Profile |
SEC |
Zacks Reports |
StockTalk |
News |
Chart |
Request a new note
C
A N
S L
I M
|
BIDU
-
NASDAQ
Baidu Inc Ads
INTERNET - Internet Information Providers
|
$96.22
|
-2.58
-2.61% |
$99.38
|
13,430,541
139.01% of 50 DAV
50 DAV is 9,661,500
|
$107.19
-10.23%
|
9/17/2010
|
$85.73
|
PP = $88.42
|
|
MB = $92.84
|
Most Recent Note - 10/4/2010 2:22:33 PM
G - Down today after churning above average volume last week. Extended from any sound base, its prior highs in the $88 area define important chart support near its 50 DMA line.
>>> The latest Featured Stock Update with an annotated graph appeared on 8/13/2010. Click here.
View all notes |
Alert me of new notes |
CANSLIM.net Company Profile |
SEC |
Zacks Reports |
StockTalk |
News |
Chart |
Request a new note
C
A N
S L
I M
|
CACC
-
NASDAQ
Credit Acceptance Corp
FINANCIAL SERVICES - Credit Services
|
$56.92
|
-0.66
-1.15% |
$57.49
|
60,320
142.60% of 50 DAV
50 DAV is 42,300
|
$63.45
-10.29%
|
7/29/2010
|
$52.04
|
PP = $54.07
|
|
MB = $56.77
|
Most Recent Note - 10/4/2010 11:30:59 AM
G - Violated its 50 DMA line on Friday, and now trading back above the previously noted chart low ($56.06) after undercutting it earlier today. A prompt sign of support would be encouraging. The color code is changed to green based upon damaging technical action since the latest FSU appearance. The old high ($53.97 on 2/01/10) is the next chart support level to watch.
>>> The latest Featured Stock Update with an annotated graph appeared on 9/30/2010. Click here.
View all notes |
Alert me of new notes |
CANSLIM.net Company Profile |
SEC |
Zacks Reports |
StockTalk |
News |
Chart |
Request a new note
C
A N
S L
I M
|
Symbol/Exchange
Company Name
Industry Group |
PRICE |
CHANGE
(%Change) |
Day High |
Volume
(% DAV)
(% 50 day avg vol) |
52 Wk Hi
% From Hi |
Featured
Date |
Price
Featured |
Pivot Featured |
|
Max Buy |
CMG
-
NYSE
Chipotle Mexican Grill
LEISURE - Restaurants
|
$172.96
|
-1.54
-0.88% |
$174.58
|
565,022
84.86% of 50 DAV
50 DAV is 665,800
|
$177.69
-2.66%
|
9/1/2010
|
$158.31
|
PP = $155.52
|
|
MB = $163.30
|
Most Recent Note - 9/30/2010 3:57:53 PM
G - Touched a new all-time high today then reversed into the red for a loss on light volume following gains with greater volume conviction. Extended from prior highs in the $155 area that define chart support.
>>> The latest Featured Stock Update with an annotated graph appeared on 9/1/2010. Click here.
View all notes |
Alert me of new notes |
CANSLIM.net Company Profile |
SEC |
Zacks Reports |
StockTalk |
News |
Chart |
Request a new note
C
A N
S L
I M
|
CRM
-
NYSE
Salesforce.Com Inc
INTERNET - Internet Software and Services
|
$112.08
|
+0.08
0.07% |
$112.93
|
2,271,595
80.16% of 50 DAV
50 DAV is 2,833,800
|
$123.77
-9.44%
|
6/2/2010
|
$88.44
|
PP = $89.60
|
|
MB = $94.08
|
Most Recent Note - 9/28/2010 4:48:38 PM
G - Loss today with slightly higher volume led to a damaging loss under its recent lows. It stalled following its 9/20/10 gain with +54% above average volume from an advanced "3-weeks tight" type pattern.
>>> The latest Featured Stock Update with an annotated graph appeared on 8/16/2010. Click here.
View all notes |
Alert me of new notes |
CANSLIM.net Company Profile |
SEC |
Zacks Reports |
StockTalk |
News |
Chart |
Request a new note
C
A N
S L
I M
|
CTRP
-
NASDAQ
Ctrip.Com Intl Ltd Adr
LEISURE - Resorts and Casinos
|
$46.32
|
-1.13
-2.38% |
$47.45
|
1,768,521
99.38% of 50 DAV
50 DAV is 1,779,600
|
$49.23
-5.92%
|
9/24/2010
|
$46.75
|
PP = $47.11
|
|
MB = $49.47
|
Most Recent Note - 10/4/2010 2:28:22 PM
Y - Slumped back below its pivot point without heavy volume behind a third consecutive loss today, sending it back into the prior base. More damaging losses would raise greater concerns as healthy stocks to not typically slump more than -7% below their pivot point after breaking out.
>>> The latest Featured Stock Update with an annotated graph appeared on 9/28/2010. Click here.
View all notes |
Alert me of new notes |
CANSLIM.net Company Profile |
SEC |
Zacks Reports |
StockTalk |
News |
Chart |
Request a new note
C
A N
S L
I M
|
EBIX
-
NASDAQ
Ebix Inc
COMPUTER SOFTWARE and SERVICES - Business Software and Services
|
$23.78
|
+0.55
2.37% |
$24.13
|
626,546
117.68% of 50 DAV
50 DAV is 532,400
|
$24.60
-3.33%
|
9/23/2010
|
$21.78
|
PP = $22.74
|
|
MB = $23.88
|
Most Recent Note - 10/4/2010 12:07:34 PM
G - Holding its ground stubbornly following a streak of consecutive gains with heavy volume. Perched near all-time highs, it could go on to produce more climactic gains, but it is extended from an ideal base. Recent highs near $20 define chart support to watch.
>>> The latest Featured Stock Update with an annotated graph appeared on 9/24/2010. Click here.
View all notes |
Alert me of new notes |
CANSLIM.net Company Profile |
SEC |
Zacks Reports |
StockTalk |
News |
Chart |
Request a new note
C
A N
S L
I M
|
EGO
-
NYSE
Eldorado Gold Corp
METALS and MINING - Gold
|
$18.23
|
-0.22
-1.19% |
$18.45
|
2,588,543
55.87% of 50 DAV
50 DAV is 4,633,200
|
$20.23
-9.89%
|
8/19/2010
|
$18.25
|
PP = $19.17
|
|
MB = $20.13
|
Most Recent Note - 9/30/2010 3:19:07 PM
Y - Enduring distributional pressure and again testing its 50 DMA line.
>>> The latest Featured Stock Update with an annotated graph appeared on 8/19/2010. Click here.
View all notes |
Alert me of new notes |
CANSLIM.net Company Profile |
SEC |
Zacks Reports |
StockTalk |
News |
Chart |
Request a new note
C
A N
S L
I M
|
Symbol/Exchange
Company Name
Industry Group |
PRICE |
CHANGE
(%Change) |
Day High |
Volume
(% DAV)
(% 50 day avg vol) |
52 Wk Hi
% From Hi |
Featured
Date |
Price
Featured |
Pivot Featured |
|
Max Buy |
FFIV
-
NASDAQ
F 5 Networks Inc
INTERNET - Internet Software and Services
|
$105.89
|
+2.60
2.52% |
$108.76
|
3,064,404
190.52% of 50 DAV
50 DAV is 1,608,400
|
$107.30
-1.31%
|
6/16/2010
|
$74.50
|
PP = $74.10
|
|
MB = $77.81
|
Most Recent Note - 10/4/2010 12:08:53 PM
G - Holding its ground near all-time highs, recently enduring some distributional pressure. A steep upward trendline connecting July-August lows defines an initial chart support level above its 50 DMA line.
>>> The latest Featured Stock Update with an annotated graph appeared on 9/13/2010. Click here.
View all notes |
Alert me of new notes |
CANSLIM.net Company Profile |
SEC |
Zacks Reports |
StockTalk |
News |
Chart |
Request a new note
C
A N
S L
I M
|
FOSL
-
NASDAQ
Fossil Inc
CONSUMER DURABLES - Recreational Goods, Other
|
$52.75
|
-0.32
-0.60% |
$53.18
|
476,595
59.04% of 50 DAV
50 DAV is 807,200
|
$54.76
-3.67%
|
8/10/2010
|
$45.54
|
PP = $42.69
|
|
MB = $44.82
|
Most Recent Note - 9/29/2010 12:50:15 PM
G - Gapped down today for a small loss. Still near its all-time high after recent signs of distribution, an upward trendline defines initial support to watch after it has been repeatedly noted as "extended from any sound base."
>>> The latest Featured Stock Update with an annotated graph appeared on 8/11/2010. Click here.
View all notes |
Alert me of new notes |
CANSLIM.net Company Profile |
SEC |
Zacks Reports |
StockTalk |
News |
Chart |
Request a new note
C
A N
S L
I M
|
HMSY
-
NASDAQ
H M S Holdings Corp
COMPUTER SOFTWARE and SERVICES - Healthcare Information Service
|
$59.56
|
+0.24
0.40% |
$59.67
|
202,146
104.85% of 50 DAV
50 DAV is 192,800
|
$59.84
-0.47%
|
9/27/2010
|
$57.97
|
PP = $58.36
|
|
MB = $61.28
|
Most Recent Note - 9/27/2010 12:56:39 PM
Y - Color code is changed to yellow with pivot point cited based on its 52-week high plus ten cents. Healthy action has continued since last noted in the mid-day report on 7/30/10 - "Patient investors may watch for an ideal new base pattern to form. This high-ranked Commercial Services - Healthcare firm has maintained a solid sales revenues and earnings growth history that still satisfies the C and A criteria, and it has rebounded impressively since it was dropped from the Featured Stocks list on 8/10/09."
>>> The latest Featured Stock Update with an annotated graph appeared on 9/27/2010. Click here.
View all notes |
Alert me of new notes |
CANSLIM.net Company Profile |
SEC |
Zacks Reports |
StockTalk |
News |
Chart |
Request a new note
C
A N
S L
I M
|
HS
-
NYSE
Healthspring Inc
HEALTH SERVICES - Health Care Plans
|
$25.48
|
-0.36
-1.39% |
$25.96
|
796,581
106.08% of 50 DAV
50 DAV is 750,900
|
$27.00
-5.63%
|
8/27/2010
|
$19.91
|
PP = $19.75
|
|
MB = $20.74
|
Most Recent Note - 9/30/2010 3:16:13 PM
G - Hit a new 52-week high and all-time high today then reversed into the red following 9 consecutive gains. Support to watch is prior chart highs in the $19-20 area. Disciplined investors do not chase stocks that are extended from a sound base.
>>> The latest Featured Stock Update with an annotated graph appeared on 8/27/2010. Click here.
View all notes |
Alert me of new notes |
CANSLIM.net Company Profile |
SEC |
Zacks Reports |
StockTalk |
News |
Chart |
Request a new note
C
A N
S L
I M
|
IGTE
-
NASDAQ
Igate Corp
COMPUTER SOFTWARE and SERVICES - Information Technology Service
|
$17.50
|
-0.50
-2.78% |
$18.04
|
377,161
95.15% of 50 DAV
50 DAV is 396,400
|
$19.45
-10.03%
|
9/8/2010
|
$17.29
|
PP = $18.26
|
|
MB = $19.17
|
Most Recent Note - 10/4/2010 2:32:32 PM
Y - Down for a 4th consecutive loss today, slumping further below its pivot point and again trading near important chart support at its 50 DMA line. More damaging losses would raise concerns and trigger technical sell signals.
>>> The latest Featured Stock Update with an annotated graph appeared on 9/10/2010. Click here.
View all notes |
Alert me of new notes |
CANSLIM.net Company Profile |
SEC |
Zacks Reports |
StockTalk |
News |
Chart |
Request a new note
C
A N
S L
I M
|
Symbol/Exchange
Company Name
Industry Group |
PRICE |
CHANGE
(%Change) |
Day High |
Volume
(% DAV)
(% 50 day avg vol) |
52 Wk Hi
% From Hi |
Featured
Date |
Price
Featured |
Pivot Featured |
|
Max Buy |
JOBS
-
NASDAQ
Fifty One Job Inc Ads
DIVERSIFIED SERVICES - Staffing and; Outsourcing Service
|
$39.72
|
+0.76
1.95% |
$40.00
|
216,421
147.53% of 50 DAV
50 DAV is 146,700
|
$39.19
1.35%
|
9/16/2010
|
$31.59
|
PP = $30.40
|
|
MB = $31.92
|
Most Recent Note - 10/1/2010 4:38:31 PM
G - Finished at a new high close with a gain on near average volume. Stubbornly holding its ground after a recent streak of volume-driven gains, very extended from a sound base. Prior highs in the $30 area define chart support.
>>> The latest Featured Stock Update with an annotated graph appeared on 9/16/2010. Click here.
View all notes |
Alert me of new notes |
CANSLIM.net Company Profile |
SEC |
Zacks Reports |
StockTalk |
News |
Chart |
Request a new note
C
A N
S L
I M
|
MELI
-
NASDAQ
Mercadolibre Inc
INTERNET - Internet Software and; Services
|
$66.79
|
-4.56
-6.39% |
$71.35
|
2,275,707
272.28% of 50 DAV
50 DAV is 835,800
|
$76.81
-13.05%
|
5/13/2010
|
$54.21
|
PP = $55.85
|
|
MB = $58.64
|
Most Recent Note - 10/4/2010 11:13:10 AM
G - Violated its 50 DMA line today with volume running at an above average pace behind a damaging loss. It may find support near that important short-term average and continue its ascent, but steep declines in the past (best viewed on a weekly chart) are a reminder to always use proper trading discipline.
>>> The latest Featured Stock Update with an annotated graph appeared on 8/26/2010. Click here.
View all notes |
Alert me of new notes |
CANSLIM.net Company Profile |
SEC |
Zacks Reports |
StockTalk |
News |
Chart |
Request a new note
C
A N
S L
I M
|
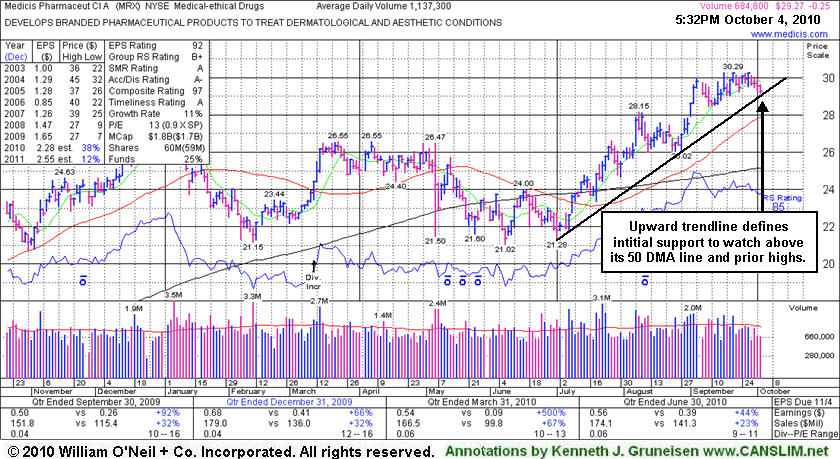
MRX
-
NYSE
Medicis Pharmaceut Cl A
DRUGS - Biotechnology
|
$29.27
|
-0.25
-0.85% |
$29.62
|
684,815
60.21% of 50 DAV
50 DAV is 1,137,300
|
$30.29
-3.37%
|
8/12/2010
|
$26.88
|
PP = $26.71
|
|
MB = $28.05
|
Most Recent Note - 10/4/2010 5:28:22 PM
G - Small loss on light volume today, still hovering in a tight range with volume totals cooling. Prior highs in the $28 area define the initial chart support level to watch.
>>> The latest Featured Stock Update with an annotated graph appeared on 10/4/2010. Click here.
View all notes |
Alert me of new notes |
CANSLIM.net Company Profile |
SEC |
Zacks Reports |
StockTalk |
News |
Chart |
Request a new note
C
A N
S L
I M
|
MWIV
-
NASDAQ
M W I Veterinary Supply
HEALTH SERVICES - Medical Instruments and; Supplies
|
$55.56
|
-1.06
-1.87% |
$56.88
|
50,304
70.16% of 50 DAV
50 DAV is 71,700
|
$58.74
-5.41%
|
7/29/2010
|
$52.05
|
PP = $52.09
|
|
MB = $54.69
|
Most Recent Note - 10/1/2010 4:41:30 PM
G - Volume totals have been cooling while stubbornly holding its ground near all-time highs. No overhead supply remains to act as resistance. Its 50 DMA line defines important chart support.
>>> The latest Featured Stock Update with an annotated graph appeared on 9/7/2010. Click here.
View all notes |
Alert me of new notes |
CANSLIM.net Company Profile |
SEC |
Zacks Reports |
StockTalk |
News |
Chart |
Request a new note
C
A N
S L
I M
|
NEM
-
NYSE
Newmont Mining Corp
METALS and MINING - Gold
|
$62.74
|
-0.94
-1.48% |
$63.49
|
4,461,278
72.30% of 50 DAV
50 DAV is 6,170,700
|
$65.50
-4.21%
|
8/31/2010
|
$61.32
|
PP = $63.48
|
|
MB = $66.65
|
Most Recent Note - 10/4/2010 11:50:19 AM
Y - Down today amid widespread weakness in the group, slumping below its pivot point after enduring distributional pressure last week. Leadership in the Mining - Gold/Silver/Gems group (L criteria) is a nice reassurance.
>>> The latest Featured Stock Update with an annotated graph appeared on 9/14/2010. Click here.
View all notes |
Alert me of new notes |
CANSLIM.net Company Profile |
SEC |
Zacks Reports |
StockTalk |
News |
Chart |
Request a new note
C
A N
S L
I M
|
Symbol/Exchange
Company Name
Industry Group |
PRICE |
CHANGE
(%Change) |
Day High |
Volume
(% DAV)
(% 50 day avg vol) |
52 Wk Hi
% From Hi |
Featured
Date |
Price
Featured |
Pivot Featured |
|
Max Buy |
NEOG
-
NASDAQ
Neogen Corp
DRUGS - Diagnostic Substances
|
$33.14
|
+0.47
1.44% |
$33.20
|
80,305
76.26% of 50 DAV
50 DAV is 105,300
|
$34.76
-4.66%
|
9/1/2010
|
$30.79
|
PP = $30.49
|
|
MB = $32.01
|
Most Recent Note - 10/1/2010 4:44:05 PM
G- Loss today with slightly higher volume was indicative of mild distributional pressure . Prior highs in the $30 area define initial support to watch.
>>> The latest Featured Stock Update with an annotated graph appeared on 8/20/2010. Click here.
View all notes |
Alert me of new notes |
CANSLIM.net Company Profile |
SEC |
Zacks Reports |
StockTalk |
News |
Chart |
Request a new note
C
A N
S L
I M
|
NFLX
-
NASDAQ
Netflix Inc
SPECIALTY RETAIL - Music and Video Stores
|
$156.39
|
+1.73
1.12% |
$158.75
|
6,771,632
120.56% of 50 DAV
50 DAV is 5,616,900
|
$174.40
-10.33%
|
8/10/2010
|
$124.05
|
PP = $124.00
|
|
MB = $130.20
|
Most Recent Note - 10/1/2010 4:35:16 PM
G - Down today for a second consecutive loss with above average volume following a negative reversal at its all-time high. It is extended from a sound base pattern. Prior highs define important support to watch along with an upward trendline that comes into play well above its 50 DMA line.
>>> The latest Featured Stock Update with an annotated graph appeared on 10/1/2010. Click here.
View all notes |
Alert me of new notes |
CANSLIM.net Company Profile |
SEC |
Zacks Reports |
StockTalk |
News |
Chart |
Request a new note
C
A N
S L
I M
|
NTAP
-
NASDAQ
Netapp Inc
COMPUTER HARDWARE - Data Storage Devices
|
$49.33
|
+0.69
1.42% |
$49.89
|
6,729,463
81.61% of 50 DAV
50 DAV is 8,246,300
|
$51.40
-4.03%
|
9/8/2010
|
$46.98
|
PP = $44.99
|
|
MB = $47.24
|
Most Recent Note - 10/1/2010 4:45:31 PM
G - Down today for a second consecutive loss with above average volume. Extended from a sound base, support to watch is at prior chart highs near its latest pivot point.
>>> The latest Featured Stock Update with an annotated graph appeared on 9/8/2010. Click here.
View all notes |
Alert me of new notes |
CANSLIM.net Company Profile |
SEC |
Zacks Reports |
StockTalk |
News |
Chart |
Request a new note
C
A N
S L
I M
|
ORCL
-
NASDAQ
Oracle Corp
COMPUTER SOFTWARE and SERVICES - Application Software
|
$26.90
|
-0.29
-1.05% |
$27.36
|
36,782,495
101.51% of 50 DAV
50 DAV is 36,233,700
|
$27.61
-2.57%
|
9/20/2010
|
$27.32
|
PP = $26.73
|
|
MB = $28.07
|
Most Recent Note - 9/27/2010 5:45:16 PM
Y - Holding its ground in a tight trading range since its "breakaway gap" on 9/17/10 backed by 5 times average volume.
>>> The latest Featured Stock Update with an annotated graph appeared on 9/20/2010. Click here.
View all notes |
Alert me of new notes |
CANSLIM.net Company Profile |
SEC |
Zacks Reports |
StockTalk |
News |
Chart |
Request a new note
C
A N
S L
I M
|
PAY
-
NYSE
Verifone Systems Inc
COMPUTER HARDWARE - Transaction Automation Systems
|
$27.95
|
-0.51
-1.79% |
$28.54
|
1,707,268
117.00% of 50 DAV
50 DAV is 1,459,200
|
$31.40
-10.99%
|
8/25/2010
|
$24.30
|
PP = $23.74
|
|
MB = $24.93
|
Most Recent Note - 10/4/2010 2:34:27 PM
G - Down again today after a considerable loss with above average volume on the prior session negated its latest spike higher. Extended from a sound base, its prior highs in the $23 area define chart support.
>>> The latest Featured Stock Update with an annotated graph appeared on 8/30/2010. Click here.
View all notes |
Alert me of new notes |
CANSLIM.net Company Profile |
SEC |
Zacks Reports |
StockTalk |
News |
Chart |
Request a new note
C
A N
S L
I M
|
Symbol/Exchange
Company Name
Industry Group |
PRICE |
CHANGE
(%Change) |
Day High |
Volume
(% DAV)
(% 50 day avg vol) |
52 Wk Hi
% From Hi |
Featured
Date |
Price
Featured |
Pivot Featured |
|
Max Buy |
PRGO
-
NASDAQ
Perrigo Co
DRUGS - Drug Related Products
|
$64.18
|
-0.29
-0.45% |
$65.98
|
777,480
78.07% of 50 DAV
50 DAV is 995,900
|
$67.49
-4.90%
|
9/15/2010
|
$63.73
|
PP = $64.76
|
|
MB = $68.00
|
Most Recent Note - 9/27/2010 5:54:05 PM
Y - Pulled back today on lighter volume. Its 9/24/10 gap up gain with +50% above average volume for a new 52-week high triggered a technical buy signal with volume near the minimum guideline. It was first featured in the 9/15/10 mid-day report.
>>> The latest Featured Stock Update with an annotated graph appeared on 9/15/2010. Click here.
View all notes |
Alert me of new notes |
CANSLIM.net Company Profile |
SEC |
Zacks Reports |
StockTalk |
News |
Chart |
Request a new note
C
A N
S L
I M
|
RAX
-
NYSE
Rackspace Hosting Inc
INTERNET - Internet Software and; Services
|
$25.28
|
-0.49
-1.90% |
$26.12
|
2,097,364
92.80% of 50 DAV
50 DAV is 2,260,000
|
$26.50
-4.60%
|
9/21/2010
|
$22.84
|
PP = $23.61
|
|
MB = $24.79
|
Most Recent Note - 10/1/2010 1:37:28 PM
Y - Churning above average volume has recently been indicative of distributional pressure, yet it stubbornly has held its ground following a "breakaway gap" to a new 52-week high. Noted on 9/28/10 - "A breakaway gap is one exception where chasing a stock more than +5% above prior highs is permitted. While patient investors may watch for pullbacks, no overhead supply remains to hinder its progress."
>>> The latest Featured Stock Update with an annotated graph appeared on 9/21/2010. Click here.
View all notes |
Alert me of new notes |
CANSLIM.net Company Profile |
SEC |
Zacks Reports |
StockTalk |
News |
Chart |
Request a new note
C
A N
S L
I M
|
ROVI
-
NASDAQ
Rovi Corp
COMPUTER SOFTWARE andamp; SERVICES - Security Software andamp; Services
|
$49.24
|
-0.93
-1.85% |
$50.41
|
1,612,509
105.58% of 50 DAV
50 DAV is 1,527,300
|
$53.00
-7.09%
|
8/31/2010
|
$43.31
|
PP = $45.06
|
|
MB = $47.31
|
Most Recent Note - 9/30/2010 3:20:39 PM
G - Pulling back today under profit taking pressure after a streak of big gains on above average volume. It is extended from its latest base, and prior highs in the $45 area define chart support to watch now.
>>> The latest Featured Stock Update with an annotated graph appeared on 8/24/2010. Click here.
View all notes |
Alert me of new notes |
CANSLIM.net Company Profile |
SEC |
Zacks Reports |
StockTalk |
News |
Chart |
Request a new note
C
A N
S L
I M
|
SHOO
-
NASDAQ
Steven Madden Limited
CONSUMER NON-DURABLES - Textile - Apparel Footwear
|
$41.06
|
-0.14
-0.34% |
$42.00
|
167,744
37.98% of 50 DAV
50 DAV is 441,700
|
$42.57
-3.55%
|
9/15/2010
|
$38.94
|
PP = $40.27
|
|
MB = $42.28
|
Most Recent Note - 9/30/2010 3:56:06 PM
Y - Down on light volume today after 2 consecutive gains with above average volume for new 52-week highs. A solid gain on 9/28/10 with +50% above average volume triggered a technical buy signal.
>>> The latest Featured Stock Update with an annotated graph appeared on 9/29/2010. Click here.
View all notes |
Alert me of new notes |
CANSLIM.net Company Profile |
SEC |
Zacks Reports |
StockTalk |
News |
Chart |
Request a new note
C
A N
S L
I M
|
SLW
-
NYSE
Silver Wheaton Corp
METALS and; MINING - Silver
|
$26.16
|
-0.51
-1.91% |
$26.55
|
5,646,946
101.81% of 50 DAV
50 DAV is 5,546,600
|
$27.18
-3.75%
|
8/25/2010
|
$21.40
|
PP = $21.99
|
|
MB = $23.09
|
Most Recent Note - 10/4/2010 11:18:36 AM
G - Consolidating -5% off its 52-week high now after a streak of 11 consecutive weekly gains to all-time highs. Prior highs and its 50 DMA line in the $22 area define chart support to watch on pullbacks.
>>> The latest Featured Stock Update with an annotated graph appeared on 8/25/2010. Click here.
View all notes |
Alert me of new notes |
CANSLIM.net Company Profile |
SEC |
Zacks Reports |
StockTalk |
News |
Chart |
Request a new note
C
A N
S L
I M
|
Symbol/Exchange
Company Name
Industry Group |
PRICE |
CHANGE
(%Change) |
Day High |
Volume
(% DAV)
(% 50 day avg vol) |
52 Wk Hi
% From Hi |
Featured
Date |
Price
Featured |
Pivot Featured |
|
Max Buy |
SVR
-
NYSE
Syniverse Holdings Inc
TELECOMMUNICATIONS - Diversified Communication Serv
|
$21.65
|
-0.53
-2.39% |
$22.28
|
1,236,989
177.68% of 50 DAV
50 DAV is 696,200
|
$24.24
-10.68%
|
9/22/2010
|
$23.60
|
PP = $23.87
|
|
MB = $25.06
|
Most Recent Note - 10/4/2010 2:39:02 PM
G - Violated its 50 DMA line today, down for a 4th consecutive loss, trading near a recent chart low ($21.47) that defines important support to watch. Its Relative Strength rank has slumped under the 80+ guideline after promptly negating its latest breakout and encountering distributional pressure.
>>> The latest Featured Stock Update with an annotated graph appeared on 9/22/2010. Click here.
View all notes |
Alert me of new notes |
CANSLIM.net Company Profile |
SEC |
Zacks Reports |
StockTalk |
News |
Chart |
Request a new note
C
A N
S L
I M
|
UA
-
NYSE
Under Armour Inc Cl A
CONSUMER NON-DURABLES - Textile - Apparel Clothing
|
$44.84
|
-0.21
-0.47% |
$45.60
|
530,464
72.31% of 50 DAV
50 DAV is 733,600
|
$46.10
-2.73%
|
9/9/2010
|
$39.99
|
PP = $40.10
|
|
MB = $42.11
|
Most Recent Note - 9/28/2010 5:00:03 PM
G - Closed at a new 2010 high today with its 18th gain in 20 sessions. It is extended from its latest sound base pattern.
>>> The latest Featured Stock Update with an annotated graph appeared on 9/9/2010. Click here.
View all notes |
Alert me of new notes |
CANSLIM.net Company Profile |
SEC |
Zacks Reports |
StockTalk |
News |
Chart |
Request a new note
C
A N
S L
I M
|
UFPT
-
NASDAQ
U F P Tech Inc
CONSUMER NON-DURABLES - Packaging and Containers
|
$12.58
|
+0.09
0.75% |
$12.88
|
115,558
227.03% of 50 DAV
50 DAV is 50,900
|
$12.50
0.64%
|
9/16/2010
|
$11.20
|
PP = $11.69
|
|
MB = $12.27
|
Most Recent Note - 10/4/2010 12:48:03 PM
G - Hit another new 52-week high today, and its color code is changed to green after rallying beyond its "max buy" level. Its most recent gain helped trigger a technical buy signal while volume was +180% above average. No resistance remains due to overhead supply. With only 6.21 million shares outstanding (S criteria) any institutional buying or selling can lead to great price volatility. Few institutional investors (I criteria) own its shares, but the number of top-rated funds has increased from 6 in Sep '09 to 10 in Jun '10.
>>> The latest Featured Stock Update with an annotated graph appeared on 9/17/2010. Click here.
View all notes |
Alert me of new notes |
CANSLIM.net Company Profile |
SEC |
Zacks Reports |
StockTalk |
News |
Chart |
Request a new note
C
A N
S L
I M
|
ULTA
-
NASDAQ
Ulta Salon Cosm & Frag
SPECIALTY RETAIL - Specialty Retail, Other
|
$28.41
|
-0.94
-3.20% |
$29.63
|
633,953
102.09% of 50 DAV
50 DAV is 621,000
|
$30.19
-5.90%
|
9/3/2010
|
$26.36
|
PP = $25.89
|
|
MB = $27.18
|
Most Recent Note - 10/4/2010 2:15:09 PM
G - Down today with below average volume. Quietly consolidating well above prior highs in the $26 area that define support to watch now.
>>> The latest Featured Stock Update with an annotated graph appeared on 9/3/2010. Click here.
View all notes |
Alert me of new notes |
CANSLIM.net Company Profile |
SEC |
Zacks Reports |
StockTalk |
News |
Chart |
Request a new note
C
A N
S L
I M
|
VIT
-
NYSE
Vanceinfo Tech Inc Ads
COMPUTER SOFTWARE and SERVICES - Business Software and Services
|
$32.27
|
-0.22
-0.68% |
$32.95
|
513,648
80.67% of 50 DAV
50 DAV is 636,700
|
$33.30
-3.09%
|
7/8/2010
|
$25.20
|
PP = $26.58
|
|
MB = $27.91
|
Most Recent Note - 9/29/2010 1:12:35 PM
G - Holding its ground stubbornly at its all-time high. It is extended after rallying from a prior resistance level in the $26 area. Its 50 DMA line defines chart support to watch.
>>> The latest Featured Stock Update with an annotated graph appeared on 8/31/2010. Click here.
View all notes |
Alert me of new notes |
CANSLIM.net Company Profile |
SEC |
Zacks Reports |
StockTalk |
News |
Chart |
Request a new note
C
A N
S L
I M
|
Symbol/Exchange
Company Name
Industry Group |
PRICE |
CHANGE
(%Change) |
Day High |
Volume
(% DAV)
(% 50 day avg vol) |
52 Wk Hi
% From Hi |
Featured
Date |
Price
Featured |
Pivot Featured |
|
Max Buy |
WCRX
-
NASDAQ
Warner Chilcott Plc
DRUGS - Drug Manufacturers - Other
|
$21.35
|
-0.18
-0.84% |
$21.97
|
2,153,928
79.69% of 50 DAV
50 DAV is 2,702,800
|
$23.53
-9.26%
|
8/23/2010
|
$21.04
|
PP = $20.84
|
|
MB = $21.88
|
Most Recent Note - 10/1/2010 4:32:56 PM
G - Gapped down today for a loss with heavy volume, a sign of more worrisome distributional pressure. Slumping near prior highs and its 50 DMA line defining chart support in the $20-21 area.
>>> The latest Featured Stock Update with an annotated graph appeared on 8/23/2010. Click here.
View all notes |
Alert me of new notes |
CANSLIM.net Company Profile |
SEC |
Zacks Reports |
StockTalk |
News |
Chart |
Request a new note
C
A N
S L
I M
|