***Last / Change / Volume data in this table is the closing quote data***
Symbol/Exchange
Company Name
Industry Group |
PRICE |
CHANGE
(%Change) |
Day High |
Volume
(% DAV)
(% 50 day avg vol) |
52 Wk Hi
% From Hi |
Featured
Date |
Price
Featured |
Pivot Featured |
|
Max Buy |
AVG
-
NYSE
A V G Technologies N.V.
INTERNET - Internet Software and Services
|
$23.94
|
-1.09
-4.35% |
$24.88
|
1,634,904
182.79% of 50 DAV
50 DAV is 894,400
|
$26.56
-9.85%
|
9/13/2013
|
$23.06
|
PP = $23.88
|
|
MB = $25.07
|
 Most Recent Note - 9/30/2013 11:51:30 AM
G - Down considerably with today's 4th consecutive loss, sinking near prior highs in the $23 area defining initial support to watch above its 50 DMA line ($22.62 now).
>>> The latest Featured Stock Update with an annotated graph appeared on 9/13/2013. Click here.
View all notes |
Alert me of new notes |
CANSLIM.net Company Profile |
SEC |
Zacks Reports |
StockTalk |
News |
Chart |
Request a new note
C
A N
S L
I M


|
BITA
-
NYSE
Bitauto Hldgs Ltd Ads
INTERNET - Internet Information Providers
|
$16.12
|
-0.72
-4.28% |
$16.83
|
430,608
102.67% of 50 DAV
50 DAV is 419,400
|
$18.10
-10.94%
|
9/24/2013
|
$16.40
|
PP = $17.31
|
|
MB = $18.18
|
Most Recent Note - 9/30/2013 12:07:29 PM
Y - Pulling back today following Friday's gain with slightly above average volume for a best-ever close. New pivot point cited based on its 9/09/13 high plus 10 cents after an advanced "3-weeks tight" base. A volume-driven gain above its pivot point may trigger a new (or add-on) technical buy signal. Its 50 DMA line defines important support.
>>> The latest Featured Stock Update with an annotated graph appeared on 9/3/2013. Click here.
View all notes |
Alert me of new notes |
CANSLIM.net Company Profile |
SEC |
Zacks Reports |
StockTalk |
News |
Chart |
Request a new note
C
A N
S L
I M
|
CELG
-
NASDAQ
Celgene Corp
DRUGS - Drug Manufacturers - Major
|
$154.14
|
-0.47
-0.31% |
$156.04
|
3,613,315
145.08% of 50 DAV
50 DAV is 2,490,500
|
$154.99
-0.55%
|
9/12/2013
|
$149.50
|
PP = $150.02
|
|
MB = $157.52
|
Most Recent Note - 9/30/2013 12:08:55 PM
Y - Hitting another new 52-week high today. Finished strong on Friday with +53% above average volume while rising above its previously cited pivot point confirming a technical buy signal. Its 50 DMA line ($143.44 now) defines near-term support to watch.
>>> The latest Featured Stock Update with an annotated graph appeared on 9/20/2013. Click here.
View all notes |
Alert me of new notes |
CANSLIM.net Company Profile |
SEC |
Zacks Reports |
StockTalk |
News |
Chart |
Request a new note
C
A N
S L
I M
|
EGBN
-
NASDAQ
Eagle Bancorp Inc
BANKING - Regional - Mid-Atlantic Banks
|
$28.29
|
+0.39
1.40% |
$28.38
|
85,186
113.58% of 50 DAV
50 DAV is 75,000
|
$28.45
-0.56%
|
9/16/2013
|
$27.48
|
PP = $27.77
|
|
MB = $29.16
|
Most Recent Note - 9/24/2013 12:22:51 PM
Y - Hitting a new 52-week high with above average volume behind today's 3rd consecutive gain while rallying above the pivot point based on its 7/25/13 high plus 10 cents. A strong finish may help to clinch a convincing technical buy signal.
>>> The latest Featured Stock Update with an annotated graph appeared on 9/16/2013. Click here.
View all notes |
Alert me of new notes |
CANSLIM.net Company Profile |
SEC |
Zacks Reports |
StockTalk |
News |
Chart |
Request a new note
C
A N
S L
I M
|
FLT
-
NYSE
Fleetcor Technologies
DIVERSIFIED SERVICES - Business/Management Services
|
$110.16
|
-1.01
-0.91% |
$111.26
|
522,260
81.60% of 50 DAV
50 DAV is 640,000
|
$112.50
-2.08%
|
8/19/2013
|
$99.01
|
PP = $100.97
|
|
MB = $106.02
|
Most Recent Note - 9/25/2013 12:30:23 PM
G - Hovering in a tight range near all-time highs after completing a Secondary Offering on 9/11/13. Its 50 DMA line and recent lows near $100 define important near term support to watch on pullbacks. FLT has traded up as much as +58% since first featured in yellow in the mid-day report on 3/21/13 (read here).
>>> The latest Featured Stock Update with an annotated graph appeared on 9/6/2013. Click here.
View all notes |
Alert me of new notes |
CANSLIM.net Company Profile |
SEC |
Zacks Reports |
StockTalk |
News |
Chart |
Request a new note
C
A N
S L
I M
|
Symbol/Exchange
Company Name
Industry Group |
PRICE |
CHANGE
(%Change) |
Day High |
Volume
(% DAV)
(% 50 day avg vol) |
52 Wk Hi
% From Hi |
Featured
Date |
Price
Featured |
Pivot Featured |
|
Max Buy |
GNRC
-
NYSE
Generac Hldgs Inc
CONSUMER DURABLES - Electronic Equipment
|
$42.64
|
-0.38
-0.88% |
$42.72
|
747,985
93.78% of 50 DAV
50 DAV is 797,600
|
$44.30
-3.75%
|
9/12/2013
|
$41.40
|
PP = $43.27
|
|
MB = $45.43
|
Most Recent Note - 9/30/2013 11:55:20 AM
Y - Pulling back near its 50 DMA line today. It stalled after triggering a technical buy signal on 9/20/13. Disciplined investors limit losses by selling if any stock falls more than -7% from their purchase price.
>>> The latest Featured Stock Update with an annotated graph appeared on 9/23/2013. Click here.
View all notes |
Alert me of new notes |
CANSLIM.net Company Profile |
SEC |
Zacks Reports |
StockTalk |
News |
Chart |
Request a new note
C
A N
S L
I M
|
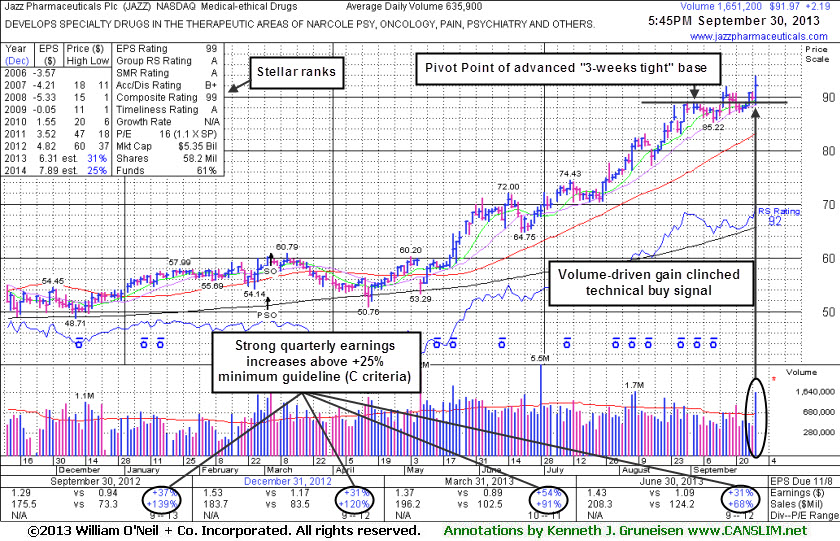
JAZZ
-
NASDAQ
Jazz Pharmaceuticals Plc
DRUGS - Biotechnology
|
$91.97
|
+2.19
2.44% |
$93.84
|
1,651,760
259.75% of 50 DAV
50 DAV is 635,900
|
$91.93
0.04%
|
9/30/2013
|
$93.20
|
PP = $89.10
|
|
MB = $93.56
|
Most Recent Note - 9/30/2013 6:04:16 PM
Y- Finished strong today with a solid gain backed by +160% above average volume while rallying above the pivot point cited based its 9/03/13 high plus 10 cents after an advanced "3-weeks tight" base. See the latest FSU analysis for more details and a new annotated graph.
>>> The latest Featured Stock Update with an annotated graph appeared on 9/30/2013. Click here.
View all notes |
Alert me of new notes |
CANSLIM.net Company Profile |
SEC |
Zacks Reports |
StockTalk |
News |
Chart |
Request a new note
C
A N
S L
I M
|
KORS
-
NYSE
Michael Kors Hldgs Ltd
RETAIL - Apparel Stores
|
$74.52
|
+0.07
0.09% |
$74.79
|
1,587,872
45.11% of 50 DAV
50 DAV is 3,520,300
|
$78.62
-5.22%
|
8/6/2013
|
$69.66
|
PP = $66.28
|
|
MB = $69.59
|
Most Recent Note - 9/27/2013 5:21:05 PM
G - Extended from its prior base and consolidating near its 52-week high. Its 50 DMA line (now $71.33) defines support above prior highs in the $66 area. See the latest FSU analysis for more details and a new annotated graph.
>>> The latest Featured Stock Update with an annotated graph appeared on 9/27/2013. Click here.
View all notes |
Alert me of new notes |
CANSLIM.net Company Profile |
SEC |
Zacks Reports |
StockTalk |
News |
Chart |
Request a new note
C
A N
S L
I M
|
LOPE
-
NASDAQ
Grand Canyon Education
DIVERSIFIED SERVICES - Education and; Training Services
|
$40.24
|
-0.21
-0.52% |
$40.36
|
464,492
118.01% of 50 DAV
50 DAV is 393,600
|
$40.80
-1.37%
|
6/19/2013
|
$31.47
|
PP = $34.17
|
|
MB = $35.88
|
Most Recent Note - 9/25/2013 5:51:11 PM
G - Holding its ground near its all-time high while enduring mild distributional pressure. Fundamental concerns remain while technical action has been reassuring.
>>> The latest Featured Stock Update with an annotated graph appeared on 9/12/2013. Click here.
View all notes |
Alert me of new notes |
CANSLIM.net Company Profile |
SEC |
Zacks Reports |
StockTalk |
News |
Chart |
Request a new note
C
A N
S L
I M
|
MRLN
-
NASDAQ
Marlin Business Services
DIVERSIFIED SERVICES - Rental and Leasing Services
|
$24.96
|
-0.42
-1.65% |
$25.18
|
37,888
105.83% of 50 DAV
50 DAV is 35,800
|
$26.96
-7.42%
|
9/9/2013
|
$23.75
|
PP = $24.03
|
|
MB = $25.23
|
Most Recent Note - 9/25/2013 5:52:09 PM
G - Hit another new 52-week high today. Stubbornly holding its ground and wedging higher with gains lacking great volume conviction since recently paying a $2.00 per share Special Dividend (latest Pivot Point, Max Buy and Featured Price were adjusted to accordingly).
>>> The latest Featured Stock Update with an annotated graph appeared on 9/9/2013. Click here.
View all notes |
Alert me of new notes |
CANSLIM.net Company Profile |
SEC |
Zacks Reports |
StockTalk |
News |
Chart |
Request a new note
C
A N
S L
I M
|
Symbol/Exchange
Company Name
Industry Group |
PRICE |
CHANGE
(%Change) |
Day High |
Volume
(% DAV)
(% 50 day avg vol) |
52 Wk Hi
% From Hi |
Featured
Date |
Price
Featured |
Pivot Featured |
|
Max Buy |
PCLN
-
NASDAQ
Priceline.Com Inc
INTERNET - Internet Software and Services
|
$1,010.95
|
-4.02
-0.40% |
$1,017.49
|
467,939
77.78% of 50 DAV
50 DAV is 601,600
|
$1,019.95
-0.88%
|
9/13/2013
|
$966.82
|
PP = $995.08
|
|
MB = $1,044.83
|
Most Recent Note - 9/26/2013 5:50:42 PM
Y - Still wedging above its new pivot point cited based on its 8/09/13 high plus 10 cents with gains lacking great volume conviction. Volume-driven gains are necessary to clinch a proper new (or add-on) technical buy signal.
>>> The latest Featured Stock Update with an annotated graph appeared on 9/19/2013. Click here.
View all notes |
Alert me of new notes |
CANSLIM.net Company Profile |
SEC |
Zacks Reports |
StockTalk |
News |
Chart |
Request a new note
C
A N
S L
I M
|
PRAA
-
NASDAQ
Portfolio Recovery Assoc
DIVERSIFIED SERVICES - Business/Management Services
|
$59.93
|
+0.34
0.57% |
$60.00
|
485,972
96.69% of 50 DAV
50 DAV is 502,600
|
$61.60
-2.71%
|
7/31/2013
|
$51.43
|
PP = $54.72
|
|
MB = $57.46
|
Most Recent Note - 9/27/2013 4:12:31 PM
G - Small gap down today on light volume, pulling back from new 52-week highs after 4 consecutive gains on light volume, wedging higher and getting more extended from its prior base. See the latest FSU analysis for more details and an annotated graph.
>>> The latest Featured Stock Update with an annotated graph appeared on 9/26/2013. Click here.
View all notes |
Alert me of new notes |
CANSLIM.net Company Profile |
SEC |
Zacks Reports |
StockTalk |
News |
Chart |
Request a new note
C
A N
S L
I M
|
PRLB
-
NYSE
Proto Labs Inc
MANUFACTURING - Small Tools and Accessories
|
$76.39
|
+0.07
0.09% |
$76.86
|
372,768
92.29% of 50 DAV
50 DAV is 403,900
|
$80.66
-5.29%
|
7/29/2013
|
$64.86
|
PP = $67.50
|
|
MB = $70.88
|
Most Recent Note - 9/26/2013 5:54:00 PM
G - Encountering mild distributional pressure and pulling back from a new 52-week high hit this week. Support to watch is at its 50 DMA line.
>>> The latest Featured Stock Update with an annotated graph appeared on 9/25/2013. Click here.
View all notes |
Alert me of new notes |
CANSLIM.net Company Profile |
SEC |
Zacks Reports |
StockTalk |
News |
Chart |
Request a new note
C
A N
S L
I M
|
SFUN
-
NYSE
Soufun Hldgs Ltd Ads A
INTERNET - Internet Information Providers
|
$51.64
|
+2.16
4.37% |
$52.45
|
2,601,713
258.80% of 50 DAV
50 DAV is 1,005,300
|
$53.77
-3.96%
|
7/16/2013
|
$29.54
|
PP = $27.90
|
|
MB = $29.30
|
Most Recent Note - 9/30/2013 12:48:50 PM
G - Rallying near its 52-week high with above average volume behind today's solid gain. Prior reports cautioned - "This high-ranked Internet - Content firm may go on to produce more climactic gains, but it is very extended from any sound base. Recent highs near $42 define initial support to watch above its 50 DMA line."
>>> The latest Featured Stock Update with an annotated graph appeared on 8/30/2013. Click here.
View all notes |
Alert me of new notes |
CANSLIM.net Company Profile |
SEC |
Zacks Reports |
StockTalk |
News |
Chart |
Request a new note
C
A N
S L
I M
|
SSNC
-
NASDAQ
S S & C Technologies
COMPUTER SOFTWARE and SERVICES - Application Software
|
$38.10
|
-0.40
-1.04% |
$38.28
|
256,305
59.65% of 50 DAV
50 DAV is 429,700
|
$39.94
-4.61%
|
9/5/2013
|
$36.01
|
PP = $38.90
|
|
MB = $40.85
|
Most Recent Note - 9/27/2013 5:23:22 PM
Y - Volume totals have been cooling while holding its ground in a tight range near its 52-week high and near the pivot point cited based on its 8/02/13 high plus 10 cents. Completed a Secondary Offering on 9/20/13 while perched at all-time highs.
>>> The latest Featured Stock Update with an annotated graph appeared on 9/5/2013. Click here.
View all notes |
Alert me of new notes |
CANSLIM.net Company Profile |
SEC |
Zacks Reports |
StockTalk |
News |
Chart |
Request a new note
C
A N
S L
I M
|
Symbol/Exchange
Company Name
Industry Group |
PRICE |
CHANGE
(%Change) |
Day High |
Volume
(% DAV)
(% 50 day avg vol) |
52 Wk Hi
% From Hi |
Featured
Date |
Price
Featured |
Pivot Featured |
|
Max Buy |
SSYS
-
NASDAQ
Stratasys Ltd
COMPUTER HARDWARE - Computer Peripherals
|
$101.26
|
-0.21
-0.21% |
$103.20
|
698,132
64.31% of 50 DAV
50 DAV is 1,085,500
|
$113.49
-10.78%
|
7/8/2013
|
$91.44
|
PP = $95.00
|
|
MB = $99.75
|
Most Recent Note - 9/27/2013 4:14:20 PM
G - Pulled back today on light volume, consolidating above its 50 DMA line. Completed a new Public Offering on 9/13/13. It has not formed a sound base.
>>> The latest Featured Stock Update with an annotated graph appeared on 9/10/2013. Click here.
View all notes |
Alert me of new notes |
CANSLIM.net Company Profile |
SEC |
Zacks Reports |
StockTalk |
News |
Chart |
Request a new note
C
A N
S L
I M
|
STMP
-
NASDAQ
Stamps.Com Inc
INTERNET - Internet Software and Services
|
$45.93
|
+0.41
0.90% |
$46.00
|
77,831
63.80% of 50 DAV
50 DAV is 122,000
|
$46.47
-1.16%
|
9/24/2013
|
$45.54
|
PP = $46.57
|
|
MB = $48.90
|
Most Recent Note - 9/24/2013 6:07:40 PM
Y - Finished at a best-ever close with today's gain on light volume. A new pivot point was cited based on its 8/01/13 high plus 10 cents. Recently found encouraging support at its 50 DMA line. Volume-driven gains to new highs may trigger a new (or add-on) technical buy signal. See the latest FSU analysis for more details and a new annotated graph.
>>> The latest Featured Stock Update with an annotated graph appeared on 9/24/2013. Click here.
View all notes |
Alert me of new notes |
CANSLIM.net Company Profile |
SEC |
Zacks Reports |
StockTalk |
News |
Chart |
Request a new note
C
A N
S L
I M
|
TBBK
-
NASDAQ
Bancorp Inc
BANKING - Regional - Mid-Atlantic Banks
|
$17.69
|
-0.16
-0.90% |
$17.90
|
189,236
104.09% of 50 DAV
50 DAV is 181,800
|
$18.61
-4.94%
|
9/4/2013
|
$16.26
|
PP = $16.79
|
|
MB = $17.63
|
Most Recent Note - 9/25/2013 5:49:36 PM
G - Encountered distributional pressure today with a loss on higher volume. Prior highs and its 50 DMA line define important support to watch on pullbacks.
>>> The latest Featured Stock Update with an annotated graph appeared on 9/4/2013. Click here.
View all notes |
Alert me of new notes |
CANSLIM.net Company Profile |
SEC |
Zacks Reports |
StockTalk |
News |
Chart |
Request a new note
C
A N
S L
I M
|
TNGO
-
NASDAQ
Tangoe Inc
COMPUTER SOFTWARE and SERVICES - Technical and System Software
|
$23.83
|
-0.10
-0.42% |
$24.20
|
537,469
100.57% of 50 DAV
50 DAV is 534,400
|
$24.60
-3.12%
|
9/12/2013
|
$21.30
|
PP = $23.15
|
|
MB = $24.31
|
Most Recent Note - 9/25/2013 5:55:12 PM
Y - Finished near the session high today with a solid gain backed by only +19% above average volume. Convincing volume-driven gains above its pivot point cited based on its May 2012 high plus 10 cents may signal the beginning of a substantial leg higher.
>>> The latest Featured Stock Update with an annotated graph appeared on 9/17/2013. Click here.
View all notes |
Alert me of new notes |
CANSLIM.net Company Profile |
SEC |
Zacks Reports |
StockTalk |
News |
Chart |
Request a new note
C
A N
S L
I M
|
VRX
-
NYSE
Valeant Pharmaceuticals
DRUGS - Drug Manufacturers - Other
|
$104.33
|
-0.39
-0.37% |
$105.12
|
782,145
68.15% of 50 DAV
50 DAV is 1,147,700
|
$106.98
-2.48%
|
9/11/2013
|
$100.26
|
PP = $105.50
|
|
MB = $110.78
|
Most Recent Note - 9/24/2013 5:36:05 PM
Y- Today's gain was backed by +67% above average volume, however it remains below the pivot point. Gains above the pivot point with volume at least +40% above average are needed to trigger a proper technical buy signal. Recent insider buying while trading near its highs has been noted as an encouraging sign.
>>> The latest Featured Stock Update with an annotated graph appeared on 9/11/2013. Click here.
View all notes |
Alert me of new notes |
CANSLIM.net Company Profile |
SEC |
Zacks Reports |
StockTalk |
News |
Chart |
Request a new note
C
A N
S L
I M
|
Symbol/Exchange
Company Name
Industry Group |
PRICE |
CHANGE
(%Change) |
Day High |
Volume
(% DAV)
(% 50 day avg vol) |
52 Wk Hi
% From Hi |
Featured
Date |
Price
Featured |
Pivot Featured |
|
Max Buy |
YNDX
-
NASDAQ
Yandex N V Class A
INTERNET - Internet Information Providers
|
$36.42
|
-0.38
-1.03% |
$36.50
|
2,155,676
89.67% of 50 DAV
50 DAV is 2,403,900
|
$38.10
-4.41%
|
9/5/2013
|
$34.24
|
PP = $34.79
|
|
MB = $36.53
|
Most Recent Note - 9/25/2013 12:56:07 PM
G - Perched near its 52-week high and stubbornly holding its ground. Extended from a sound base after volume-driven gains lifted it above its "max buy" level. Prior highs in the $34 area and its 50 DMA line define support to watch on pullbacks.
>>> The latest Featured Stock Update with an annotated graph appeared on 9/18/2013. Click here.
View all notes |
Alert me of new notes |
CANSLIM.net Company Profile |
SEC |
Zacks Reports |
StockTalk |
News |
Chart |
Request a new note
C
A N
S L
I M
|