You are not logged in.
This means you
CAN ONLY VIEW reports that were published prior to Monday, April 14, 2025.
You
MUST UPGRADE YOUR MEMBERSHIP if you want to see any current reports.
AFTER MARKET UPDATE - WEDNESDAY, SEPTEMBER 30TH, 2009
Previous After Market Report Next After Market Report >>>
|
|
|
|
DOW |
-29.92 |
9,712.28 |
-0.31% |
|
Volume |
1,773,900,070 |
+50% |
|
Volume |
2,765,892,200 |
+28% |
|
NASDAQ |
-1.62 |
2,122.42 |
-0.08% |
|
Advancers |
1,253 |
40% |
|
Advancers |
1,030 |
36% |
|
S&P 500 |
-3.53 |
1,057.08 |
-0.33% |
|
Decliners |
1,759 |
56% |
|
Decliners |
1,722 |
60% |
|
Russell 2000 |
-6.17 |
604.28 |
-1.01% |
|
52 Wk Highs |
191 |
|
|
52 Wk Highs |
75 |
|
|
S&P 600 |
-3.56 |
317.43 |
-1.11% |
|
52 Wk Lows |
1 |
|
|
52 Wk Lows |
12 |
|
|
 |
Major Averages Close Out Very Strong Third Quarter
Adam Sarhan, Contributing Writer,
The major averages ended lower on Wednesday after a weak regional economic report, but the month and quarter still ended on a strong note. Volume was higher than the prior session which marked another distribution day for the NYSE indexes, but the loss was too small to be considered distribution day for the Nasdaq Composite Index. Decliners led advancers by about a 3-to-2 ratio on the NYSE and on the Nasdaq exchange. There were 21 high-ranked companies from the CANSLIM.net Leaders List that made a new 52-week high and appeared on the CANSLIM.net BreakOuts Page, lower from the 23 issues that appeared on the prior session. New 52-week highs still outnumbered new 52-week lows on both exchanges.
The Chicago Purchasing Managers Index was below estimates which sent the Dow Jones Industrial Average down over 100 points before a late-day rally helped send the blue chip index and all others back to closes in the upper half of their intra-day ranges. Since March, the major averages have rallied smartly, even in the face of negative economic data, which is an encouraging sign. The Chicago PMI slid to 46.1 in September rather than rising to the 52 that economists expected. The index fell below the boom/bust line of 50. It is considered a precursor to the National Institute for Supply Management Index to be released on Thursday. The market also had some positive economic news, the Commerce Department revised its reading for the second-quarter gross domestic product. The government said GDP, the broadest measure of the economy, fell to a pace of just +0.7% in the spring. The new reading was better than the annualized -1.1% decline that economists were expecting.
For the quarter the Dow Jones Industrial Average rose +14.3%, which was its largest quarterly gain since the +17.1% surge in the fourth quarter of 1998, during the dot-com bubble. The benchmark Standard & Poor's 500 Index surged +15.0% for the quarter. The Dow has rallied in 6 out of the past 7 months which is a very strong sign. Even stronger is the fact that the S&P 500 and Nasdaq Composite indices have both ended higher every month since March - posting gains in 7 consecutive months). Looking forward, as long as the market continues advancing this rally remains intact and investors should stand ready to buy ideal looking breakouts. If the distributional action we have seen this week continues, however, it will be noted in ongoing commentaries as a warning for investors to be more proactive in locking in profits and reducing their market exposure.
PICTURED: The tech-heavy Nasdaq Composite Index is strong. It surged +19.6% in the third quarter! Its last streak of 7 straight monthly gains was in 2003, which marked the beginning of a multi-year Bull Market.
|
|
|
 |
Healthcare Index Slumping In Recent Weeks
Kenneth J. Gruneisen - Passed the CAN SLIM® Master's Exam
Group action was mixed on Wednesday's session as the Healthcare Index ($HMO -1.81%) slumped to a big loss while the Biotechnology Index ($BTK -0.26%) and Retail Index ($RLX -0.16%) edged lower. Energy shares slipped slightly as the Oil Services Index ($OSX -0.60%) and Integrated Oil Index ($XOI -0.39%) finished modestly lower. Financial shares were mixed and little changed on the session as the Broker/Dealer Index ($XBD +0.27%) inched higher and the Bank Index ($BKX -0.13%) inched lower. Tech shares posted small gains as the Internet Index ($IIX +0.29%), Networking Index ($NWX +0.52%), Semiconductor Index ($SOX +0.85%) each gained less than +1%. Mostly lackluster action made the Gold & Silver Index ($XAU +1.32%) a standout leader.
Charts courtesy www.stockcharts.com
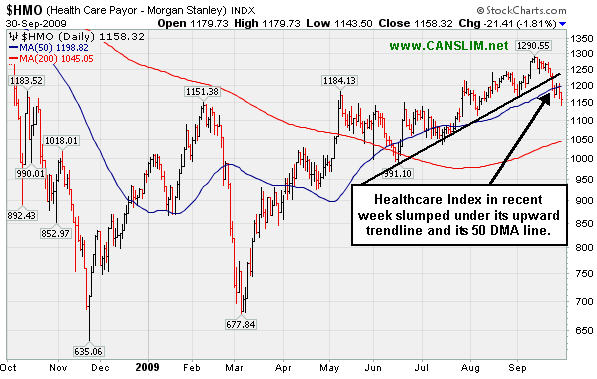
PICTURED: The Healthcare Index ($HMO -1.81%) in recent weeks has slumped under its upward trendline and its 50 DMA line. The weaker action does not bode well for healthcare stocks in the near term.
| Oil Services |
$OSX |
192.56 |
-1.17 |
-0.60% |
+58.63% |
| Healthcare |
$HMO |
1,158.32 |
-21.41 |
-1.81% |
+20.64% |
| Integrated Oil |
$XOI |
1,024.44 |
-4.01 |
-0.39% |
+4.57% |
| Semiconductor |
$SOX |
325.75 |
+2.75 |
+0.85% |
+53.53% |
| Networking |
$NWX |
237.53 |
+1.22 |
+0.52% |
+65.08% |
| Internet |
$IIX |
218.96 |
+0.64 |
+0.29% |
+63.68% |
| Broker/Dealer |
$XBD |
119.45 |
+0.32 |
+0.27% |
+54.19% |
| Retail |
$RLX |
377.50 |
-0.62 |
-0.16% |
+35.18% |
| Gold & Silver |
$XAU |
165.41 |
+2.15 |
+1.32% |
+33.56% |
| Bank |
$BKX |
47.20 |
-0.06 |
-0.13% |
+6.50% |
| Biotech |
$BTK |
922.95 |
-2.44 |
-0.26% |
+42.61% |
|
|
|
 |
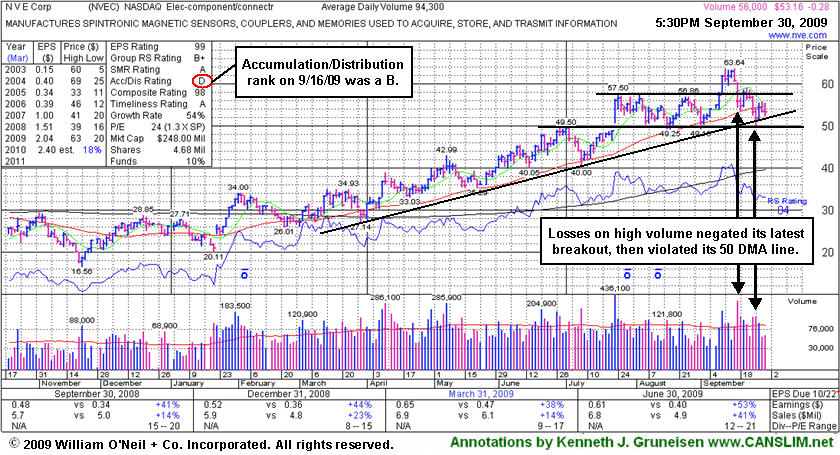
Negative Reversal Followed By Distributional Action
Kenneth J. Gruneisen - Passed the CAN SLIM® Master's Exam
NVE Corp (NVEC -$0.28 or -0.52% to $53.16) is a high-ranked leader in the Electronics - Components/Connectors group. It ended with a small loss today on lighter volume, slumping further below its 50-day moving average (DMA) line which has now acted as a resistance level. Despite some encouraging signs of support arriving near its upward trendline and above prior chart lows in the $49 area, after recent distributional pressure it needs more time to form a new sound base. Meanwhile, further deterioration would trigger additional worrisome sell signals. It was noted when closes under its 50 DMA line for the first time since March raised concerns and triggered a technical sell signal. Its Accumulation/Distribution rank is down to a D now, having fallen from a B on 9/16/09 when it last appeared in this section under the headline, "Negative Reversal, Yet Still Above Max Buy Level." That negative reversal was followed by the gap down loss on heavy volume that negated its latest breakout. This makes a good example for study of how negative reversals can signal a change in trend.
Keep in mind its small supply (the S criteria) of only 4.68 million shares outstanding which can contribute to greater than usual volatility. Be mindful of its still rather minuscule sales revenues. These concerns heighten the need for great discipline in trading (buying AND selling). NVEC was first featured in yellow at $33.85 in the Friday, March 13, 2009 Mid-Day Breakouts Report (read here). This high-ranked Electronics - Components industry group leader has a good quarterly and annual earnings growth history (C & A criteria) and even showed acceleration in the latest report for the quarter ended June 30, 2009. In that period sales revenues were up +41% and earnings were up +53%, even bigger percentage increases than prior solid (+25% or better) earnings comparisons. That is what we call earnings growth acceleration, and it is a very encouraging characteristic commonly seen in the market's biggest winners.
|
|
|
Color Codes Explained :
Y - Better candidates highlighted by our
staff of experts.
G - Previously featured
in past reports as yellow but may no longer be buyable under the
guidelines.
***Last / Change / Volume quote data in this table corresponds with the timestamp on the note***
Symbol/Exchange
Company Name
Industry Group |
Last |
Chg. |
Vol
% DAV |
Date Featured |
Price Featured |
Latest Pivot Point
Featured |
Status |
| Latest Max Buy Price |
ARO
- NYSE
Aeropostale Inc
RETAIL - Apparel Stores
|
$43.47
|
-0.10
|
2,057,263
76% DAV
2,708,300
|
8/21/2009
(Date
Featured) |
$39.21
(Price
Featured) |
PP = $38.84 |
G |
| MB = $40.78 |
Most Recent Note - 9/30/2009 4:34:03 PM
G - Small loss today on light volume for this high-ranked leader in the Retail - Clothing/shoe group. It is quietly consolidating, but extended from a sound base andnot buyable under the investment system guidelines now. Support to watch is at prior highs in the $38 area. It was featured in yellow in the 8/21/09 Mid-Day BreakOuts Report (read here).
>>> The latest Featured Stock Update with an annotated graph appeared on 9/18/2009. click here.
|
|
C
A
S
I |
News |
Chart |
SEC
View all notes Alert
me of new notes
Company
Profile
|
ARST
-
|
$24.07
|
+0.12
|
480,751
67% DAV
720,700
|
9/1/2009
(Date
Featured) |
$19.91
(Price
Featured) |
PP = $20.90 |
G |
| MB = $21.95 |
Most Recent Note - 9/30/2009 4:35:42 PM
G - Gain today on light volume for a new highclose, getting further extended from its latest sound base. Prior chart highs in the $20 area are important support to watch on pullbacks.
>>> The latest Featured Stock Update with an annotated graph appeared on 9/17/2009. click here.
|
|
C
A
S
I |
News |
Chart |
SEC
View all notes Alert
me of new notes
Company
Profile
|
BIDU
- NASDAQ
Baidu Inc Ads
INTERNET - Internet Information Providers
|
$391.05
|
-3.37
|
1,809,242
104% DAV
1,738,700
|
9/8/2009
(Date
Featured) |
$351.80
(Price
Featured) |
PP = $368.59 |
G |
| MB = $387.02 |
Most Recent Note - 9/30/2009 4:39:12 PM
G -Consolidating in a tight trading range (percentage-wise) for the past couple of weeks, mostly trading above its "max buy" level, with occasional intra-day dips below it. BIDU was featured in yellow in the 9/08/09 Mid-Day BreakOuts Report (read here).
>>> The latest Featured Stock Update with an annotated graph appeared on 9/21/2009. click here.
|
|
C
A
S
I |
News |
Chart |
SEC
View all notes Alert
me of new notes
Company
Profile
|
CACC
- NASDAQ
Credit Acceptance Corp
FINANCIAL SERVICES - Credit Services
|
$32.19
|
-0.68
|
105,714
264% DAV
40,000
|
9/29/2009
(Date
Featured) |
$33.48
(Price
Featured) |
PP = $32.60 |
Y |
| MB = $34.23 |
Most Recent Note - 9/30/2009 5:14:45 PM
Y - Gapped down for a loss on heavier volume, encountering some distributional pressure today. It closedback under its pivot point, but still above August'shigh closes.It gapped on the 2 prior sessions and triggering a technical buy signal as it spiked to a new 52-week high with more than 2 times average volume. It rose from a 6-week base after consolidating and finding support near its 50 DMA line. The Finance - Consumer/Commercial Loans firm has maintained a great track record of annual and quarterly sales revenues and earnings increases. It was featured on 9/29/09 in yellow in the mid-day report (read here).
>>> The latest Featured Stock Update with an annotated graph appeared on 9/29/2009. click here.
|
|
C
A
S
I |
News |
Chart |
SEC
View all notes Alert
me of new notes
Company
Profile
|
CRM
- NYSE
Salesforce.com Inc
INTERNET - Internet Software & Services
|
$56.93
|
-0.23
|
1,772,343
86% DAV
2,057,400
|
8/16/2009
(Date
Featured) |
$47.12
(Price
Featured) |
PP = $45.59 |
G |
| MB = $47.87 |
Most Recent Note - 9/30/2009 5:18:48 PM
G -Consolidating in a tight range in recent weeks just above prior highs in the $55 area, an intial support level well above additional support at its upward trendline and 50 DMA line. It is extended from a sound base now andnot buyable under the guidelines.
>>> The latest Featured Stock Update with an annotated graph appeared on 9/15/2009. click here.
|
|
C
A
S
I |
News |
Chart |
SEC
View all notes Alert
me of new notes
Company
Profile
|
EBIX
- NASDAQ
Ebix Inc
COMPUTER SOFTWARE & SERVICES - Business Software & Services
|
$55.36
|
+1.35
|
404,810
270% DAV
150,000
|
8/28/2009
(Date
Featured) |
$45.86
(Price
Featured) |
PP = $45.35 |
G |
| MB = $47.62 |
Most Recent Note - 9/30/2009 5:20:14 PM
G - Hit a new all-time high today as itposted a3rd consecutive big gains on heavy volume. It has not formed a new sound base, andyet it has overcome heavy distributional pressure which recently led to a pullback near support at early-August chart highs and its 50 DMA line in the $45 area.
>>> The latest Featured Stock Update with an annotated graph appeared on 9/24/2009. click here.
|
|
C
A
S
I |
News |
Chart |
SEC
View all notes Alert
me of new notes
Company
Profile
|
GMCR
- NASDAQ
Green Mtn Coffee Roastrs
FOOD & BEVERAGE - Processed & Packaged Goods
|
$73.84
|
+0.95
|
1,250,869
83% DAV
1,507,200
|
7/17/2009
(Date
Featured) |
$60.15
(Price
Featured) |
PP = $63.79 |
G |
| MB = $66.98 |
Most Recent Note - 9/30/2009 5:23:07 PM
G - Small gaintoday on light volume for a new high close.Its 9/28/09 gain with 2 times average volumehelped it clear a cup-with-handle type base (during which it completed an additional share offering on 8/07/09). As previously noted, "Its 3-day pullback of about -9% tested support near its 50 DMA, and although the latest action is bullish, a new pivot point and max buy level were not cited because guidelines call for a cup-with-handle pattern to form over at least 8 weeks, the handle usually lasts at least a week and drifts downward by 10-15% in normal markets. Also, the Relative Strength line should lead or at least closely follow a stock's price into new high ground, but in this case its RS line is still under its July highs."
>>> The latest Featured Stock Update with an annotated graph appeared on 9/23/2009. click here.
|
|
C
A
S
I |
News |
Chart |
SEC
View all notes Alert
me of new notes
Company
Profile
|
NTES
- NASDAQ
Netease Inc Adr
INTERNET - Internet Information Providers
|
$45.68
|
+0.30
|
1,302,956
63% DAV
2,072,300
|
9/23/2009
(Date
Featured) |
$47.11
(Price
Featured) |
PP = $47.04 |
G |
| MB = $49.39 |
Most Recent Note - 9/30/2009 5:29:48 PM
G- Holding its groundwith light volume gainsthis week after testing important support is at its 50 DMA line and upward trendline. Deterioration below those levels would raise more serious concerns and trigger technical sell signals. Color code is changed to green based onpromptly negatingits latest breakout and then trading more than -7% belowits pivot point. This may also be considered a riskier late-stage base.
>>> The latest Featured Stock Update with an annotated graph appeared on 9/25/2009. click here.
|
|
C
A
S
I |
News |
Chart |
SEC
View all notes Alert
me of new notes
Company
Profile
|
NVEC
- NASDAQ
N V E Corp
ELECTRONICS - Semiconductor - Specialized
|
$53.16
|
-0.28
|
58,373
62% DAV
94,300
|
8/26/2009
(Date
Featured) |
$55.32
(Price
Featured) |
PP = $57.60 |
G |
| MB = $60.48 |
Most Recent Note - 9/30/2009 5:33:00 PM
G - Loss again today on lighter volume, but slumping further below its 50 DMA line which hasnow acted as a resistance level. Despite some encouraging signs of support arriving after recent distributional pressure, at best it needs more time to form a new sound base.
>>> The latest Featured Stock Update with an annotated graph appeared on 9/30/2009. click here.
|
|
C
A
S
I |
News |
Chart |
SEC
View all notes Alert
me of new notes
Company
Profile
|
PEGA
- NASDAQ
Pegasystems Inc
COMPUTER SOFTWARE & SERVICES - Business Software & Services
|
$34.53
|
-0.20
|
213,662
55% DAV
391,100
|
9/9/2009
(Date
Featured) |
$31.14
(Price
Featured) |
PP = $33.35 |
Y |
| MB = $35.02 |
Most Recent Note - 9/30/2009 5:42:28 PM
Y - Small loss today on lighter volume, still perched nearall-time highs. Since 9/16/09 volume has been below average, or average, behind recent gains and losses for this high-ranked Computer Software - Financial firm. An upward trendline connecting its July-September chart lows may be considered an initial support level above its 50 DMA line.
>>> The latest Featured Stock Update with an annotated graph appeared on 9/22/2009. click here.
|
|
C
A
S
I |
News |
Chart |
SEC
View all notes Alert
me of new notes
Company
Profile
|
WNS
- NYSE
W N S Holdings Ltd Ads
DIVERSIFIED SERVICES - Business/Management Services
|
$15.98
|
-0.02
|
104,720
208% DAV
50,300
|
9/28/2009
(Date
Featured) |
$15.28
(Price
Featured) |
PP = $16.10 |
Y |
| MB = $16.91 |
Most Recent Note - 9/30/2009 5:43:40 PM
Y - Traded up as high as $16.50for the second day in a row, yet itreversed into the red. On the prior session it encountered resistance in the $16 area and closed just under its pivot point while still posting a considerable gain for a new 52-week high and new high close with volume 11 times its daily average volume. It formed an orderly flat base for at least 5-weeks, and it was featured in yellow in the 9/28/09 mid-day report (read here). Quarterly earnings have been above the +25% guideline and its annual earnings history has been great, satisfying the C & A criteria. However, sales revenues growth has decelerated.
>>> The latest Featured Stock Update with an annotated graph appeared on 9/28/2009. click here.
|
|
C
A
S
I |
News |
Chart |
SEC
View all notes Alert
me of new notes
Company
Profile
|
|
|
|
THESE ARE NOT BUY RECOMMENDATIONS!
Comments contained in the body of this report are technical
opinions only. The material herein has been obtained
from sources believed to be reliable and accurate, however,
its accuracy and completeness cannot be guaranteed.
This site is not an investment advisor, hence it does
not endorse or recommend any securities or other investments.
Any recommendation contained in this report may not
be suitable for all investors and it is not to be deemed
an offer or solicitation on our part with respect to
the purchase or sale of any securities. All trademarks,
service marks and trade names appearing in this report
are the property of their respective owners, and are
likewise used for identification purposes only.
This report is a service available
only to active Paid Premium Members.
You may opt-out of receiving report notifications
at any time. Questions or comments may be submitted
by writing to Premium Membership Services 665 S.E. 10 Street, Suite 201 Deerfield Beach, FL 33441-5634 or by calling 1-800-965-8307
or 954-785-1121.
|
|
|


