You are not logged in.
This means you
CAN ONLY VIEW reports that were published prior to Monday, February 26, 2024.
You
MUST UPGRADE YOUR MEMBERSHIP if you want to see any current reports.
AFTER MARKET UPDATE - TUESDAY, SEPTEMBER 29TH, 2020
Previous After Market Report Next After Market Report >>>
|
|
|
|
DOW |
-131.40 |
27,452.66 |
-0.48% |
|
Volume |
701,047,339 |
-18% |
|
Volume |
3,316,666,900 |
-6% |
|
NASDAQ |
-30.31 |
11,087.22 |
-0.27% |
|
Advancers |
1,105 |
37% |
|
Advancers |
1,640 |
48% |
|
S&P 500 |
-16.13 |
3,335.47 |
-0.48% |
|
Decliners |
1,876 |
63% |
|
Decliners |
1,760 |
52% |
|
Russell 2000 |
-5.62 |
1,504.73 |
-0.37% |
|
52 Wk Highs |
56 |
|
|
52 Wk Highs |
74 |
|
|
S&P 600 |
-4.72 |
853.35 |
-0.55% |
|
52 Wk Lows |
11 |
|
|
52 Wk Lows |
30 |
|
|
The major indices have shown worrisome action indicative of a market correction and leadership has been thin. Weakness in stocks prompts disciplined investors on a case-by-case basis to reduce market exposure and raise cash.
|
 |
Breadth Had Negative Bias as Major Indices Fell
Kenneth J. Gruneisen - Passed the CAN SLIM® Master's Exam
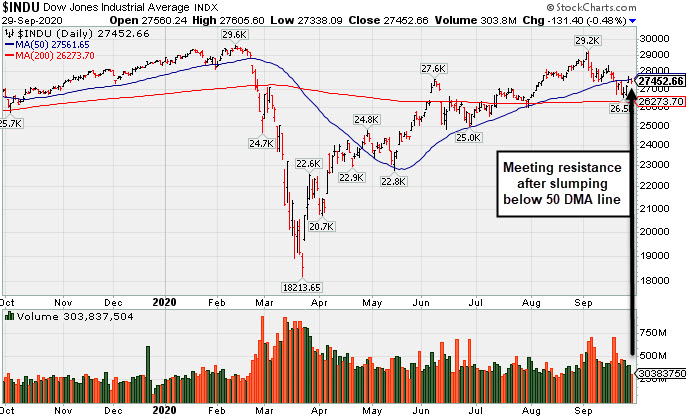
The Dow fell 131 points, while the S&P 500 declined 0.5%. The Nasdaq Composite slipped 0.3%. The reported volume totals were lighter than the prior session on the NYSE and on the Nasdaq exchange. Breadth was negative as decliners led advancers by more than a 3-2 margin on the NYSE and by a much narrower margin on the Nasdaq exchange. Leadership improved as 21 high-ranked companies from the Leaders List that hit new 52-week highs and were listed on the BreakOuts Page, versus the total of 16 on the prior session. New 52-week highs outnumbered new 52-week lows totals on the NYSE and on the Nasdaq exchange. The major indices have been showing action indicative of a market correction (M criteria). In weak markets it is considered critical to reduce exposure and sell faltering stocks on a case-by-case basis.
PICTURED: The Dow Jones Industrial Average met resistance after slumping below its 50-day moving average (DMA) line.
A month-end relief rally in equities lost steam on Tuesday. All three indexes remain on track for their first monthly decline since March, though the S&P 500 is still on course for its best back-to-back quarterly performance since 2009.
Investors continue to hope for further fiscal stimulus from Washington after House Democrats unveiled a $2.2 trillion coronavirus relief package. The talks between House Speaker Nancy Pelosi and Treasury Secretary Steven Mnuchin concluded today with plans to resume discussions tomorrow, as Democratic and Republican lawmakers still need to compromise on the size and scope of the package. Meanwhile, market participants await the first of three U.S. presidential debates slated for later this evening. Concerns over COVID-19 also remained a market overhang, with New York City’s positivity rate climbing above 3% for the first time in months.
On the data front, the Conference Board’s measure of consumer confidence climbed the most since April 2003 in September, with the gauge jumping to 101.8 from August’s upwardly revised 86.3 reading. Treasuries were little changed, with the yield on the 10-year note down one basis point to 0.65%.
Ten of 11 S&P 500 sectors finished in negative territory, with the Communication Services group the lone advancer. Energy shares lagged the most amid a nearly 4% drop in WTI crude prices over demand worries. In corporate news, Beyond Meat (BYND +9.49%) surged after announcing that Walmart would triple the number of stores offering the plant based protein food products. |
 Kenneth J. Gruneisen started out as a licensed stockbroker in August 1987, a couple of months prior to the historic stock market crash that took the Dow Jones Industrial Average down -22.6% in a single day. He has published daily fact-based fundamental and technical analysis on high-ranked stocks online for two decades. Through FACTBASEDINVESTING.COM, Kenneth provides educational articles, news, market commentary, and other information regarding proven investment systems that work in good times and bad.
Comments contained in the body of this report are technical opinions only and are not necessarily those of Gruneisen Growth Corp. The material herein has been obtained from sources believed to be reliable and accurate, however, its accuracy and completeness cannot be guaranteed. Our firm, employees, and customers may effect transactions, including transactions contrary to any recommendation herein, or have positions in the securities mentioned herein or options with respect thereto. Any recommendation contained in this report may not be suitable for all investors and it is not to be deemed an offer or solicitation on our part with respect to the purchase or sale of any securities. |
|
 |
Energy, Retail, and Financial Groups Fell
Kenneth J. Gruneisen - Passed the CAN SLIM® Master's Exam
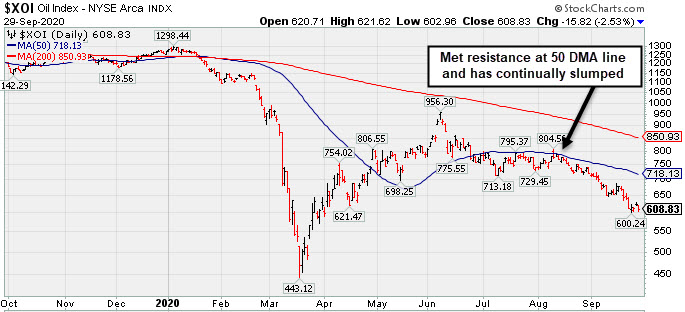
Weakness in Retail Index ($RLX -0.81%) and financials weighed on the major indices as the Bank Index ($BKX -1.53%) and Broker/Dealer Index ($XBD -0.83%) each lost ground. The Networking Index ($NWX +0.86%) led the tech sector but the Semiconductor Index ($SOX +0.22%) and Biotech Index ($BTK +0.09%) each posted tiny gains for the session. Commodity-linked groups were mixed as the Oil Services Index ($OSX -2.82%) and Integrated Oil Index ($XOI -2.53%) slumped while the Gold & Silver Index ($XAU +1.18%) notched a gain. PICTURED: The Integrated Oil Index ($XOI -2.53%) met resistance at its 50-day moving average (DMA) line in August and has continually slumped.
| Oil Services |
$OSX |
28.06 |
-0.81 |
-2.82% |
-64.16% |
| Integrated Oil |
$XOI |
608.83 |
-15.82 |
-2.53% |
-52.08% |
| Semiconductor |
$SOX |
2,242.47 |
+4.83 |
+0.22% |
+21.24% |
| Networking |
$NWX |
536.90 |
+4.60 |
+0.86% |
-7.97% |
| Broker/Dealer |
$XBD |
277.29 |
-2.31 |
-0.83% |
-4.51% |
| Retail |
$RLX |
3,380.29 |
-27.60 |
-0.81% |
+38.01% |
| Gold & Silver |
$XAU |
143.23 |
+1.67 |
+1.18% |
+33.96% |
| Bank |
$BKX |
72.10 |
-1.12 |
-1.53% |
-36.40% |
| Biotech |
$BTK |
5,344.16 |
+4.59 |
+0.09% |
+5.46% |
|
|
|
 |
Quiet Rebound Meeting Resistance at 50-Day Moving Average
Kenneth J. Gruneisen - Passed the CAN SLIM® Master's Exam
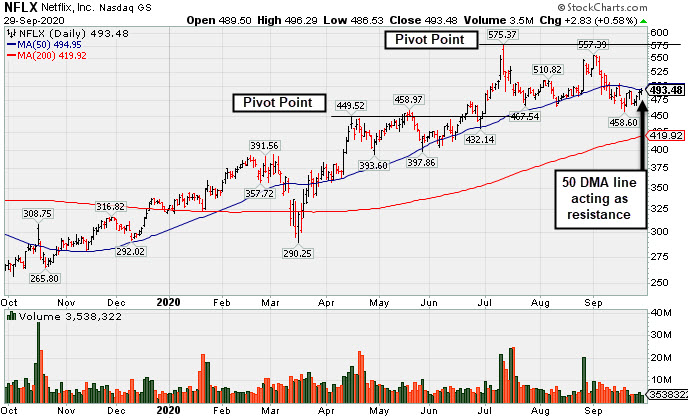
Netflix Inc (NFLX +$2.83 or +0.58% to $493.48) posted a 4th consecutive gain today with light volume, rebounding toward its 50-day moving average (DMA) line ($495) which is now downward sloping. That short-term average has acted as resistance. Subsequent gains back above the 50 DMA line are needed for its outlook to improve. The recent low ($458.60 on 9/18/20) defines important near term support where any further deterioration would raise more serious concerns and a violation would trigger a more worrisome technical sell signal. NFLX currently has an Accumulation/Distribution Rating of C-. On 9/16/20 it was shown with an annotated graph under the headline,"Met Resistance at 50 DMA Line and Reversed Today". It has traded up as much as +46.2% since it was highlighted in yellow with pivot point cited based on its 3/03/20 high plus 10 cents in the 4/13/20 mid-day report (read here).
Fundamentals remain strong. NFLX has been consolidating after reporting Jun '20 earnings +165% on +25% sales revenues versus the year ago period. It has tallied 4 consecutive quarterly comparisons well above the +25% minimum guideline (C criteria). A previously noted downturn in FY '15 earnings (A criteria) has been followed by very strong growth. The number of top-rated funds owning its shares (I criteria) rose from 1,534 in Mar '17 to 2,798 in Jun '20, a reassuring sign concerning the I criteria. Its current Up/Down Volume Ratio of 0.9 is an unbiased indication its shares have been under slight distributional pressure over the past 50 days. The company has 423.4 million shares in the public float (S criteria) which can make it a less likely sprinter. It has a Timeliness rating of A, a Sponsorship rating of B. Charts courtesy of www.stockcharts.com
 |
|
|
Color Codes Explained :
Y - Better candidates highlighted by our
staff of experts.
G - Previously featured
in past reports as yellow but may no longer be buyable under the
guidelines.
***Last / Change / Volume data in this table is the closing quote data***
Symbol/Exchange
Company Name
Industry Group |
PRICE |
CHANGE
(%Change) |
Day High |
Volume
(% DAV)
(% 50 day avg vol) |
52 Wk Hi
% From Hi |
Featured
Date |
Price
Featured |
Pivot Featured |
|
Max Buy |
 ADBE
-
NASDAQ
ADBE
-
NASDAQ
Adobe Inc
COMPUTER SOFTWARE and SERVICES - Application Software
|
$489.33
|
+0.82
0.17% |
$493.45
|
1,916,647
62.66% of 50 DAV
50 DAV is 3,059,000
|
$536.88
-8.86%
|
9/10/2020
|
$488.46
|
PP = $536.88
|
|
MB = $563.72
|
Most Recent Note - 9/28/2020 5:27:33 PM
G - Found prompt support near its 50 DMA line ($469). faces near-term resistance due to overhead supply up to the $536 level. Disciplined investors always limit losses by selling any stock that falls more than 7-8% from their purchase price. Reported Aug '20 quarterly earnings +25% on +14% sales revenues versus the year ago period.
>>> FEATURED STOCK ARTICLE : Light Volume Loss Falling Near 50-Day Moving Average Line Again - 9/23/2020 |
View all notes |
Set NEW NOTE alert |
Company Profile |
SEC
News |
Chart |
Request a new note
C
A
S
I |
CRL
-
NYSE
Charles River Labs Intl
DRUGS - Biotechnology
|
$222.93
|
-0.49
-0.22% |
$225.92
|
358,137
112.62% of 50 DAV
50 DAV is 318,000
|
$228.86
-2.59%
|
7/15/2020
|
$192.66
|
PP = $189.95
|
|
MB = $199.45
|
Most Recent Note - 9/28/2020 5:31:11 PM
G - Posted a gain with light volume today for its 2nd best ever close. Showed resilience and found prompt support at its 50 DMA line ($212). More damaging losses would raise greater concerns and trigger a technical sell signal. Raised fundamental concerns when it recently reported Jun '20 quarterly earnings -3% on +4% sales revenues, below the +25% minimum guideline (C criteria).
>>> FEATURED STOCK ARTICLE : Showed Resilience When Testing 50-Day Moving Average Line Again - 9/24/2020 |
View all notes |
Set NEW NOTE alert |
Company Profile |
SEC
News |
Chart |
Request a new note
C
A
S
I |
AMD
-
NASDAQ
Advanced Micro Devices
ELECTRONICS - Semiconductor - Broad Line
|
$81.77
|
+2.29
2.88% |
$82.55
|
61,188,447
92.70% of 50 DAV
50 DAV is 66,004,000
|
$94.28
-13.27%
|
8/31/2020
|
$90.42
|
PP = $87.39
|
|
MB = $91.76
|
 Most Recent Note - 9/29/2020 5:15:58 PM
G - Rebounded further above its 50 DMA line ($79.22) with today's 4th consecutive gain on near average or lighter than average volume. More damaging losses below the 50 DMA line and below the recent low ($73.85 on 9/18/20) would raise greater concerns and trigger more worrisome technical sell signals. Faces near-term resistance due to overhead supply up to the $94 level. Fundamentals remain strong. See the latest FSU analysis for more details and an annotated graph.
>>> FEATURED STOCK ARTICLE : Rebound Above 50-Day Average With Light Volume Helped Stance - 9/28/2020 |
View all notes |
Set NEW NOTE alert |
Company Profile |
SEC
News |
Chart |
Request a new note
C
A
S
I |
TREX
-
NYSE
Trex Company Inc
MATERIALS and CONSTRUCTION - General Building Materials
|
$70.79
|
-0.27
-0.38% |
$72.14
|
438,507
43.29% of 50 DAV
50 DAV is 1,013,000
|
$78.32
-9.61%
|
6/26/2020
|
$54.53
|
PP = $66.47
|
|
MB = $69.79
|
Most Recent Note - 9/28/2020 5:38:17 PM
G - Rebounded above its 50 DMA line ($70.34) helping its outlook to improve, but light volume was behind today's 3rd consecutive gain. More damaging losses below the recent low ($63.32 on 9/21/20) would raise serious concerns. Do not be confused by the 2:1 share split effective 9/15/20 (Featured Price, Pivot Point, and Max Buy prices have been adjusted accordingly). Fundamentals remain strong.
>>> FEATURED STOCK ARTICLE : Slumped Below 50-Day Average With Loss on Light Volume - 9/17/2020 |
View all notes |
Set NEW NOTE alert |
Company Profile |
SEC
News |
Chart |
Request a new note
C
A
S
I |
NFLX
-
NASDAQ
Netflix Inc
SPECIALTY RETAIL - Music and Video Stores
|
$493.48
|
+2.83
0.58% |
$496.29
|
3,534,260
58.25% of 50 DAV
50 DAV is 6,067,000
|
$575.37
-14.23%
|
9/1/2020
|
$547.45
|
PP = $575.47
|
|
MB = $604.24
|
Most Recent Note - 9/29/2020 5:14:35 PM
G - Posted a 4th consecutive gain today with light volume, rebounding toward its 50 DMA line ($495) which is now downward sloping. That short-term average has acted as resistance. Subsequent gains back above the 50 DMA line are needed for its outlook to improve. The recent low ($458.60 on 9/18/20) defines important near term support where any further deterioration would raise more serious concerns. See the latest FSU analysis for more details and a new annotated graph.
>>> FEATURED STOCK ARTICLE : Quiet Rebound Meeting Resistance at 50-Day Moving Average - 9/29/2020 |
View all notes |
Set NEW NOTE alert |
Company Profile |
SEC
News |
Chart |
Request a new note
C
A
S
I |
Symbol/Exchange
Company Name
Industry Group |
PRICE |
CHANGE
(%Change) |
Day High |
Volume
(% DAV)
(% 50 day avg vol) |
52 Wk Hi
% From Hi |
Featured
Date |
Price
Featured |
Pivot Featured |
|
Max Buy |
LGIH
-
NASDAQ
L G I Homes Inc
Bldg-Resident/Comml
|
$113.79
|
-1.91
-1.65% |
$115.81
|
149,341
50.28% of 50 DAV
50 DAV is 297,000
|
$123.94
-8.19%
|
7/7/2020
|
$99.19
|
PP = $95.82
|
|
MB = $100.61
|
Most Recent Note - 9/28/2020 5:25:10 PM
G - Rebounded above its 50 DMA line ($112.96) with today's considerable gain backed by higher (near average) volume helping its outlook to improve. Faces near-term resistance due to overhead supply up to the $123 level. More damaging losses below the latest low ($101.30 on 9/21/20) would raise greater concerns and trigger a worrisome technical sell signal. Reported Jun '20 quarterly earnings +21% on +4% sales revenues, breaking a streak of 4 comparisons above the +25% minimum guideline (C criteria).
>>> FEATURED STOCK ARTICLE : Violation of 50-Day Average on Volume Triggered Technical Sell Signal - 9/18/2020 |
View all notes |
Set NEW NOTE alert |
Company Profile |
SEC
News |
Chart |
Request a new note
C
A
S
I |
NOW
-
NYSE
Servicenow Inc
Computer Sftwr-Enterprse
|
$487.98
|
+3.77
0.78% |
$489.56
|
812,802
49.62% of 50 DAV
50 DAV is 1,638,000
|
$501.82
-2.76%
|
8/20/2020
|
$453.34
|
PP = $454.79
|
|
MB = $477.53
|
Most Recent Note - 9/28/2020 5:35:27 PM
G - Consolidating above its "max buy" level near its all-time high, it found support at its 50 DMA line ($452). Fundamentals remain strong. More damaging losses below the 50 DMA line and prior low ($432.85 on 9/08/20) may raise concerns and trigger a technical sell signal. See the latest FSU analysis for more details and an annotated graph.
>>> FEATURED STOCK ARTICLE : Gain Back Above "Max Buy" Level for ServiceNow - 9/25/2020 |
View all notes |
Set NEW NOTE alert |
Company Profile |
SEC
News |
Chart |
Request a new note
C
A
S
I |
|
|
|
THESE ARE NOT BUY RECOMMENDATIONS!
Comments contained in the body of this report are technical
opinions only. The material herein has been obtained
from sources believed to be reliable and accurate, however,
its accuracy and completeness cannot be guaranteed.
This site is not an investment advisor, hence it does
not endorse or recommend any securities or other investments.
Any recommendation contained in this report may not
be suitable for all investors and it is not to be deemed
an offer or solicitation on our part with respect to
the purchase or sale of any securities. All trademarks,
service marks and trade names appearing in this report
are the property of their respective owners, and are
likewise used for identification purposes only.
This report is a service available
only to active Paid Premium Members.
You may opt-out of receiving report notifications
at any time. Questions or comments may be submitted
by writing to Premium Membership Services 665 S.E. 10 Street, Suite 201 Deerfield Beach, FL 33441-5634 or by calling 1-800-965-8307
or 954-785-1121.
|
|
|