You are not logged in.
This means you
CAN ONLY VIEW reports that were published prior to Monday, April 14, 2025.
You
MUST UPGRADE YOUR MEMBERSHIP if you want to see any current reports.
AFTER MARKET UPDATE - THURSDAY, SEPTEMBER 29TH, 2011
Previous After Market Report Next After Market Report >>>
|
|
|
|
DOW |
+143.08 |
11,153.98 |
+1.30% |
|
Volume |
1,120,983,600 |
+7% |
|
Volume |
2,238,793,880 |
+18% |
|
NASDAQ |
-10.82 |
2,480.76 |
-0.43% |
|
Advancers |
2,151 |
70% |
|
Advancers |
1,578 |
60% |
|
S&P 500 |
+9.34 |
1,160.40 |
+0.81% |
|
Decliners |
869 |
28% |
|
Decliners |
959 |
37% |
|
Russell 2000 |
+10.83 |
662.80 |
+1.66% |
|
52 Wk Highs |
11 |
|
|
52 Wk Highs |
4 |
|
|
S&P 600 |
+6.41 |
365.46 |
+1.79% |
|
52 Wk Lows |
149 |
|
|
52 Wk Lows |
219 |
|
|
 |
Major Averages Finished Mixed Following Afternoon Rebound
Kenneth J. Gruneisen - Passed the CAN SLIM® Master's Exam
The Dow rallied in the ninth inning Thursday, leaving the Nasdaq in the dust on a jumpy day for stocks. Higher volume totals were reported on the NYSE and on the Nasdaq exchange. Breadth was positive as advancing stocks beat decliners by 5-2 on the NYSE and by 5-3 on the Nasdaq exchange. The new 52-week lows totals increased and easily outnumbered new 52-week highs on both the Nasdaq exchange and the NYSE, and the new highs total on the Nasdaq exchange remained in the single digits. There were only 3 high-ranked companies from the CANSLIM.net Leaders List that made new 52-week highs and appeared on the CANSLIM.net BreakOuts Page, up from 1 on the prior session. There were 7 losses and 7 gainers out of the 14 high-ranked companies currently included on the Featured Stocks Page.
The market found something to like in a pair of U.S. economic reports. Initial jobless claims fell 37,000 to 391,000 last week, the fewest since April. U.S. second quarter gross domestic product grew 1.3%, up from the previous estimate for growth of 1%.
Financial shares gained following a vote in Germany to approve an expanded European rescue fund. Technology stocks ran into resistance after Advanced Micro Devices (AMD -13.7%) dove after it cut its sales forecast. Netflix Inc (NFLX -11.2%) lost ground and Amazon.com Inc (AMZN +3.2%) rose following a report that Microsoft Corp (MSFT -0.3%) will offer online pay television service.
Insurance stocks got a lift when Nationwide Mutual Insurance Company agreed to buy Pennsylvania-based rival Harleysville Group Inc (HGIC +87.06%) for at least $1.6 billion. Homebuilders also had a good day. Pending home sales fell less than expected in August, and Freddie Mac said the average rate on a 30-year home loan hit a record low of 4.01%. The 10-year Treasury note was down 3/32 to yield 1.99%, slipping for a fifth day in the longest stretch of decreases since July.
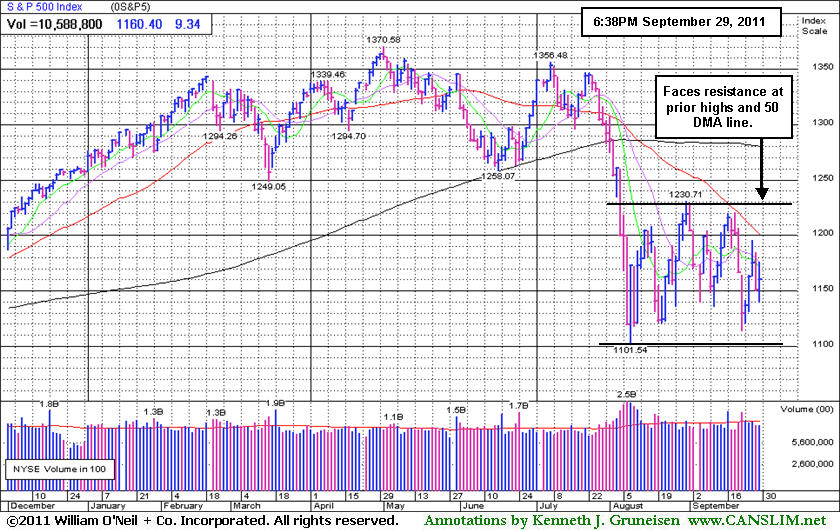
The market environment (M criteria) is clearly under pressure and back in a correction after the heavy wave of distributional action last week. The latest confirmed rally may, at best, be considered barely alive by the fact that the Nasdaq Composite Index and S&P 500 Index are still fighting to stay above their respective Day 1 (8/09/11) lows.
The September 2011 issue of CANSLIM.net News is now available - (click here) and the Q3 2011 Webcast which aired on September 28th is also available ON DEMAND - (CLICK HERE). All upgraded members are eligible to access the webcast presentation at no additional cost. Via the Premium Member Homepage links to all prior reports and webcasts are always available.
PICTURED: The S&P 500 Index faces resistance at recent highs and its 50-day moving average line. Any rally above those levels would be a reassuring sign the market conditions were technically improving.
|
 Kenneth J. Gruneisen started out as a licensed stockbroker in August 1987, a couple of months prior to the historic stock market crash that took the Dow Jones Industrial Average down -22.6% in a single day. He has published daily fact-based fundamental and technical analysis on high-ranked stocks online for two decades. Through FACTBASEDINVESTING.COM, Kenneth provides educational articles, news, market commentary, and other information regarding proven investment systems that work in good times and bad.
Comments contained in the body of this report are technical opinions only and are not necessarily those of Gruneisen Growth Corp. The material herein has been obtained from sources believed to be reliable and accurate, however, its accuracy and completeness cannot be guaranteed. Our firm, employees, and customers may effect transactions, including transactions contrary to any recommendation herein, or have positions in the securities mentioned herein or options with respect thereto. Any recommendation contained in this report may not be suitable for all investors and it is not to be deemed an offer or solicitation on our part with respect to the purchase or sale of any securities. |
|
 |
Financial Groups Helped Underpin Market
Kenneth J. Gruneisen - Passed the CAN SLIM® Master's Exam
The Broker/Dealer Index ($XBD +2.73%) and Bank Index ($BKX +3.32%) provided some leadership for a change and posted better gains than most industry groups on Thursday. The Retail Index ($RLX -1.38%) and tech indexes including the Internet Index ($IIX -1.36%) and Semiconductor Index ($SOX -1.28%) weighed negatively on the major averages. The Biotechnology Index ($BTK +0.06%) inched barely higher for the day, meanwhile the Healthcare Index ($HMO -0.55%) edged lower. The Integrated Oil Index ($XOI +1.47%) outpaced the Oil Services Index ($OSX -0.15%) and the Gold & Silver Index ($XAU +0.18%).
Charts courtesy www.stockcharts.com

PICTURED: The Networking Index ($NWX +0.45%) halted its slide after exceeding its August lows. It faces resistance at recent highs and its 50-day moving average (DMA) line. It has slumped as much as -37.7% from its April high.
| Oil Services |
$OSX |
198.16 |
-0.29 |
-0.15% |
-19.16% |
| Healthcare |
$HMO |
1,909.04 |
-10.64 |
-0.55% |
+12.83% |
| Integrated Oil |
$XOI |
1,066.63 |
+15.42 |
+1.47% |
-12.08% |
| Semiconductor |
$SOX |
350.82 |
-4.54 |
-1.28% |
-14.81% |
| Networking |
$NWX |
221.73 |
+0.99 |
+0.45% |
-20.97% |
| Internet |
$IIX |
269.69 |
-3.71 |
-1.36% |
-12.36% |
| Broker/Dealer |
$XBD |
84.00 |
+2.23 |
+2.73% |
-30.87% |
| Retail |
$RLX |
506.30 |
-7.08 |
-1.38% |
-0.41% |
| Gold & Silver |
$XAU |
184.44 |
+0.34 |
+0.18% |
-18.60% |
| Bank |
$BKX |
36.74 |
+1.18 |
+3.32% |
-29.63% |
| Biotech |
$BTK |
1,124.97 |
+0.67 |
+0.06% |
-13.31% |
|
|
|
 |
Pullback Testing Previously Noted Chart Support Area
Kenneth J. Gruneisen - Passed the CAN SLIM® Master's Exam
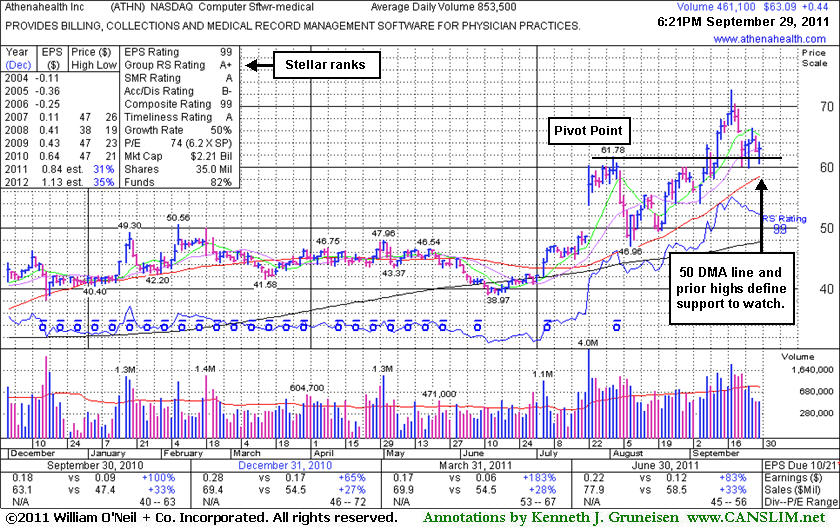
Athenahealth Inc (ATHN +$0.44 or +0.70% to $63.09) has been quietly consolidating above prior highs in the $61 area previously noted as initial support on pullbacks. Its 50-day moving average (DMA) line is the next nearest support level. It was last shown in this FSU section with an annotated graph on 9/08/11 under the headline, "Secondary Buy Point After Choppy Consolidation ", as its solid gain backed nearly 2 times average volume helped it rally above its pivot point to a new 52-week and all-time high. Strength and leadership (L criteria) in the other Computer Software - Medical issues has been a very reassuring sign contributing to its stellar ranks. The broader market's (M criteria) tentative action of late remains an overhanging concern, while an expansion in leadership (new highs) would be a welcome improvement to watch for in the near-term.
The daily graph below illustrates how ATHN endured heavy distributional pressure with a streak of volume-driven losses after recently peaking, but volume totals have cooled while staying above critical support levels. It had recently been highlighted in yellow in the 7/22/11 mid-day report (read here), a session marked by 11 times average volume as its considerable "breakaway gap" cleared previously noted resistance in the $50 area. It reported earnings +83% on +33% sales revenues for the quarter ended June 30, 2011 versus the year ago period. The C criteria is satisfied by the past 4 quarterly comparisons showing solid sales and earnings increases above the +25% guideline. Its strong annual earnings satisfies the A criteria. Always limit losses if a stock falls -7% from your buy price. You may be wise to be willing to buy the stock back later when strength returns, but you should never leave yourself open to greater losses.
|
|
|
Color Codes Explained :
Y - Better candidates highlighted by our
staff of experts.
G - Previously featured
in past reports as yellow but may no longer be buyable under the
guidelines.
***Last / Change / Volume data in this table is the closing quote data***
Symbol/Exchange
Company Name
Industry Group |
PRICE |
CHANGE
(%Change) |
Day High |
Volume
(% DAV)
(% 50 day avg vol) |
52 Wk Hi
% From Hi |
Featured
Date |
Price
Featured |
Pivot Featured |
|
Max Buy |
AAPL
-
NASDAQ
Apple Inc
COMPUTER HARDWARE - Personal Computers
|
$390.57
|
-6.44
-1.62% |
$402.21
|
23,253,007
102.19% of 50 DAV
50 DAV is 22,755,000
|
$422.86
-7.64%
|
9/16/2011
|
$399.14
|
PP = $404.60
|
|
MB = $424.83
|
 Most Recent Note - 9/29/2011 5:10:29 PM
Y - Loss today with higher (near average) volume indicated mild distributional pressure while slumping further below its prior highs and pivot point and nearly testing its 50 DMA line that defines important chart support. Recent rally to a new all-time high was not marked by very heavy volume. It is already heavily owned by the institutional crowd, and ownership by top-rated funds fell from 4,371 in Mar '11 to 4,355 in Jun '11.
>>> The latest Featured Stock Update with an annotated graph appeared on 9/19/2011. Click here.
View all notes |
Alert me of new notes |
CANSLIM.net Company Profile |
SEC |
Zacks Reports |
StockTalk |
News |
Chart |
Request a new note
C
A N
S L
I M


|
ALXN
-
NASDAQ
Alexion Pharmaceuticals
DRUGS - Drug Manufacturers - Other
|
$64.23
|
-1.67
-2.53% |
$67.00
|
1,871,211
112.78% of 50 DAV
50 DAV is 1,659,200
|
$68.50
-6.23%
|
9/15/2011
|
$63.20
|
PP = $60.81
|
|
MB = $63.85
|
Most Recent Note - 9/29/2011 5:07:47 PM
G - Pulling back from its all-time high today. Extended from its prior base after a spurt of gains with above average volume. Prior resistance in the $59-60 area defines initial support to watch on pullbacks.
>>> The latest Featured Stock Update with an annotated graph appeared on 9/15/2011. Click here.
View all notes |
Alert me of new notes |
CANSLIM.net Company Profile |
SEC |
Zacks Reports |
StockTalk |
News |
Chart |
Request a new note
C
A N
S L
I M
|
ATHN
-
NASDAQ
Athenahealth Inc
DIVERSIFIED SERVICES - Business/Management Services
|
$63.09
|
+0.44
0.70% |
$64.18
|
461,852
54.11% of 50 DAV
50 DAV is 853,500
|
$72.70
-13.22%
|
9/8/2011
|
$61.93
|
PP = $61.78
|
|
MB = $64.87
|
Most Recent Note - 9/29/2011 6:50:55 PM
G - Still quietly consolidating above prior highs in the $61 area previously noted as initial support on pullbacks. Its 50 DMA line is the next nearest support level. See the latest FSU analysis for more details and a new annotated graph.
>>> The latest Featured Stock Update with an annotated graph appeared on 9/29/2011. Click here.
View all notes |
Alert me of new notes |
CANSLIM.net Company Profile |
SEC |
Zacks Reports |
StockTalk |
News |
Chart |
Request a new note
C
A N
S L
I M
|
CELG
-
NASDAQ
Celgene Corp
DRUGS - Drug Manufacturers - Major
|
$62.93
|
+0.53
0.85% |
$63.34
|
3,328,786
77.47% of 50 DAV
50 DAV is 4,296,900
|
$65.86
-4.45%
|
9/16/2011
|
$61.21
|
PP = $62.59
|
|
MB = $65.72
|
Most Recent Note - 9/28/2011 6:55:09 PM
Y - Down considerably today with a loss on below average volume, closing just under its pivot point. Following its breakout on 9/20/11 it abruptly pulled back near previously stubborn resistance in the $62 area which acted as a support level.
>>> The latest Featured Stock Update with an annotated graph appeared on 9/16/2011. Click here.
View all notes |
Alert me of new notes |
CANSLIM.net Company Profile |
SEC |
Zacks Reports |
StockTalk |
News |
Chart |
Request a new note
C
A N
S L
I M
|
CPA
-
NYSE
Copa Holdings Sa
TRANSPORTATION - Regional Airlines
|
$64.03
|
+0.69
1.09% |
$65.28
|
297,355
94.88% of 50 DAV
50 DAV is 313,400
|
$72.86
-12.12%
|
9/21/2011
|
$69.67
|
PP = $72.86
|
|
MB = $76.50
|
Most Recent Note - 9/29/2011 5:14:04 PM
G - Small gain today with below average volume. Holding its ground since a gap down on 9/22/11 violated its 50 DMA line and triggered a technical sell signal. Recent lows and its 200 DMA line define the next important support area to watch.
>>> The latest Featured Stock Update with an annotated graph appeared on 9/26/2011. Click here.
View all notes |
Alert me of new notes |
CANSLIM.net Company Profile |
SEC |
Zacks Reports |
StockTalk |
News |
Chart |
Request a new note
C
A N
S L
I M
|
Symbol/Exchange
Company Name
Industry Group |
PRICE |
CHANGE
(%Change) |
Day High |
Volume
(% DAV)
(% 50 day avg vol) |
52 Wk Hi
% From Hi |
Featured
Date |
Price
Featured |
Pivot Featured |
|
Max Buy |
DMND
-
NASDAQ
Diamond Foods Inc
FOOD and; BEVERAGE - Processed and; Packaged Goods
|
$81.89
|
+1.73
2.16% |
$82.77
|
950,108
247.04% of 50 DAV
50 DAV is 384,600
|
$96.13
-14.81%
|
9/13/2011
|
$75.57
|
PP = $80.16
|
|
MB = $84.17
|
Most Recent Note - 9/29/2011 12:13:22 PM
G - Small gap up today following 6 consecutive losses with above average volume that pressured it below its "max buy" level. It is testing prior highs in the $80 area previously noted as initial chart support to watch on pullbacks.
>>> The latest Featured Stock Update with an annotated graph appeared on 9/13/2011. Click here.
View all notes |
Alert me of new notes |
CANSLIM.net Company Profile |
SEC |
Zacks Reports |
StockTalk |
News |
Chart |
Request a new note
C
A N
S L
I M
|
EXLS
-
NASDAQ
Exlservice Holdings Inc
DIVERSIFIED SERVICES - Business/Management Services
|
$22.11
|
-0.27
-1.21% |
$22.83
|
115,833
54.92% of 50 DAV
50 DAV is 210,900
|
$26.55
-16.72%
|
8/2/2011
|
$24.85
|
PP = $24.85
|
|
MB = $26.09
|
Most Recent Note - 9/29/2011 5:34:28 PM
G - Light volume was behind its loss today as it slumped to a close just below its 200 DMA line. Only a prompt rebound would help its outlook, meanwhile more damaging losses would raise more serious concerns. See the latest FSU analysis for more details and a new annotated graph.
>>> The latest Featured Stock Update with an annotated graph appeared on 9/28/2011. Click here.
View all notes |
Alert me of new notes |
CANSLIM.net Company Profile |
SEC |
Zacks Reports |
StockTalk |
News |
Chart |
Request a new note
C
A N
S L
I M
|
JAZZ
-
NASDAQ
Jazz Pharmaceuticals Inc
DRUGS - Biotechnology
|
$41.68
|
-1.85
-4.25% |
$44.95
|
1,048,500
109.96% of 50 DAV
50 DAV is 953,500
|
$47.88
-12.95%
|
9/20/2011
|
$46.56
|
PP = $44.63
|
|
MB = $46.86
|
Most Recent Note - 9/29/2011 4:38:25 PM
Y - Loss today with slightly above average volume led to a slump under its pivot point raising concerns. It finished near the middle of its intra-day range after testing its 50 DMA line that defines important chart support to watch.
>>> The latest Featured Stock Update with an annotated graph appeared on 9/20/2011. Click here.
View all notes |
Alert me of new notes |
CANSLIM.net Company Profile |
SEC |
Zacks Reports |
StockTalk |
News |
Chart |
Request a new note
C
A N
S L
I M
|
MA
-
NYSE
Mastercard Inc Cl A
DIVERSIFIED SERVICES - Business/Management Services
|
$328.37
|
-1.45
-0.44% |
$337.79
|
1,022,867
63.63% of 50 DAV
50 DAV is 1,607,400
|
$361.94
-9.28%
|
8/3/2011
|
$324.82
|
PP = $322.38
|
|
MB = $338.50
|
Most Recent Note - 9/27/2011 8:07:14 PM
G - Stalled after recently rallying above prior resistance in the $340 area, and now consolidating above important support at its 50 DMA line.
>>> The latest Featured Stock Update with an annotated graph appeared on 9/12/2011. Click here.
View all notes |
Alert me of new notes |
CANSLIM.net Company Profile |
SEC |
Zacks Reports |
StockTalk |
News |
Chart |
Request a new note
C
A N
S L
I M
|
MG
-
NYSE
Mistras Group Inc
DIVERSIFIED SERVICES - Bulding and Faci;ity Management Services
|
$18.11
|
+0.01
0.06% |
$18.38
|
174,897
86.93% of 50 DAV
50 DAV is 201,200
|
$20.82
-13.02%
|
8/10/2011
|
$17.89
|
PP = $17.58
|
|
MB = $18.46
|
Most Recent Note - 9/28/2011 12:51:42 PM
G - Quietly slumping below its 50 DMA line today, raising concerns while testing prior lows in the $18 area previously noted as important chart support to watch.
>>> The latest Featured Stock Update with an annotated graph appeared on 9/9/2011. Click here.
View all notes |
Alert me of new notes |
CANSLIM.net Company Profile |
SEC |
Zacks Reports |
StockTalk |
News |
Chart |
Request a new note
C
A N
S L
I M
|
Symbol/Exchange
Company Name
Industry Group |
PRICE |
CHANGE
(%Change) |
Day High |
Volume
(% DAV)
(% 50 day avg vol) |
52 Wk Hi
% From Hi |
Featured
Date |
Price
Featured |
Pivot Featured |
|
Max Buy |
MKTX
-
NASDAQ
Marketaxess Holdings Inc
FINANCIAL SERVICES - Investment Brokerage - Nationa
|
$26.55
|
+0.19
0.72% |
$27.06
|
164,867
55.57% of 50 DAV
50 DAV is 296,700
|
$30.95
-14.21%
|
7/29/2011
|
$25.87
|
PP = $26.35
|
|
MB = $27.67
|
Most Recent Note - 9/28/2011 12:54:13 PM
G - Quietly slumping just under its 50 DMA line today after recently finding support near prior highs in the $26 area. See the latest FSU analysis for more details and a new annotated graph.
>>> The latest Featured Stock Update with an annotated graph appeared on 9/27/2011. Click here.
View all notes |
Alert me of new notes |
CANSLIM.net Company Profile |
SEC |
Zacks Reports |
StockTalk |
News |
Chart |
Request a new note
C
A N
S L
I M
|
PCLN
-
NASDAQ
Priceline.Com Inc
INTERNET - Internet Software and Services
|
$478.02
|
-20.07
-4.03% |
$506.78
|
2,383,198
170.42% of 50 DAV
50 DAV is 1,398,400
|
$561.88
-14.92%
|
9/20/2011
|
$539.46
|
PP = $552.25
|
|
MB = $579.86
|
Most Recent Note - 9/29/2011 5:01:37 PM
Above average volume was behind today's 6th damaging loss in the span of 7 sessions, violating its 200 DMA line and raising more serious concerns. A volume-driven gain did not trigger a proper new technical buy signal since its last pivot point was cited. Based on weak action it will be dropped from the Featured Stocks list tonight.
>>> The latest Featured Stock Update with an annotated graph appeared on 9/22/2011. Click here.
View all notes |
Alert me of new notes |
CANSLIM.net Company Profile |
SEC |
Zacks Reports |
StockTalk |
News |
Chart |
Request a new note
C
A N
S L
I M
|
PSMT
-
NASDAQ
Pricesmart Inc
RETAIL - Drug Stores
|
$63.93
|
-1.79
-2.72% |
$67.10
|
424,207
135.66% of 50 DAV
50 DAV is 312,700
|
$75.16
-14.94%
|
8/30/2011
|
$63.01
|
PP = $62.37
|
|
MB = $65.49
|
Most Recent Note - 9/29/2011 5:05:46 PM
G - Finished near the middle of its intra-day range with a loss on above average volume indicating distributional pressure. Tested support near its prior highs and its 50 DMA line noted as important chart support levels to watch.
>>> The latest Featured Stock Update with an annotated graph appeared on 9/14/2011. Click here.
View all notes |
Alert me of new notes |
CANSLIM.net Company Profile |
SEC |
Zacks Reports |
StockTalk |
News |
Chart |
Request a new note
C
A N
S L
I M
|
V
-
NYSE
Visa Inc Cl A
DIVERSIFIED SERVICES - Business/Management Services
|
$87.69
|
+0.06
0.07% |
$88.97
|
3,887,994
63.94% of 50 DAV
50 DAV is 6,080,300
|
$94.75
-7.45%
|
9/20/2011
|
$93.91
|
PP = $90.93
|
|
MB = $95.48
|
Most Recent Note - 9/27/2011 8:12:18 PM
Y - Consolidating quietly just under its pivot point and above important support at its 50 DMA line. It recently stalled after rallying to a new all-time high.
>>> The latest Featured Stock Update with an annotated graph appeared on 9/21/2011. Click here.
View all notes |
Alert me of new notes |
CANSLIM.net Company Profile |
SEC |
Zacks Reports |
StockTalk |
News |
Chart |
Request a new note
C
A N
S L
I M
|
|
|
|
THESE ARE NOT BUY RECOMMENDATIONS!
Comments contained in the body of this report are technical
opinions only. The material herein has been obtained
from sources believed to be reliable and accurate, however,
its accuracy and completeness cannot be guaranteed.
This site is not an investment advisor, hence it does
not endorse or recommend any securities or other investments.
Any recommendation contained in this report may not
be suitable for all investors and it is not to be deemed
an offer or solicitation on our part with respect to
the purchase or sale of any securities. All trademarks,
service marks and trade names appearing in this report
are the property of their respective owners, and are
likewise used for identification purposes only.
This report is a service available
only to active Paid Premium Members.
You may opt-out of receiving report notifications
at any time. Questions or comments may be submitted
by writing to Premium Membership Services 665 S.E. 10 Street, Suite 201 Deerfield Beach, FL 33441-5634 or by calling 1-800-965-8307
or 954-785-1121.
|
|
|

