***Last / Change / Volume data in this table is the closing quote data***
Symbol/Exchange
Company Name
Industry Group |
PRICE |
CHANGE
(%Change) |
Day High |
Volume
(% DAV)
(% 50 day avg vol) |
52 Wk Hi
% From Hi |
Featured
Date |
Price
Featured |
Pivot Featured |
|
Max Buy |
ABV
-
NYSE
Comp De Bebidas Adr
FOOD and BEVERAGE - Beverages - Brewers
|
$123.89
|
+0.85
0.69% |
$124.96
|
549,131
91.13% of 50 DAV
50 DAV is 602,600
|
$123.27
0.50%
|
6/29/2010
|
$104.74
|
PP = $109.33
|
|
MB = $114.80
|
Most Recent Note - 9/24/2010 4:12:57 PM
G - This Brazil-based beverage firm is hovering at its all-time high, stubbornly holding its ground after recent gains. Extended from a sound base, its prior highs in the $111-112 area define support above its 50 DMA line.
>>> The latest Featured Stock Update with an annotated graph appeared on 8/18/2010. Click here.
View all notes |
Alert me of new notes |
CANSLIM.net Company Profile |
SEC |
Zacks Reports |
StockTalk |
News |
Chart |
Request a new note
C
A N
S L
I M


|
ARUN
-
NASDAQ
Aruba Networks Inc
COMPUTER HARDWARE - Networking andamp; Communication Dev
|
$22.01
|
-0.23
-1.03% |
$22.36
|
1,402,393
68.53% of 50 DAV
50 DAV is 2,046,500
|
$22.80
-3.46%
|
8/30/2010
|
$18.12
|
PP = $18.51
|
|
MB = $19.44
|
Most Recent Note - 9/24/2010 11:42:33 AM
G - Following a positive reversal on the prior session it gapped up today. Extended from its latest base. Prior highs near $18 define a chart support level to watch.
>>> The latest Featured Stock Update with an annotated graph appeared on 9/2/2010. Click here.
View all notes |
Alert me of new notes |
CANSLIM.net Company Profile |
SEC |
Zacks Reports |
StockTalk |
News |
Chart |
Request a new note
C
A N
S L
I M
|
ASPS
-
NASDAQ
Altisource Ptf Sltns Sa
REAL ESTATE - Property Management/Developmen
|
$31.04
|
+1.23
4.13% |
$31.07
|
211,989
187.93% of 50 DAV
50 DAV is 112,800
|
$30.20
2.80%
|
9/23/2010
|
$28.36
|
PP = $28.90
|
|
MB = $30.35
|
 Most Recent Note - 9/29/2010 12:28:26 PM
G - Hitting a new 52-week high and trading above its "max buy" level, its color code is changed to green. This Luxembourg-based Financial Services firm has been strong since featured 9/23/10 in the mid-day report.
>>> The latest Featured Stock Update with an annotated graph appeared on 9/23/2010. Click here.
View all notes |
Alert me of new notes |
CANSLIM.net Company Profile |
SEC |
Zacks Reports |
StockTalk |
News |
Chart |
Request a new note
C
A N
S L
I M
|
BIDU
-
NASDAQ
Baidu Inc Ads
INTERNET - Internet Information Providers
|
$103.72
|
+1.68
1.65% |
$104.00
|
11,551,179
118.94% of 50 DAV
50 DAV is 9,712,000
|
$107.19
-3.24%
|
9/17/2010
|
$85.73
|
PP = $88.42
|
|
MB = $92.84
|
Most Recent Note - 9/28/2010 12:33:32 PM
G - Churning above average volume today at an all-time high after 6 consecutive gains. Volume totals have been above average but not extremely heavy, yet it has the look of a climax run. Prior highs in the $88 area define support now.
>>> The latest Featured Stock Update with an annotated graph appeared on 8/13/2010. Click here.
View all notes |
Alert me of new notes |
CANSLIM.net Company Profile |
SEC |
Zacks Reports |
StockTalk |
News |
Chart |
Request a new note
C
A N
S L
I M
|
CACC
-
NASDAQ
Credit Acceptance Corp
FINANCIAL SERVICES - Credit Services
|
$61.55
|
+0.08
0.13% |
$61.87
|
21,824
50.64% of 50 DAV
50 DAV is 43,100
|
$63.45
-2.99%
|
7/29/2010
|
$52.04
|
PP = $54.07
|
|
MB = $56.77
|
Most Recent Note - 9/27/2010 5:30:46 PM
G - Loss today on light volume, slumping back under an important prior high ($61.41). Noted previously, an upward trendline defines support above its 50 DMA line and its recent chart low ($56.06).
>>> The latest Featured Stock Update with an annotated graph appeared on 8/2/2010. Click here.
View all notes |
Alert me of new notes |
CANSLIM.net Company Profile |
SEC |
Zacks Reports |
StockTalk |
News |
Chart |
Request a new note
C
A N
S L
I M
|
Symbol/Exchange
Company Name
Industry Group |
PRICE |
CHANGE
(%Change) |
Day High |
Volume
(% DAV)
(% 50 day avg vol) |
52 Wk Hi
% From Hi |
Featured
Date |
Price
Featured |
Pivot Featured |
|
Max Buy |
CMG
-
NYSE
Chipotle Mexican Grill
LEISURE - Restaurants
|
$176.03
|
-0.64
-0.36% |
$177.18
|
677,182
95.81% of 50 DAV
50 DAV is 706,800
|
$176.99
-0.54%
|
9/1/2010
|
$158.31
|
PP = $155.52
|
|
MB = $163.30
|
Most Recent Note - 9/24/2010 4:00:31 PM
G - Gapped up today for a solid gain with above average volume, reaching a new all-time high. Extended from prior highs in the $155 area that define chart support.
>>> The latest Featured Stock Update with an annotated graph appeared on 9/1/2010. Click here.
View all notes |
Alert me of new notes |
CANSLIM.net Company Profile |
SEC |
Zacks Reports |
StockTalk |
News |
Chart |
Request a new note
C
A N
S L
I M
|
CRM
-
NYSE
Salesforce.Com Inc
INTERNET - Internet Software and Services
|
$113.58
|
-1.19
-1.04% |
$115.78
|
3,775,844
139.34% of 50 DAV
50 DAV is 2,709,900
|
$123.77
-8.23%
|
6/2/2010
|
$88.44
|
PP = $89.60
|
|
MB = $94.08
|
Most Recent Note - 9/28/2010 4:48:38 PM
G - Loss today with slightly higher volume led to a damaging loss under its recent lows. It stalled following its 9/20/10 gain with +54% above average volume from an advanced "3-weeks tight" type pattern.
>>> The latest Featured Stock Update with an annotated graph appeared on 8/16/2010. Click here.
View all notes |
Alert me of new notes |
CANSLIM.net Company Profile |
SEC |
Zacks Reports |
StockTalk |
News |
Chart |
Request a new note
C
A N
S L
I M
|
CTRP
-
NASDAQ
Ctrip.Com Intl Ltd Adr
LEISURE - Resorts and Casinos
|
$47.99
|
+0.22
0.45% |
$48.47
|
1,057,030
59.17% of 50 DAV
50 DAV is 1,786,300
|
$49.23
-2.53%
|
9/24/2010
|
$46.75
|
PP = $47.11
|
|
MB = $49.47
|
Most Recent Note - 9/28/2010 6:15:03 PM
Y - Pulled back from its 52-week high today after 7 consecutive gains with ever-increasing volume. Volume total +74% above average on 9/27/10 with its gain above the pivot point triggered a technical buy signal soon after it was featured in yellow in the 9/24/10 mid-day report (read here). No overhead supply remains to act as resistance, while the price/volume action has been choppy since it was dropped from the Featured Stocks list on 5/06/10. Quarterly and annual earnings history has been strong (good C and A criteria). Leadership (L criteria) in the stock's Industry Group (Leisure - Travel Booking) is a reassuring sign.
>>> The latest Featured Stock Update with an annotated graph appeared on 9/28/2010. Click here.
View all notes |
Alert me of new notes |
CANSLIM.net Company Profile |
SEC |
Zacks Reports |
StockTalk |
News |
Chart |
Request a new note
C
A N
S L
I M
|
EBIX
-
NASDAQ
Ebix Inc
COMPUTER SOFTWARE and SERVICES - Business Software and Services
|
$23.84
|
-0.16
-0.67% |
$24.60
|
802,724
165.61% of 50 DAV
50 DAV is 484,700
|
$24.20
-1.49%
|
9/23/2010
|
$21.78
|
PP = $22.74
|
|
MB = $23.88
|
Most Recent Note - 9/29/2010 12:38:16 PM
G - After a streak of consecutive gains with heavy volume it is perched at an all-time high, yet could go on to produce more climactic gains. Recent highs near $20 define chart support to watch.
>>> The latest Featured Stock Update with an annotated graph appeared on 9/24/2010. Click here.
View all notes |
Alert me of new notes |
CANSLIM.net Company Profile |
SEC |
Zacks Reports |
StockTalk |
News |
Chart |
Request a new note
C
A N
S L
I M
|
EGO
-
NYSE
Eldorado Gold Corp
METALS and MINING - Gold
|
$19.05
|
+0.05
0.26% |
$19.32
|
6,050,081
138.18% of 50 DAV
50 DAV is 4,378,300
|
$20.23
-5.83%
|
8/19/2010
|
$18.25
|
PP = $19.17
|
|
MB = $20.13
|
Most Recent Note - 9/28/2010 4:31:37 PM
Y - Posted a solid gain today with more than 2 times average volume, rallying for an impressive positive reversal after gapping down and briefly trading under its 50 DMA line.
>>> The latest Featured Stock Update with an annotated graph appeared on 8/19/2010. Click here.
View all notes |
Alert me of new notes |
CANSLIM.net Company Profile |
SEC |
Zacks Reports |
StockTalk |
News |
Chart |
Request a new note
C
A N
S L
I M
|
Symbol/Exchange
Company Name
Industry Group |
PRICE |
CHANGE
(%Change) |
Day High |
Volume
(% DAV)
(% 50 day avg vol) |
52 Wk Hi
% From Hi |
Featured
Date |
Price
Featured |
Pivot Featured |
|
Max Buy |
FFIV
-
NASDAQ
F 5 Networks Inc
INTERNET - Internet Software and Services
|
$104.41
|
+0.35
0.34% |
$105.50
|
1,318,003
77.85% of 50 DAV
50 DAV is 1,692,900
|
$105.72
-1.24%
|
6/16/2010
|
$74.50
|
PP = $74.10
|
|
MB = $77.81
|
Most Recent Note - 9/28/2010 5:02:36 PM
G - Posted a 4th consecutive small gain, holding its ground near all-time highs. A steep upward trendline connecting July-August lows defines an initial chart support level above its 50 DMA line.
>>> The latest Featured Stock Update with an annotated graph appeared on 9/13/2010. Click here.
View all notes |
Alert me of new notes |
CANSLIM.net Company Profile |
SEC |
Zacks Reports |
StockTalk |
News |
Chart |
Request a new note
C
A N
S L
I M
|
FOSL
-
NASDAQ
Fossil Inc
CONSUMER DURABLES - Recreational Goods, Other
|
$52.89
|
-1.70
-3.11% |
$53.83
|
1,621,984
211.39% of 50 DAV
50 DAV is 767,300
|
$54.76
-3.41%
|
8/10/2010
|
$45.54
|
PP = $42.69
|
|
MB = $44.82
|
Most Recent Note - 9/29/2010 12:50:15 PM
G - Gapped down today for a small loss. Still near its all-time high after recent signs of distribution, an upward trendline defines initial support to watch after it has been repeatedly noted as "extended from any sound base."
>>> The latest Featured Stock Update with an annotated graph appeared on 8/11/2010. Click here.
View all notes |
Alert me of new notes |
CANSLIM.net Company Profile |
SEC |
Zacks Reports |
StockTalk |
News |
Chart |
Request a new note
C
A N
S L
I M
|
GMCR
-
NASDAQ
Green Mtn Coffee Roastrs
FOOD and BEVERAGE - Processed and Packaged Goods
|
$31.06
|
-5.95
-16.08% |
$32.18
|
31,455,300
1,234.22% of 50 DAV
50 DAV is 2,548,600
|
$37.97
-18.20%
|
8/17/2010
|
$33.62
|
PP = $33.30
|
|
MB = $34.97
|
Most Recent Note - 9/29/2010 11:29:35 AM
G - Considerable gap down today for a damaging loss on very heavy volume amid headlines as the SEC probes its reporting of revenue. Technically it fell into its prior base and violated its 50 DMA line, triggering sell signals.
>>> The latest Featured Stock Update with an annotated graph appeared on 8/17/2010. Click here.
View all notes |
Alert me of new notes |
CANSLIM.net Company Profile |
SEC |
Zacks Reports |
StockTalk |
News |
Chart |
Request a new note
C
A N
S L
I M
|
HMSY
-
NASDAQ
H M S Holdings Corp
COMPUTER SOFTWARE and SERVICES - Healthcare Information Service
|
$59.16
|
+0.37
0.63% |
$59.47
|
130,376
68.62% of 50 DAV
50 DAV is 190,000
|
$58.86
0.51%
|
9/27/2010
|
$57.97
|
PP = $58.36
|
|
MB = $61.28
|
Most Recent Note - 9/27/2010 12:56:39 PM
Y - Color code is changed to yellow with pivot point cited based on its 52-week high plus ten cents. Healthy action has continued since last noted in the mid-day report on 7/30/10 - "Patient investors may watch for an ideal new base pattern to form. This high-ranked Commercial Services - Healthcare firm has maintained a solid sales revenues and earnings growth history that still satisfies the C and A criteria, and it has rebounded impressively since it was dropped from the Featured Stocks list on 8/10/09."
>>> The latest Featured Stock Update with an annotated graph appeared on 9/27/2010. Click here.
View all notes |
Alert me of new notes |
CANSLIM.net Company Profile |
SEC |
Zacks Reports |
StockTalk |
News |
Chart |
Request a new note
C
A N
S L
I M
|
HS
-
NYSE
Healthspring Inc
HEALTH SERVICES - Health Care Plans
|
$26.77
|
+0.62
2.37% |
$26.90
|
564,404
76.27% of 50 DAV
50 DAV is 740,000
|
$26.28
1.86%
|
8/27/2010
|
$19.91
|
PP = $19.75
|
|
MB = $20.74
|
Most Recent Note - 9/24/2010 12:40:41 PM
G - Hit a new 52-week high and all-time high with today's 6th consecutive gain. Support to watch is prior chart highs in the $19-20 area. Disciplined investors do not chase stocks that are extended from a sound base.
>>> The latest Featured Stock Update with an annotated graph appeared on 8/27/2010. Click here.
View all notes |
Alert me of new notes |
CANSLIM.net Company Profile |
SEC |
Zacks Reports |
StockTalk |
News |
Chart |
Request a new note
C
A N
S L
I M
|
Symbol/Exchange
Company Name
Industry Group |
PRICE |
CHANGE
(%Change) |
Day High |
Volume
(% DAV)
(% 50 day avg vol) |
52 Wk Hi
% From Hi |
Featured
Date |
Price
Featured |
Pivot Featured |
|
Max Buy |
IGTE
-
NASDAQ
Igate Corp
COMPUTER SOFTWARE and SERVICES - Information Technology Service
|
$18.84
|
-0.12
-0.63% |
$19.00
|
199,936
48.55% of 50 DAV
50 DAV is 411,800
|
$19.45
-3.14%
|
9/8/2010
|
$17.29
|
PP = $18.26
|
|
MB = $19.17
|
Most Recent Note - 9/24/2010 12:04:08 PM
Y - Gapped up today following the latest sign of more distributional pressure, but concerns are raised by its lack of meaningful price progress above prior highs in the past 2 weeks while volume totals have been above average .
>>> The latest Featured Stock Update with an annotated graph appeared on 9/10/2010. Click here.
View all notes |
Alert me of new notes |
CANSLIM.net Company Profile |
SEC |
Zacks Reports |
StockTalk |
News |
Chart |
Request a new note
C
A N
S L
I M
|
JOBS
-
NASDAQ
Fifty One Job Inc Ads
DIVERSIFIED SERVICES - Staffing and; Outsourcing Service
|
$38.12
|
-0.07
-0.18% |
$38.57
|
79,804
57.21% of 50 DAV
50 DAV is 139,500
|
$39.19
-2.73%
|
9/16/2010
|
$31.59
|
PP = $30.40
|
|
MB = $31.92
|
Most Recent Note - 9/24/2010 12:41:59 PM
G - Hit another new 52-week high today. Very extended from a sound base, its prior highs in the $30 area define chart support now.
>>> The latest Featured Stock Update with an annotated graph appeared on 9/16/2010. Click here.
View all notes |
Alert me of new notes |
CANSLIM.net Company Profile |
SEC |
Zacks Reports |
StockTalk |
News |
Chart |
Request a new note
C
A N
S L
I M
|
MELI
-
NASDAQ
Mercadolibre Inc
INTERNET - Internet Software and; Services
|
$75.14
|
+0.24
0.32% |
$75.50
|
454,935
55.58% of 50 DAV
50 DAV is 818,500
|
$76.81
-2.17%
|
5/13/2010
|
$54.21
|
PP = $55.85
|
|
MB = $58.64
|
Most Recent Note - 9/28/2010 1:01:46 PM
G - Perched at its 52-week high today after a considerable gain with the heaviest volume total in a month. Extended from a sound base. Its 50 DMA line defines important chart support.
>>> The latest Featured Stock Update with an annotated graph appeared on 8/26/2010. Click here.
View all notes |
Alert me of new notes |
CANSLIM.net Company Profile |
SEC |
Zacks Reports |
StockTalk |
News |
Chart |
Request a new note
C
A N
S L
I M
|
MRX
-
NYSE
Medicis Pharmaceut Cl A
DRUGS - Biotechnology
|
$29.68
|
-0.50
-1.66% |
$30.10
|
585,454
48.17% of 50 DAV
50 DAV is 1,215,400
|
$30.29
-2.01%
|
8/12/2010
|
$26.88
|
PP = $26.71
|
|
MB = $28.05
|
Most Recent Note - 9/29/2010 4:39:41 PM
G - Small gap down for a loss on light volume today. Still hovering near its 2010 high with volume totals cooling the past few sessions. Prior highs in the $28 area define the initial chart support level to watch.
>>> The latest Featured Stock Update with an annotated graph appeared on 8/12/2010. Click here.
View all notes |
Alert me of new notes |
CANSLIM.net Company Profile |
SEC |
Zacks Reports |
StockTalk |
News |
Chart |
Request a new note
C
A N
S L
I M
|
MWIV
-
NASDAQ
M W I Veterinary Supply
HEALTH SERVICES - Medical Instruments and; Supplies
|
$57.97
|
+0.30
0.52% |
$58.20
|
28,216
38.28% of 50 DAV
50 DAV is 73,700
|
$57.99
-0.03%
|
7/29/2010
|
$52.05
|
PP = $52.09
|
|
MB = $54.69
|
Most Recent Note - 9/24/2010 4:10:12 PM
G - Gain today on light volume, and no overhead supply remains to act as resistance. Its 50 DMA line defines important chart support.
>>> The latest Featured Stock Update with an annotated graph appeared on 9/7/2010. Click here.
View all notes |
Alert me of new notes |
CANSLIM.net Company Profile |
SEC |
Zacks Reports |
StockTalk |
News |
Chart |
Request a new note
C
A N
S L
I M
|
Symbol/Exchange
Company Name
Industry Group |
PRICE |
CHANGE
(%Change) |
Day High |
Volume
(% DAV)
(% 50 day avg vol) |
52 Wk Hi
% From Hi |
Featured
Date |
Price
Featured |
Pivot Featured |
|
Max Buy |
NEM
-
NYSE
Newmont Mining Corp
METALS and MINING - Gold
|
$63.90
|
-0.33
-0.51% |
$64.46
|
6,368,873
102.10% of 50 DAV
50 DAV is 6,237,900
|
$65.50
-2.44%
|
8/31/2010
|
$61.32
|
PP = $63.48
|
|
MB = $66.65
|
Most Recent Note - 9/28/2010 4:40:32 PM
Y - Positive reversal today for a solid gain, rallying back its pivot point with above average volume following a gap down and 3 consecutive losses on lighter volume. No overhead supply remains to hinder its progress. Leadership in the Mining - Gold/Silver/Gems group (L criteria) is a nice reassurance.
>>> The latest Featured Stock Update with an annotated graph appeared on 9/14/2010. Click here.
View all notes |
Alert me of new notes |
CANSLIM.net Company Profile |
SEC |
Zacks Reports |
StockTalk |
News |
Chart |
Request a new note
C
A N
S L
I M
|
NEOG
-
NASDAQ
Neogen Corp
DRUGS - Diagnostic Substances
|
$34.25
|
-0.43
-1.24% |
$34.66
|
84,054
79.15% of 50 DAV
50 DAV is 106,200
|
$34.76
-1.47%
|
9/1/2010
|
$30.79
|
PP = $30.49
|
|
MB = $32.01
|
Most Recent Note - 9/28/2010 4:41:52 PM
G- Posted a 3rd consecutive gain today with average volume for another new high. Prior highs in the $30 area define initial support to watch.
>>> The latest Featured Stock Update with an annotated graph appeared on 8/20/2010. Click here.
View all notes |
Alert me of new notes |
CANSLIM.net Company Profile |
SEC |
Zacks Reports |
StockTalk |
News |
Chart |
Request a new note
C
A N
S L
I M
|
NFLX
-
NASDAQ
Netflix Inc
SPECIALTY RETAIL - Music and Video Stores
|
$170.63
|
+8.77
5.42% |
$170.75
|
7,781,091
143.22% of 50 DAV
50 DAV is 5,433,100
|
$167.12
2.10%
|
8/10/2010
|
$124.05
|
PP = $124.00
|
|
MB = $130.20
|
Most Recent Note - 9/29/2010 4:53:29 PM
G - Closed near its session high and at an all-time high with a gain today backed by above average volume. It is extended from a sound base pattern. Prior highs define important support to watch along with an upward trendline that comes into play well above its 50 DMA line.
>>> The latest Featured Stock Update with an annotated graph appeared on 8/10/2010. Click here.
View all notes |
Alert me of new notes |
CANSLIM.net Company Profile |
SEC |
Zacks Reports |
StockTalk |
News |
Chart |
Request a new note
C
A N
S L
I M
|
NTAP
-
NASDAQ
Netapp Inc
COMPUTER HARDWARE - Data Storage Devices
|
$50.81
|
-0.19
-0.37% |
$51.30
|
6,403,039
80.71% of 50 DAV
50 DAV is 7,933,000
|
$51.40
-1.15%
|
9/8/2010
|
$46.98
|
PP = $44.99
|
|
MB = $47.24
|
Most Recent Note - 9/28/2010 4:37:09 PM
G - Hit another new 52-week high today, getting more extended from a sound base. Support to watch is at prior chart highs near its latest pivot point.
>>> The latest Featured Stock Update with an annotated graph appeared on 9/8/2010. Click here.
View all notes |
Alert me of new notes |
CANSLIM.net Company Profile |
SEC |
Zacks Reports |
StockTalk |
News |
Chart |
Request a new note
C
A N
S L
I M
|
ORCL
-
NASDAQ
Oracle Corp
COMPUTER SOFTWARE and SERVICES - Application Software
|
$27.17
|
-0.02
-0.08% |
$27.30
|
36,624,038
102.61% of 50 DAV
50 DAV is 35,691,600
|
$27.63
-1.65%
|
9/20/2010
|
$27.32
|
PP = $26.73
|
|
MB = $28.07
|
Most Recent Note - 9/27/2010 5:45:16 PM
Y - Holding its ground in a tight trading range since its "breakaway gap" on 9/17/10 backed by 5 times average volume.
>>> The latest Featured Stock Update with an annotated graph appeared on 9/20/2010. Click here.
View all notes |
Alert me of new notes |
CANSLIM.net Company Profile |
SEC |
Zacks Reports |
StockTalk |
News |
Chart |
Request a new note
C
A N
S L
I M
|
Symbol/Exchange
Company Name
Industry Group |
PRICE |
CHANGE
(%Change) |
Day High |
Volume
(% DAV)
(% 50 day avg vol) |
52 Wk Hi
% From Hi |
Featured
Date |
Price
Featured |
Pivot Featured |
|
Max Buy |
PAY
-
NYSE
Verifone Systems Inc
COMPUTER HARDWARE - Transaction Automation Systems
|
$29.05
|
+0.04
0.14% |
$29.29
|
879,367
64.86% of 50 DAV
50 DAV is 1,355,700
|
$29.54
-1.67%
|
8/25/2010
|
$24.30
|
PP = $23.74
|
|
MB = $24.93
|
Most Recent Note - 9/24/2010 4:03:18 PM
G - Gapped up today for a solid gain with average volume. Extended from a sound base, its prior highs in the $23 area define chart support.
>>> The latest Featured Stock Update with an annotated graph appeared on 8/30/2010. Click here.
View all notes |
Alert me of new notes |
CANSLIM.net Company Profile |
SEC |
Zacks Reports |
StockTalk |
News |
Chart |
Request a new note
C
A N
S L
I M
|
PRGO
-
NASDAQ
Perrigo Co
DRUGS - Drug Related Products
|
$64.51
|
-0.95
-1.45% |
$65.48
|
1,231,144
114.88% of 50 DAV
50 DAV is 1,071,700
|
$67.49
-4.42%
|
9/15/2010
|
$63.73
|
PP = $64.76
|
|
MB = $68.00
|
Most Recent Note - 9/27/2010 5:54:05 PM
Y - Pulled back today on lighter volume. Its 9/24/10 gap up gain with +50% above average volume for a new 52-week high triggered a technical buy signal with volume near the minimum guideline. It was first featured in the 9/15/10 mid-day report.
>>> The latest Featured Stock Update with an annotated graph appeared on 9/15/2010. Click here.
View all notes |
Alert me of new notes |
CANSLIM.net Company Profile |
SEC |
Zacks Reports |
StockTalk |
News |
Chart |
Request a new note
C
A N
S L
I M
|
RAX
-
NYSE
Rackspace Hosting Inc
INTERNET - Internet Software and; Services
|
$26.07
|
-0.04
-0.15% |
$26.16
|
3,336,126
187.99% of 50 DAV
50 DAV is 1,774,600
|
$26.50
-1.62%
|
9/21/2010
|
$22.84
|
PP = $23.61
|
|
MB = $24.79
|
Most Recent Note - 9/29/2010 1:07:12 PM
Y - Pulling back today following a "breakaway gap" to a new 52-week high. Noted on 9/28/10 - "A breakaway gap is one exception where chasing a stock more than +5% above prior highs is permitted. While patient investors may watch for pullbacks, no overhead supply remains to hinder its progress."
>>> The latest Featured Stock Update with an annotated graph appeared on 9/21/2010. Click here.
View all notes |
Alert me of new notes |
CANSLIM.net Company Profile |
SEC |
Zacks Reports |
StockTalk |
News |
Chart |
Request a new note
C
A N
S L
I M
|
ROVI
-
NASDAQ
Rovi Corp
COMPUTER SOFTWARE andamp; SERVICES - Security Software andamp; Services
|
$52.31
|
+0.21
0.40% |
$53.00
|
4,153,863
304.33% of 50 DAV
50 DAV is 1,364,900
|
$52.28
0.06%
|
8/31/2010
|
$43.31
|
PP = $45.06
|
|
MB = $47.31
|
Most Recent Note - 9/28/2010 1:21:03 PM
G - Hit yet another new 52-week high today, adding to the recent streak of big gains on above average volume, It is extended from its latest base, and prior highs in the $45 area define chart support to watch now.
>>> The latest Featured Stock Update with an annotated graph appeared on 8/24/2010. Click here.
View all notes |
Alert me of new notes |
CANSLIM.net Company Profile |
SEC |
Zacks Reports |
StockTalk |
News |
Chart |
Request a new note
C
A N
S L
I M
|
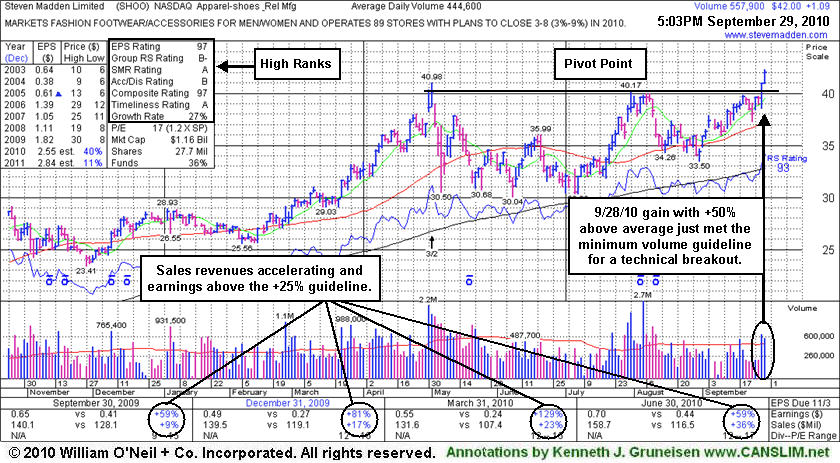
SHOO
-
NASDAQ
Steven Madden Limited
CONSUMER NON-DURABLES - Textile - Apparel Footwear
|
$42.00
|
+1.09
2.66% |
$42.28
|
557,988
128.27% of 50 DAV
50 DAV is 435,000
|
$41.03
2.36%
|
9/15/2010
|
$38.94
|
PP = $40.27
|
|
MB = $42.28
|
Most Recent Note - 9/29/2010 4:57:08 PM
Y - Posted a 2nd consecutive gain today with above average volume hitting new 52-week highs. A solid gain on 9/28/10 with +50% above average volume triggered a technical buy signal.
>>> The latest Featured Stock Update with an annotated graph appeared on 9/29/2010. Click here.
View all notes |
Alert me of new notes |
CANSLIM.net Company Profile |
SEC |
Zacks Reports |
StockTalk |
News |
Chart |
Request a new note
C
A N
S L
I M
|
Symbol/Exchange
Company Name
Industry Group |
PRICE |
CHANGE
(%Change) |
Day High |
Volume
(% DAV)
(% 50 day avg vol) |
52 Wk Hi
% From Hi |
Featured
Date |
Price
Featured |
Pivot Featured |
|
Max Buy |
SLW
-
NYSE
Silver Wheaton Corp
METALS and; MINING - Silver
|
$26.99
|
+0.24
0.90% |
$27.09
|
7,314,734
140.47% of 50 DAV
50 DAV is 5,207,200
|
$27.04
-0.18%
|
8/25/2010
|
$21.40
|
PP = $21.99
|
|
MB = $23.09
|
Most Recent Note - 9/28/2010 1:24:34 PM
G - Consolidating after a streak of 5 consecutive gains with above average volume, holding its ground near an all-time high, extended from a sound base. Prior highs in the $21 area define chart support to watch.
>>> The latest Featured Stock Update with an annotated graph appeared on 8/25/2010. Click here.
View all notes |
Alert me of new notes |
CANSLIM.net Company Profile |
SEC |
Zacks Reports |
StockTalk |
News |
Chart |
Request a new note
C
A N
S L
I M
|
SVR
-
NYSE
Syniverse Holdings Inc
TELECOMMUNICATIONS - Diversified Communication Serv
|
$23.31
|
-0.73
-3.04% |
$23.91
|
698,904
100.58% of 50 DAV
50 DAV is 694,900
|
$24.24
-3.84%
|
9/22/2010
|
$23.60
|
PP = $23.87
|
|
MB = $25.06
|
Most Recent Note - 9/29/2010 4:37:08 PM
Y - Pulling back again today with higher (near average) volume, raising concerns and closing near the session low while slumping under its pivot point. A considerable gap up gain on 9/24/10 with +64% above average volume helped it hit a new 52-week high, technically triggering a buy signal 2 days after it was first featured in yellow in the mid-day report. Price gaps on charts are often noteworthy signs indicative of institutional positioning.
>>> The latest Featured Stock Update with an annotated graph appeared on 9/22/2010. Click here.
View all notes |
Alert me of new notes |
CANSLIM.net Company Profile |
SEC |
Zacks Reports |
StockTalk |
News |
Chart |
Request a new note
C
A N
S L
I M
|
UA
-
NYSE
Under Armour Inc Cl A
CONSUMER NON-DURABLES - Textile - Apparel Clothing
|
$45.50
|
+0.03
0.07% |
$46.05
|
503,979
66.99% of 50 DAV
50 DAV is 752,300
|
$46.10
-1.30%
|
9/9/2010
|
$39.99
|
PP = $40.10
|
|
MB = $42.11
|
Most Recent Note - 9/28/2010 5:00:03 PM
G - Closed at a new 2010 high today with its 18th gain in 20 sessions. It is extended from its latest sound base pattern.
>>> The latest Featured Stock Update with an annotated graph appeared on 9/9/2010. Click here.
View all notes |
Alert me of new notes |
CANSLIM.net Company Profile |
SEC |
Zacks Reports |
StockTalk |
News |
Chart |
Request a new note
C
A N
S L
I M
|
UFPT
-
NASDAQ
U F P Tech Inc
CONSUMER NON-DURABLES - Packaging and Containers
|
$11.53
|
+0.14
1.23% |
$11.79
|
69,046
152.42% of 50 DAV
50 DAV is 45,300
|
$11.85
-2.70%
|
9/16/2010
|
$11.20
|
PP = $11.69
|
|
MB = $12.27
|
Most Recent Note - 9/28/2010 1:33:09 PM
Y - Gain today with lighter volume follows 3 consecutive losses with heavier above average volume. Recently enduring distributional pressure near its 52-week high and pivot point. No resistance remains due to overhead supply, and with only 6.21 million shares outstanding (S criteria) any institutional buying or selling can lead to greater price volatility.
>>> The latest Featured Stock Update with an annotated graph appeared on 9/17/2010. Click here.
View all notes |
Alert me of new notes |
CANSLIM.net Company Profile |
SEC |
Zacks Reports |
StockTalk |
News |
Chart |
Request a new note
C
A N
S L
I M
|
ULTA
-
NASDAQ
Ulta Salon Cosm & Frag
SPECIALTY RETAIL - Specialty Retail, Other
|
$29.82
|
+0.47
1.60% |
$30.19
|
732,002
119.73% of 50 DAV
50 DAV is 611,400
|
$29.47
1.19%
|
9/3/2010
|
$26.36
|
PP = $25.89
|
|
MB = $27.18
|
Most Recent Note - 9/28/2010 4:44:28 PM
G - Gain today on average volume for its best close of the year. Prior highs in the $26 area define support to watch now.
>>> The latest Featured Stock Update with an annotated graph appeared on 9/3/2010. Click here.
View all notes |
Alert me of new notes |
CANSLIM.net Company Profile |
SEC |
Zacks Reports |
StockTalk |
News |
Chart |
Request a new note
C
A N
S L
I M
|
Symbol/Exchange
Company Name
Industry Group |
PRICE |
CHANGE
(%Change) |
Day High |
Volume
(% DAV)
(% 50 day avg vol) |
52 Wk Hi
% From Hi |
Featured
Date |
Price
Featured |
Pivot Featured |
|
Max Buy |
VIT
-
NYSE
Vanceinfo Tech Inc Ads
COMPUTER SOFTWARE and SERVICES - Business Software and Services
|
$32.26
|
-0.57
-1.74% |
$33.14
|
1,362,263
232.91% of 50 DAV
50 DAV is 584,900
|
$33.30
-3.12%
|
7/8/2010
|
$25.20
|
PP = $26.58
|
|
MB = $27.91
|
Most Recent Note - 9/29/2010 1:12:35 PM
G - Holding its ground stubbornly at its all-time high. It is extended after rallying from a prior resistance level in the $26 area. Its 50 DMA line defines chart support to watch.
>>> The latest Featured Stock Update with an annotated graph appeared on 8/31/2010. Click here.
View all notes |
Alert me of new notes |
CANSLIM.net Company Profile |
SEC |
Zacks Reports |
StockTalk |
News |
Chart |
Request a new note
C
A N
S L
I M
|
WCRX
-
NASDAQ
Warner Chilcott Plc
DRUGS - Drug Manufacturers - Other
|
$22.47
|
+0.01
0.04% |
$22.62
|
2,253,920
90.77% of 50 DAV
50 DAV is 2,483,100
|
$23.53
-4.50%
|
8/23/2010
|
$21.04
|
PP = $20.84
|
|
MB = $21.88
|
Most Recent Note - 9/28/2010 4:46:01 PM
G - Today it endured more distributional pressure. Extended from its latest base, its prior highs define chart support in the $20-21 area.
>>> The latest Featured Stock Update with an annotated graph appeared on 8/23/2010. Click here.
View all notes |
Alert me of new notes |
CANSLIM.net Company Profile |
SEC |
Zacks Reports |
StockTalk |
News |
Chart |
Request a new note
C
A N
S L
I M
|