***Last / Change / Volume data in this table is the closing quote data***
Symbol/Exchange
Company Name
Industry Group |
PRICE |
CHANGE
(%Change) |
Day High |
Volume
(% DAV)
(% 50 day avg vol) |
52 Wk Hi
% From Hi |
Featured
Date |
Price
Featured |
Pivot Featured |
|
Max Buy |
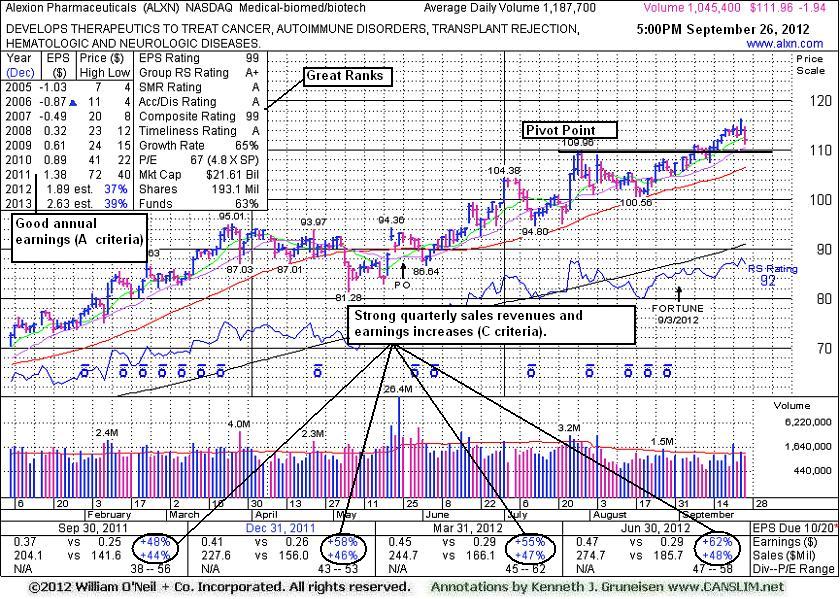
ALXN
-
NASDAQ
Alexion Pharmaceuticals
DRUGS - Drug Manufacturers - Other
|
$111.96
|
-1.94
-1.70% |
$114.81
|
1,050,629
88.46% of 50 DAV
50 DAV is 1,187,700
|
$116.43
-3.84%
|
8/23/2012
|
$103.70
|
PP = $110.06
|
|
MB = $115.56
|
 Most Recent Note - 9/26/2012 5:15:16 PM
Y - Pulled back from its 52 week high today. Color code is changed to yellow after retreating below its "max buy" level. See the latest FSU analysis for more details and a new annotated graph.
>>> The latest Featured Stock Update with an annotated graph appeared on 9/26/2012. Click here.
View all notes |
Alert me of new notes |
CANSLIM.net Company Profile |
SEC |
Zacks Reports |
StockTalk |
News |
Chart |
Request a new note
C
A N
S L
I M


|
ASPS
-
NASDAQ
Altisource Ptf Sltns Sa
REAL ESTATE - Property Management/Developmen
|
$84.20
|
-1.07
-1.25% |
$85.63
|
140,467
109.65% of 50 DAV
50 DAV is 128,100
|
$92.29
-8.77%
|
9/24/2012
|
$87.24
|
PP = $92.39
|
|
MB = $97.01
|
Most Recent Note - 9/24/2012 4:23:58 PM
Y - Color code is changed to yellow with new pivot point cited based on its 8/20/12 high plus 10 cents. Volume-driven gains above its pivot point may trigger a new (or add-on) technical buy signal. Recent lows define near-term support along with its 50 DMA line.
>>> The latest Featured Stock Update with an annotated graph appeared on 9/11/2012. Click here.
View all notes |
Alert me of new notes |
CANSLIM.net Company Profile |
SEC |
Zacks Reports |
StockTalk |
News |
Chart |
Request a new note
C
A N
S L
I M
|
CFNL
-
NASDAQ
Cardinal Financial Corp
BANKING - Regional - Southeast Banks
|
$14.37
|
-0.06
-0.42% |
$14.55
|
113,549
166.01% of 50 DAV
50 DAV is 68,400
|
$14.79
-2.84%
|
8/17/2012
|
$12.84
|
PP = $13.31
|
|
MB = $13.98
|
Most Recent Note - 9/25/2012 11:56:59 AM
G - Trading near its 52-week high today, adding to its spurt of volume-driven gains and getting more extended from its prior base. Prior highs and its 50 DMA line define support to watch on pullbacks near the $13 level.
>>> The latest Featured Stock Update with an annotated graph appeared on 9/25/2012. Click here.
View all notes |
Alert me of new notes |
CANSLIM.net Company Profile |
SEC |
Zacks Reports |
StockTalk |
News |
Chart |
Request a new note
C
A N
S L
I M
|
CMCSA
-
NASDAQ
Comcast Corp Cl A
MEDIA - CATV Systems
|
$35.12
|
-0.74
-2.05% |
$35.98
|
13,902,481
108.61% of 50 DAV
50 DAV is 12,800,600
|
$36.90
-4.82%
|
6/11/2012
|
$29.94
|
PP = $30.98
|
|
MB = $32.53
|
Most Recent Note - 9/21/2012 6:04:19 PM
G - Today's 3rd consecutive gain with above average volume for a new 52-week high helped it rise from an orderly flat base. No new pivot point was cited because of fundamental concerns raised by sub par sales and earnings growth in the Jun '12 quarter. See the latest FSU analysis for more details and a new annotated graph.
>>> The latest Featured Stock Update with an annotated graph appeared on 9/21/2012. Click here.
View all notes |
Alert me of new notes |
CANSLIM.net Company Profile |
SEC |
Zacks Reports |
StockTalk |
News |
Chart |
Request a new note
C
A N
S L
I M
|
DVA
-
NYSE
Davita Inc
HEALTH SERVICES - Specialized Health Services
|
$100.96
|
+0.66
0.66% |
$101.77
|
664,711
93.65% of 50 DAV
50 DAV is 709,800
|
$103.97
-2.90%
|
9/5/2012
|
$102.92
|
PP = $100.62
|
|
MB = $105.65
|
Most Recent Note - 9/21/2012 4:09:41 PM
Y - Considerable gain today and new high close above its pivot point was backed by more than 3 times average volume confirming a technical buy signal.
>>> The latest Featured Stock Update with an annotated graph appeared on 9/5/2012. Click here.
View all notes |
Alert me of new notes |
CANSLIM.net Company Profile |
SEC |
Zacks Reports |
StockTalk |
News |
Chart |
Request a new note
C
A N
S L
I M
|
Symbol/Exchange
Company Name
Industry Group |
PRICE |
CHANGE
(%Change) |
Day High |
Volume
(% DAV)
(% 50 day avg vol) |
52 Wk Hi
% From Hi |
Featured
Date |
Price
Featured |
Pivot Featured |
|
Max Buy |
ECPG
-
NASDAQ
Encore Capital Group Inc
FINANCIAL SERVICES - Credit Services
|
$28.29
|
-0.06
-0.21% |
$28.38
|
98,195
75.77% of 50 DAV
50 DAV is 129,600
|
$30.91
-8.48%
|
8/3/2012
|
$29.91
|
PP = $30.45
|
|
MB = $31.97
|
Most Recent Note - 9/24/2012 4:25:31 PM
Y - Slumping back into the prior base and near its 50 DMA line raising concerns. Disciplined investors always limit losses if ever a stock falls more than -7% from their purchase price.
>>> The latest Featured Stock Update with an annotated graph appeared on 9/12/2012. Click here.
View all notes |
Alert me of new notes |
CANSLIM.net Company Profile |
SEC |
Zacks Reports |
StockTalk |
News |
Chart |
Request a new note
C
A N
S L
I M
|
EXPE
-
NASDAQ
Expedia Inc
INTERNET - Internet Information Providers
|
$57.65
|
-0.49
-0.84% |
$58.48
|
1,991,666
59.66% of 50 DAV
50 DAV is 3,338,200
|
$60.29
-4.38%
|
4/27/2012
|
$41.80
|
PP = $35.57
|
|
MB = $37.35
|
Most Recent Note - 9/21/2012 4:04:25 PM
G - Gapped up today and hit a new 52-week high with a volume-driven gain. No overhead supply remains to hinder its progress,however weak industry group action and iffy fundamentals were noted in the latest FSU as causes for concern.
>>> The latest Featured Stock Update with an annotated graph appeared on 9/19/2012. Click here.
View all notes |
Alert me of new notes |
CANSLIM.net Company Profile |
SEC |
Zacks Reports |
StockTalk |
News |
Chart |
Request a new note
C
A N
S L
I M
|
GPX
-
NYSE
G P Strategies Corp
DIVERSIFIED SERVICES - Education and Training Services
|
$19.43
|
+0.41
2.16% |
$19.44
|
34,788
47.72% of 50 DAV
50 DAV is 72,900
|
$20.67
-6.00%
|
6/29/2012
|
$18.01
|
PP = $18.15
|
|
MB = $19.06
|
Most Recent Note - 9/26/2012 1:15:39 PM
G - Consolidating -6.9% off its 52-week high today after 6 consecutive losses, now testing support at its 50 DMA line. More damaging losses would raise concerns and trigger a technical sell signal.
>>> The latest Featured Stock Update with an annotated graph appeared on 9/13/2012. Click here.
View all notes |
Alert me of new notes |
CANSLIM.net Company Profile |
SEC |
Zacks Reports |
StockTalk |
News |
Chart |
Request a new note
C
A N
S L
I M
|
KH
-
NYSE
China Kanghui Hldgs Ads
HEALTH SERVICES - Medical Appliances and Equipment
|
$24.50
|
+0.08
0.33% |
$25.92
|
129,031
417.58% of 50 DAV
50 DAV is 30,900
|
$27.47
-10.81%
|
8/30/2012
|
$24.19
|
PP = $22.90
|
|
MB = $24.05
|
Most Recent Note - 9/26/2012 3:47:41 PM
G - Enduring distributional pressure this week. Consolidating above prior highs defining chart support above its 50 DMA line.
>>> The latest Featured Stock Update with an annotated graph appeared on 8/30/2012. Click here.
View all notes |
Alert me of new notes |
CANSLIM.net Company Profile |
SEC |
Zacks Reports |
StockTalk |
News |
Chart |
Request a new note
C
A N
S L
I M
|
LKQ
-
NASDAQ
L K Q Corp
WHOLESALE - Auto Parts
|
$18.76
|
-0.45
-2.32% |
$19.25
|
1,661,192
121.65% of 50 DAV
50 DAV is 1,365,500
|
$20.02
-6.27%
|
8/9/2012
|
$18.97
|
PP = $18.72
|
|
MB = $19.66
|
Most Recent Note - 9/26/2012 1:08:17 PM
Y - Overcame distributional pressure this week after undercutting its 50 DMA line noted as important chart support to watch on pullbacks.Do not be confused by a 2:1 share split effective 9/19/12 (Featured Price, Pivot Point and Max Buy were adjusted).
>>> The latest Featured Stock Update with an annotated graph appeared on 9/17/2012. Click here.
View all notes |
Alert me of new notes |
CANSLIM.net Company Profile |
SEC |
Zacks Reports |
StockTalk |
News |
Chart |
Request a new note
C
A N
S L
I M
|
Symbol/Exchange
Company Name
Industry Group |
PRICE |
CHANGE
(%Change) |
Day High |
Volume
(% DAV)
(% 50 day avg vol) |
52 Wk Hi
% From Hi |
Featured
Date |
Price
Featured |
Pivot Featured |
|
Max Buy |
LNKD
-
NYSE
Linkedin Corp Class A
INTERNET - Internet Information Providers
|
$118.00
|
-1.89
-1.58% |
$119.50
|
1,854,414
75.25% of 50 DAV
50 DAV is 2,464,300
|
$125.50
-5.98%
|
9/5/2012
|
$113.25
|
PP = $113.10
|
|
MB = $118.76
|
Most Recent Note - 9/21/2012 4:12:00 PM
G - Hovering near its 52-week and all-time highs after today's 4th consecutive small gain on below average volume. Prior highs near $113 define initial support to watch on pullbacks.
>>> The latest Featured Stock Update with an annotated graph appeared on 9/6/2012. Click here.
View all notes |
Alert me of new notes |
CANSLIM.net Company Profile |
SEC |
Zacks Reports |
StockTalk |
News |
Chart |
Request a new note
C
A N
S L
I M
|
MIDD
-
NASDAQ
Middleby Corp
MANUFACTURING - Diversified Machinery
|
$115.29
|
-1.19
-1.02% |
$116.79
|
36,605
35.40% of 50 DAV
50 DAV is 103,400
|
$122.57
-5.94%
|
8/9/2012
|
$118.60
|
PP = $104.92
|
|
MB = $110.17
|
Most Recent Note - 9/26/2012 1:09:42 PM
G - Perched -5.5% off its 52-week high today. Extended from its prior base, and its 50 DMA line and recent lows define near-term chart support to watch.
>>> The latest Featured Stock Update with an annotated graph appeared on 9/18/2012. Click here.
View all notes |
Alert me of new notes |
CANSLIM.net Company Profile |
SEC |
Zacks Reports |
StockTalk |
News |
Chart |
Request a new note
C
A N
S L
I M
|
N
-
NYSE
Netsuite Inc
DIVERSIFIED SERVICES - Business/Management Services
|
$60.94
|
+0.00
0.00% |
$61.91
|
1,255,648
200.04% of 50 DAV
50 DAV is 627,700
|
$63.25
-3.65%
|
8/20/2012
|
$55.88
|
PP = $59.32
|
|
MB = $62.29
|
Most Recent Note - 9/26/2012 3:45:21 PM
Y - Tallying a gain today with above average volume. Prior highs near $59 define initial support above its 50 DMA line.
>>> The latest Featured Stock Update with an annotated graph appeared on 9/24/2012. Click here.
View all notes |
Alert me of new notes |
CANSLIM.net Company Profile |
SEC |
Zacks Reports |
StockTalk |
News |
Chart |
Request a new note
C
A N
S L
I M
|
NSM
-
NYSE
Nationstar Mtg Hldgs Inc
FINANCIAL SERVICES - Credit Services
|
$33.55
|
+0.53
1.61% |
$33.89
|
1,303,196
139.23% of 50 DAV
50 DAV is 936,000
|
$34.90
-3.87%
|
8/29/2012
|
$27.96
|
PP = $28.85
|
|
MB = $30.29
|
Most Recent Note - 9/25/2012 12:12:06 PM
G - Spiking to another new 52-week high today with its 7th consecutive gain, getting extended from its prior base. Disciplined investors avoid chasing stocks more than +5% above their pivot point.
>>> The latest Featured Stock Update with an annotated graph appeared on 9/7/2012. Click here.
View all notes |
Alert me of new notes |
CANSLIM.net Company Profile |
SEC |
Zacks Reports |
StockTalk |
News |
Chart |
Request a new note
C
A N
S L
I M
|
OSIS
-
NASDAQ
O S I Systems Inc
ELECTRONICS - Semiconductor Equipment and Mate
|
$75.14
|
-0.57
-0.75% |
$76.24
|
90,059
73.40% of 50 DAV
50 DAV is 122,700
|
$78.58
-4.38%
|
9/5/2012
|
$74.39
|
PP = $75.10
|
|
MB = $78.86
|
Most Recent Note - 9/24/2012 4:27:10 PM
Y - Loss today with above average volume broke a streak of 5 consecutive gains. Prior rally above its pivot point clinched a new (or add-on) technical buy signal, yet it has not risen beyond its "max buy" level. Near term support is at its 50 DMA line.
>>> The latest Featured Stock Update with an annotated graph appeared on 9/14/2012. Click here.
View all notes |
Alert me of new notes |
CANSLIM.net Company Profile |
SEC |
Zacks Reports |
StockTalk |
News |
Chart |
Request a new note
C
A N
S L
I M
|
Symbol/Exchange
Company Name
Industry Group |
PRICE |
CHANGE
(%Change) |
Day High |
Volume
(% DAV)
(% 50 day avg vol) |
52 Wk Hi
% From Hi |
Featured
Date |
Price
Featured |
Pivot Featured |
|
Max Buy |
RNF
-
NYSE
Rentech Nitrogen Ptnr Lp
CHEMICALS - Agricultural Chemicals
|
$37.08
|
-2.21
-5.62% |
$39.49
|
993,433
231.14% of 50 DAV
50 DAV is 429,800
|
$40.05
-7.42%
|
7/27/2012
|
$29.58
|
PP = $30.60
|
|
MB = $32.13
|
Most Recent Note - 9/26/2012 12:17:41 PM
G - Retreating from its 52-week high with above average volume behind today's loss. It is extended from its prior base. An upward trendline defines near-term chart support that comes into play above its 50 DMA line.
>>> The latest Featured Stock Update with an annotated graph appeared on 8/31/2012. Click here.
View all notes |
Alert me of new notes |
CANSLIM.net Company Profile |
SEC |
Zacks Reports |
StockTalk |
News |
Chart |
Request a new note
C
A N
S L
I M
|
SWI
-
NYSE
Solarwinds Inc
COMPUTER SOFTWARE and SERVICES - Application Software
|
$54.49
|
-3.44
-5.94% |
$57.75
|
1,789,043
166.18% of 50 DAV
50 DAV is 1,076,600
|
$60.95
-10.60%
|
7/25/2012
|
$47.82
|
PP = $47.89
|
|
MB = $50.28
|
Most Recent Note - 9/26/2012 11:48:16 AM
G - Violated its 50 DMA line with a damaging loss today with higher volume raising concerns. Only a prompt rebound above that important short-term average would help its outlook.
>>> The latest Featured Stock Update with an annotated graph appeared on 8/29/2012. Click here.
View all notes |
Alert me of new notes |
CANSLIM.net Company Profile |
SEC |
Zacks Reports |
StockTalk |
News |
Chart |
Request a new note
C
A N
S L
I M
|
TDG
-
NYSE
Transdigm Group Inc
AEROSPACE/DEFENSE - Aerospace/Defense Products and; Services
|
$141.04
|
-3.91
-2.70% |
$145.58
|
888,596
231.47% of 50 DAV
50 DAV is 383,900
|
$146.72
-3.87%
|
8/16/2012
|
$132.23
|
PP = $136.44
|
|
MB = $143.26
|
Most Recent Note - 9/26/2012 12:26:53 PM
Y - Pulling back today and its color code is changed to yellow after retreating below its "max buy" level. Its 50 DMA line defines support to watch on pullbacks.
>>> The latest Featured Stock Update with an annotated graph appeared on 9/20/2012. Click here.
View all notes |
Alert me of new notes |
CANSLIM.net Company Profile |
SEC |
Zacks Reports |
StockTalk |
News |
Chart |
Request a new note
C
A N
S L
I M
|
ULTA
-
NASDAQ
Ulta Salon Cosm & Frag
SPECIALTY RETAIL - Specialty Retail, Other
|
$96.48
|
-0.61
-0.63% |
$97.38
|
512,055
63.77% of 50 DAV
50 DAV is 803,000
|
$103.52
-6.80%
|
9/4/2012
|
$93.17
|
PP = $98.52
|
|
MB = $103.45
|
Most Recent Note - 9/26/2012 1:11:16 PM
Y - Slumping further below its pivot point with a loss on light volume today, raising concerns. Disciplined investors always limit losses if ever any stock falls -7% or more from their purchase price.
>>> The latest Featured Stock Update with an annotated graph appeared on 9/4/2012. Click here.
View all notes |
Alert me of new notes |
CANSLIM.net Company Profile |
SEC |
Zacks Reports |
StockTalk |
News |
Chart |
Request a new note
C
A N
S L
I M
|
ULTI
-
NASDAQ
Ultimate Software Group
INTERNET - Internet Software and Services
|
$97.76
|
-0.39
-0.39% |
$99.20
|
121,857
76.16% of 50 DAV
50 DAV is 160,000
|
$106.40
-8.12%
|
8/27/2012
|
$98.36
|
PP = $99.19
|
|
MB = $104.15
|
Most Recent Note - 9/21/2012 4:19:29 PM
Y - Today marked is 4th consecutive small loss while consolidating near its all-time high. Prior chart highs define initial support to watch above its 50 DMA line.
>>> The latest Featured Stock Update with an annotated graph appeared on 8/27/2012. Click here.
View all notes |
Alert me of new notes |
CANSLIM.net Company Profile |
SEC |
Zacks Reports |
StockTalk |
News |
Chart |
Request a new note
C
A N
S L
I M
|
Symbol/Exchange
Company Name
Industry Group |
PRICE |
CHANGE
(%Change) |
Day High |
Volume
(% DAV)
(% 50 day avg vol) |
52 Wk Hi
% From Hi |
Featured
Date |
Price
Featured |
Pivot Featured |
|
Max Buy |
VSI
-
NYSE
Vitamin Shoppe Inc
SPECIALTY RETAIL - Specialty Retail, Other
|
$56.31
|
-0.77
-1.35% |
$57.14
|
226,858
61.98% of 50 DAV
50 DAV is 366,000
|
$61.83
-8.92%
|
6/29/2012
|
$54.93
|
PP = $55.03
|
|
MB = $57.78
|
Most Recent Note - 9/21/2012 4:21:01 PM
G - Today marked its 4th consecutive small gain. It has not formed a sound new base. Prior lows near $52 define important chart support below its 50 DMA line.
>>> The latest Featured Stock Update with an annotated graph appeared on 9/10/2012. Click here.
View all notes |
Alert me of new notes |
CANSLIM.net Company Profile |
SEC |
Zacks Reports |
StockTalk |
News |
Chart |
Request a new note
C
A N
S L
I M
|
WPI
-
NYSE
Watson Pharmaceuticals
DRUGS - Drugs - Generic
|
$82.83
|
-0.33
-0.40% |
$83.73
|
480,148
43.40% of 50 DAV
50 DAV is 1,106,300
|
$84.59
-2.08%
|
8/24/2012
|
$82.90
|
PP = $81.10
|
|
MB = $85.16
|
Most Recent Note - 9/26/2012 1:12:50 PM
Y - Still holding its ground today in a tight range near its 52-week high. Prior highs in the $81 area and its 50 DMA line define important support to watch on pullbacks.
>>> The latest Featured Stock Update with an annotated graph appeared on 8/28/2012. Click here.
View all notes |
Alert me of new notes |
CANSLIM.net Company Profile |
SEC |
Zacks Reports |
StockTalk |
News |
Chart |
Request a new note
C
A N
S L
I M
|