***Last / Change / Volume data in this table is the closing quote data***
Symbol/Exchange
Company Name
Industry Group |
PRICE |
CHANGE
(%Change) |
Day High |
Volume
(% DAV)
(% 50 day avg vol) |
52 Wk Hi
% From Hi |
Featured
Date |
Price
Featured |
Pivot Featured |
|
Max Buy |
ABV
-
NYSE
Comp De Bebidas Adr
FOOD and BEVERAGE - Beverages - Brewers
|
$119.84
|
-0.67
-0.56% |
$122.50
|
628,689
103.25% of 50 DAV
50 DAV is 608,900
|
$122.49
-2.16%
|
6/29/2010
|
$104.74
|
PP = $109.33
|
|
MB = $114.80
|
 Most Recent Note - 9/24/2010 4:12:57 PM
G - This Brazil-based beverage firm is hovering at its all-time high, stubbornly holding its ground after recent gains. Extended from a sound base, its prior highs in the $111-112 area define support above its 50 DMA line.
>>> The latest Featured Stock Update with an annotated graph appeared on 8/18/2010. Click here.
View all notes |
Alert me of new notes |
CANSLIM.net Company Profile |
SEC |
Zacks Reports |
StockTalk |
News |
Chart |
Request a new note
C
A N
S L
I M


|
ARUN
-
NASDAQ
Aruba Networks Inc
COMPUTER HARDWARE - Networking andamp; Communication Dev
|
$22.13
|
+1.06
5.03% |
$22.14
|
2,186,549
108.99% of 50 DAV
50 DAV is 2,006,200
|
$22.18
-0.23%
|
8/30/2010
|
$18.12
|
PP = $18.51
|
|
MB = $19.44
|
Most Recent Note - 9/24/2010 11:42:33 AM
G - Following a positive reversal on the prior session it gapped up today. Extended from its latest base. Prior highs near $18 define a chart support level to watch.
>>> The latest Featured Stock Update with an annotated graph appeared on 9/2/2010. Click here.
View all notes |
Alert me of new notes |
CANSLIM.net Company Profile |
SEC |
Zacks Reports |
StockTalk |
News |
Chart |
Request a new note
C
A N
S L
I M
|
ASPS
-
NASDAQ
Altisource Ptf Sltns Sa
REAL ESTATE - Property Management/Developmen
|
$29.90
|
+0.47
1.60% |
$30.20
|
162,752
147.42% of 50 DAV
50 DAV is 110,400
|
$29.49
1.39%
|
9/23/2010
|
$28.36
|
PP = $28.90
|
|
MB = $30.35
|
Most Recent Note - 9/24/2010 12:07:58 PM
Y - Up again today, it triggered a technical buy signal on 9/23/10 with a considerable gain on nearly 4 times average volume. No overhead supply remains as this Luxembourg-based Financial Services firm spiked to a new 52-week high after it was featured in yellow in the mid-day report (read here) while building on an orderly 9-week flat base above its 50 DMA line. Its Sep '09 quarter and FY '09 earnings results have blue triangles beside the earnings figure on the graph service used by our experts indicating that pre-tax, non-recurring items were included (where possible, such items are normally removed to provide data better suited for comparison). The number of top-rated funds owning its shares fell from 47 in Sep '09 to 35 in Jun '10. It did not make significant progress since noted in February 2010 mid-day reports -"Annual earnings (A criteria) history has been up and down and needs additional review."
>>> The latest Featured Stock Update with an annotated graph appeared on 9/23/2010. Click here.
View all notes |
Alert me of new notes |
CANSLIM.net Company Profile |
SEC |
Zacks Reports |
StockTalk |
News |
Chart |
Request a new note
C
A N
S L
I M
|
BIDU
-
NASDAQ
Baidu Inc Ads
INTERNET - Internet Information Providers
|
$97.83
|
+2.80
2.95% |
$98.13
|
14,007,097
148.60% of 50 DAV
50 DAV is 9,426,300
|
$95.17
2.79%
|
9/17/2010
|
$85.73
|
PP = $88.42
|
|
MB = $92.84
|
Most Recent Note - 9/24/2010 12:14:26 PM
G - Up again today with its 5th consecutive gain. Color code was changed to green as it gets extended from prior highs by more than +5%. Prior highs in the $88 area define support now.
>>> The latest Featured Stock Update with an annotated graph appeared on 8/13/2010. Click here.
View all notes |
Alert me of new notes |
CANSLIM.net Company Profile |
SEC |
Zacks Reports |
StockTalk |
News |
Chart |
Request a new note
C
A N
S L
I M
|
CACC
-
NASDAQ
Credit Acceptance Corp
FINANCIAL SERVICES - Credit Services
|
$61.98
|
+1.62
2.68% |
$62.00
|
23,522
50.58% of 50 DAV
50 DAV is 46,500
|
$63.45
-2.32%
|
7/29/2010
|
$52.04
|
PP = $54.07
|
|
MB = $56.77
|
Most Recent Note - 9/24/2010 4:17:22 PM
G - Gain on light volume today, finishing near the session high and above an important prior high ($61.41). Noted previously, an upward trendline defines support above its 50 DMA line and its recent chart low ($56.06).
>>> The latest Featured Stock Update with an annotated graph appeared on 8/2/2010. Click here.
View all notes |
Alert me of new notes |
CANSLIM.net Company Profile |
SEC |
Zacks Reports |
StockTalk |
News |
Chart |
Request a new note
C
A N
S L
I M
|
Symbol/Exchange
Company Name
Industry Group |
PRICE |
CHANGE
(%Change) |
Day High |
Volume
(% DAV)
(% 50 day avg vol) |
52 Wk Hi
% From Hi |
Featured
Date |
Price
Featured |
Pivot Featured |
|
Max Buy |
CMG
-
NYSE
Chipotle Mexican Grill
LEISURE - Restaurants
|
$173.19
|
+6.53
3.92% |
$173.19
|
871,211
122.86% of 50 DAV
50 DAV is 709,100
|
$171.46
1.01%
|
9/1/2010
|
$158.31
|
PP = $155.52
|
|
MB = $163.30
|
Most Recent Note - 9/24/2010 4:00:31 PM
G - Gapped up today for a solid gain with above average volume, reaching a new all-time high. Extended from prior highs in the $155 area that define chart support.
>>> The latest Featured Stock Update with an annotated graph appeared on 9/1/2010. Click here.
View all notes |
Alert me of new notes |
CANSLIM.net Company Profile |
SEC |
Zacks Reports |
StockTalk |
News |
Chart |
Request a new note
C
A N
S L
I M
|
CRM
-
NYSE
Salesforce.Com Inc
INTERNET - Internet Software and Services
|
$119.34
|
+1.85
1.57% |
$121.05
|
2,506,812
93.80% of 50 DAV
50 DAV is 2,672,500
|
$123.77
-3.58%
|
6/2/2010
|
$88.44
|
PP = $89.60
|
|
MB = $94.08
|
Most Recent Note - 9/22/2010 2:51:31 PM
G - Pulling back on lighter volume after its 9/20/10 gain with +54% above average volume helped it rally from an advanced "3-weeks tight" type pattern to a new all-time high.
>>> The latest Featured Stock Update with an annotated graph appeared on 8/16/2010. Click here.
View all notes |
Alert me of new notes |
CANSLIM.net Company Profile |
SEC |
Zacks Reports |
StockTalk |
News |
Chart |
Request a new note
C
A N
S L
I M
|
CTRP
-
NASDAQ
Ctrip.Com Intl Ltd Adr
LEISURE - Resorts and Casinos
|
$46.92
|
+2.08
4.64% |
$47.29
|
2,166,694
123.46% of 50 DAV
50 DAV is 1,755,000
|
$47.01
-0.19%
|
9/24/2010
|
$46.75
|
PP = $47.11
|
|
MB = $49.47
|
Most Recent Note - 9/24/2010 12:32:40 PM
Y - Hit a new 52-week high today with its 6th consecutive gain. Color code is changed to yellow with its pivot point based on is 52-week high plus ten cents. No overhead supply remains to act as resistance, but it has not triggered a sound technical buy signal. The action has been choppy since it was dropped from the Featured Stocks list on 5/06/10. Quarterly and annual earnings history has been strong (good C and A criteria). Since last noted in 6/22/10 mid-day report leadership (L criteria) has improved in the stock's Industry Group (Leisure - Travel Booking).
>>> The latest Featured Stock Update with an annotated graph appeared on 4/12/2010. Click here.
View all notes |
Alert me of new notes |
CANSLIM.net Company Profile |
SEC |
Zacks Reports |
StockTalk |
News |
Chart |
Request a new note
C
A N
S L
I M
|
EBIX
-
NASDAQ
Ebix Inc
COMPUTER SOFTWARE and SERVICES - Business Software and Services
|
$23.00
|
+1.36
6.28% |
$23.00
|
1,124,411
256.42% of 50 DAV
50 DAV is 438,500
|
$22.62
1.68%
|
9/23/2010
|
$21.78
|
PP = $22.74
|
|
MB = $23.88
|
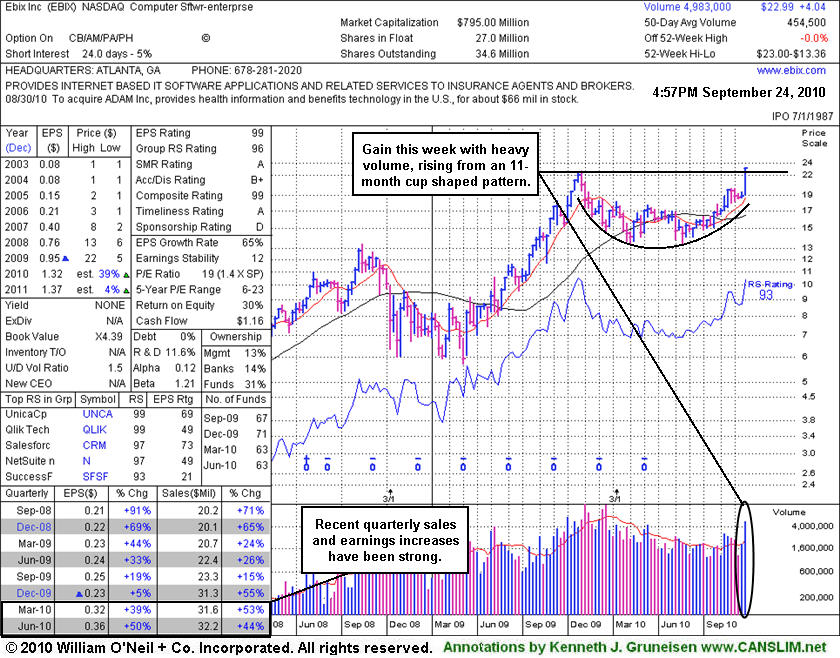
Most Recent Note - 9/24/2010 5:37:05 PM
Y - Gapped up today and rallied above its pivot point with heavy volume, triggering a technical buy signal. It was featured in yellow in the 9/23/10 mid-day report (read here) and noted - "It may encounter resistance near its old high and form a handle after its recent rally. It has formed a large cup shaped pattern in the past year, maintaining strong fundamentals since it was dropped from the Featured Stocks list on 11/05/09."
>>> The latest Featured Stock Update with an annotated graph appeared on 9/24/2010. Click here.
View all notes |
Alert me of new notes |
CANSLIM.net Company Profile |
SEC |
Zacks Reports |
StockTalk |
News |
Chart |
Request a new note
C
A N
S L
I M
|
EGO
-
NYSE
Eldorado Gold Corp
METALS and MINING - Gold
|
$18.25
|
-0.45
-2.41% |
$18.99
|
6,439,725
149.89% of 50 DAV
50 DAV is 4,296,200
|
$20.23
-9.79%
|
8/19/2010
|
$18.25
|
PP = $19.17
|
|
MB = $20.13
|
Most Recent Note - 9/24/2010 3:51:27 PM
Y - Pulling back again today with above average volume, slumping near its old high closes and its 50 DMA line. More damaging losses would raise concerns and trigger technical sell signals.
>>> The latest Featured Stock Update with an annotated graph appeared on 8/19/2010. Click here.
View all notes |
Alert me of new notes |
CANSLIM.net Company Profile |
SEC |
Zacks Reports |
StockTalk |
News |
Chart |
Request a new note
C
A N
S L
I M
|
Symbol/Exchange
Company Name
Industry Group |
PRICE |
CHANGE
(%Change) |
Day High |
Volume
(% DAV)
(% 50 day avg vol) |
52 Wk Hi
% From Hi |
Featured
Date |
Price
Featured |
Pivot Featured |
|
Max Buy |
FFIV
-
NASDAQ
F 5 Networks Inc
INTERNET - Internet Software and Services
|
$103.07
|
+0.58
0.57% |
$105.72
|
1,473,388
87.98% of 50 DAV
50 DAV is 1,674,700
|
$105.20
-2.02%
|
6/16/2010
|
$74.50
|
PP = $74.10
|
|
MB = $77.81
|
Most Recent Note - 9/22/2010 2:34:51 PM
G - Pulling back on lighter volume after starting the week with a gain for a new all-time high with volume slightly above average. A steep upward trendline connecting July-August lows defines an initial chart support level well above its 50 DMA line.
>>> The latest Featured Stock Update with an annotated graph appeared on 9/13/2010. Click here.
View all notes |
Alert me of new notes |
CANSLIM.net Company Profile |
SEC |
Zacks Reports |
StockTalk |
News |
Chart |
Request a new note
C
A N
S L
I M
|
FOSL
-
NASDAQ
Fossil Inc
CONSUMER DURABLES - Recreational Goods, Other
|
$53.03
|
+1.79
3.49% |
$53.05
|
509,268
66.48% of 50 DAV
50 DAV is 766,100
|
$52.64
0.74%
|
8/10/2010
|
$45.54
|
PP = $42.69
|
|
MB = $44.82
|
Most Recent Note - 9/24/2010 4:01:48 PM
G - Gapped up today and posted a gain with below average volume for another new all-time high. Extended from any sound base after a recent streak of gains, its prior high in the $46 area defines support to watch.
>>> The latest Featured Stock Update with an annotated graph appeared on 8/11/2010. Click here.
View all notes |
Alert me of new notes |
CANSLIM.net Company Profile |
SEC |
Zacks Reports |
StockTalk |
News |
Chart |
Request a new note
C
A N
S L
I M
|
GMCR
-
NASDAQ
Green Mtn Coffee Roastrs
FOOD and BEVERAGE - Processed and Packaged Goods
|
$36.22
|
+0.44
1.23% |
$36.78
|
1,606,451
63.81% of 50 DAV
50 DAV is 2,517,500
|
$37.32
-2.95%
|
8/17/2010
|
$33.62
|
PP = $33.30
|
|
MB = $34.97
|
Most Recent Note - 9/22/2010 2:37:55 PM
G - Loss today with lighter volume erased the prior session's big volume-driven gain. Prior highs in the $33 area define support to watch.
>>> The latest Featured Stock Update with an annotated graph appeared on 8/17/2010. Click here.
View all notes |
Alert me of new notes |
CANSLIM.net Company Profile |
SEC |
Zacks Reports |
StockTalk |
News |
Chart |
Request a new note
C
A N
S L
I M
|
HS
-
NYSE
Healthspring Inc
HEALTH SERVICES - Health Care Plans
|
$25.64
|
+0.73
2.93% |
$26.28
|
1,152,746
169.57% of 50 DAV
50 DAV is 679,800
|
$25.33
1.22%
|
8/27/2010
|
$19.91
|
PP = $19.75
|
|
MB = $20.74
|
Most Recent Note - 9/24/2010 12:40:41 PM
G - Hit a new 52-week high and all-time high with today's 6th consecutive gain. Support to watch is prior chart highs in the $19-20 area. Disciplined investors do not chase stocks that are extended from a sound base.
>>> The latest Featured Stock Update with an annotated graph appeared on 8/27/2010. Click here.
View all notes |
Alert me of new notes |
CANSLIM.net Company Profile |
SEC |
Zacks Reports |
StockTalk |
News |
Chart |
Request a new note
C
A N
S L
I M
|
IGTE
-
NASDAQ
Igate Corp
COMPUTER SOFTWARE and SERVICES - Information Technology Service
|
$18.57
|
+0.94
5.33% |
$18.69
|
481,121
108.80% of 50 DAV
50 DAV is 442,200
|
$19.45
-4.52%
|
9/8/2010
|
$17.29
|
PP = $18.26
|
|
MB = $19.17
|
Most Recent Note - 9/24/2010 12:04:08 PM
Y - Gapped up today following the latest sign of more distributional pressure, but concerns are raised by its lack of meaningful price progress above prior highs in the past 2 weeks while volume totals have been above average .
>>> The latest Featured Stock Update with an annotated graph appeared on 9/10/2010. Click here.
View all notes |
Alert me of new notes |
CANSLIM.net Company Profile |
SEC |
Zacks Reports |
StockTalk |
News |
Chart |
Request a new note
C
A N
S L
I M
|
Symbol/Exchange
Company Name
Industry Group |
PRICE |
CHANGE
(%Change) |
Day High |
Volume
(% DAV)
(% 50 day avg vol) |
52 Wk Hi
% From Hi |
Featured
Date |
Price
Featured |
Pivot Featured |
|
Max Buy |
JOBS
-
NASDAQ
Fifty One Job Inc Ads
DIVERSIFIED SERVICES - Staffing and; Outsourcing Service
|
$38.32
|
+0.84
2.24% |
$39.19
|
186,081
145.83% of 50 DAV
50 DAV is 127,600
|
$38.40
-0.21%
|
9/16/2010
|
$31.59
|
PP = $30.40
|
|
MB = $31.92
|
Most Recent Note - 9/24/2010 12:41:59 PM
G - Hit another new 52-week high today. Very extended from a sound base, its prior highs in the $30 area define chart support now.
>>> The latest Featured Stock Update with an annotated graph appeared on 9/16/2010. Click here.
View all notes |
Alert me of new notes |
CANSLIM.net Company Profile |
SEC |
Zacks Reports |
StockTalk |
News |
Chart |
Request a new note
C
A N
S L
I M
|
MELI
-
NASDAQ
Mercadolibre Inc
INTERNET - Internet Software and; Services
|
$71.90
|
+0.97
1.37% |
$73.00
|
464,194
55.88% of 50 DAV
50 DAV is 830,700
|
$74.78
-3.85%
|
5/13/2010
|
$54.21
|
PP = $55.85
|
|
MB = $58.64
|
Most Recent Note - 9/24/2010 4:20:13 PM
G - Quietly consolidating this week, it is still extended from a sound base. Its 50 DMA line defines important chart support.
>>> The latest Featured Stock Update with an annotated graph appeared on 8/26/2010. Click here.
View all notes |
Alert me of new notes |
CANSLIM.net Company Profile |
SEC |
Zacks Reports |
StockTalk |
News |
Chart |
Request a new note
C
A N
S L
I M
|
MRX
-
NYSE
Medicis Pharmaceut Cl A
DRUGS - Biotechnology
|
$30.06
|
+0.59
2.00% |
$30.06
|
984,660
80.70% of 50 DAV
50 DAV is 1,220,200
|
$30.29
-0.76%
|
8/12/2010
|
$26.88
|
PP = $26.71
|
|
MB = $28.05
|
Most Recent Note - 9/24/2010 4:21:45 PM
G - Hovering near its 2010 high with volume totals cooling the past few sessions. Prior highs in the $28 area define the initial chart support level to watch.
>>> The latest Featured Stock Update with an annotated graph appeared on 8/12/2010. Click here.
View all notes |
Alert me of new notes |
CANSLIM.net Company Profile |
SEC |
Zacks Reports |
StockTalk |
News |
Chart |
Request a new note
C
A N
S L
I M
|
MWIV
-
NASDAQ
M W I Veterinary Supply
HEALTH SERVICES - Medical Instruments and; Supplies
|
$57.37
|
+1.77
3.18% |
$57.74
|
39,971
53.22% of 50 DAV
50 DAV is 75,100
|
$57.99
-1.07%
|
7/29/2010
|
$52.05
|
PP = $52.09
|
|
MB = $54.69
|
Most Recent Note - 9/24/2010 4:10:12 PM
G - Gain today on light volume, and no overhead supply remains to act as resistance. Its 50 DMA line defines important chart support.
>>> The latest Featured Stock Update with an annotated graph appeared on 9/7/2010. Click here.
View all notes |
Alert me of new notes |
CANSLIM.net Company Profile |
SEC |
Zacks Reports |
StockTalk |
News |
Chart |
Request a new note
C
A N
S L
I M
|
NEM
-
NYSE
Newmont Mining Corp
METALS and MINING - Gold
|
$63.40
|
-0.45
-0.70% |
$64.87
|
5,446,662
86.20% of 50 DAV
50 DAV is 6,318,700
|
$65.50
-3.21%
|
8/31/2010
|
$61.32
|
PP = $63.48
|
|
MB = $66.65
|
Most Recent Note - 9/22/2010 1:18:26 PM
Y - Gapped up and hit a new all-time high today. A positive reversal and strong close on the prior session helped it rally above its pivot point for a gain with +48% above average volume. Technically the breakout was near the minimum volume guideline for a proper buy signal. No overhead supply remains to hinder its progress. Leadership in the Mining - Gold/Silver/Gems group (L criteria) is a nice reassurance.
>>> The latest Featured Stock Update with an annotated graph appeared on 9/14/2010. Click here.
View all notes |
Alert me of new notes |
CANSLIM.net Company Profile |
SEC |
Zacks Reports |
StockTalk |
News |
Chart |
Request a new note
C
A N
S L
I M
|
Symbol/Exchange
Company Name
Industry Group |
PRICE |
CHANGE
(%Change) |
Day High |
Volume
(% DAV)
(% 50 day avg vol) |
52 Wk Hi
% From Hi |
Featured
Date |
Price
Featured |
Pivot Featured |
|
Max Buy |
NEOG
-
NASDAQ
Neogen Corp
DRUGS - Diagnostic Substances
|
$33.27
|
+1.02
3.16% |
$33.47
|
114,893
114.55% of 50 DAV
50 DAV is 100,300
|
$33.66
-1.16%
|
9/1/2010
|
$30.79
|
PP = $30.49
|
|
MB = $32.01
|
Most Recent Note - 9/24/2010 4:07:24 PM
G- Posted a solid gain today with average volume for its best close ever. Prior highs in the $30 area define initial support to watch.
>>> The latest Featured Stock Update with an annotated graph appeared on 8/20/2010. Click here.
View all notes |
Alert me of new notes |
CANSLIM.net Company Profile |
SEC |
Zacks Reports |
StockTalk |
News |
Chart |
Request a new note
C
A N
S L
I M
|
NFLX
-
NASDAQ
Netflix Inc
SPECIALTY RETAIL - Music and Video Stores
|
$162.21
|
+1.74
1.08% |
$167.12
|
9,330,903
190.86% of 50 DAV
50 DAV is 4,888,800
|
$163.72
-0.92%
|
8/10/2010
|
$124.05
|
PP = $124.00
|
|
MB = $130.20
|
Most Recent Note - 9/24/2010 12:51:50 PM
G - Gapped up again today, hitting new all-time highs, getting more extended from a sound base. Prior highs define important support to watch along with an upward trendline that comes into play well above its 50 DMA line.
>>> The latest Featured Stock Update with an annotated graph appeared on 8/10/2010. Click here.
View all notes |
Alert me of new notes |
CANSLIM.net Company Profile |
SEC |
Zacks Reports |
StockTalk |
News |
Chart |
Request a new note
C
A N
S L
I M
|
NTAP
-
NASDAQ
Netapp Inc
COMPUTER HARDWARE - Data Storage Devices
|
$50.39
|
+2.10
4.35% |
$50.89
|
9,249,638
118.32% of 50 DAV
50 DAV is 7,817,300
|
$49.87
1.04%
|
9/8/2010
|
$46.98
|
PP = $44.99
|
|
MB = $47.24
|
Most Recent Note - 9/24/2010 3:53:09 PM
G - Gapped up today, getting more extended from a sound base. Support to watch is at prior chart highs near its latest pivot point.
>>> The latest Featured Stock Update with an annotated graph appeared on 9/8/2010. Click here.
View all notes |
Alert me of new notes |
CANSLIM.net Company Profile |
SEC |
Zacks Reports |
StockTalk |
News |
Chart |
Request a new note
C
A N
S L
I M
|
ORCL
-
NASDAQ
Oracle Corp
COMPUTER SOFTWARE and SERVICES - Application Software
|
$26.96
|
-0.16
-0.59% |
$27.50
|
58,135,107
168.94% of 50 DAV
50 DAV is 34,412,000
|
$27.57
-2.21%
|
9/20/2010
|
$27.32
|
PP = $26.73
|
|
MB = $28.07
|
Most Recent Note - 9/22/2010 1:26:11 PM
Y - Rising today after slumping near its pivot point. A "breakaway gap" on 9/17/10 was backed by 5 times average volume, and it was featured in yellow in the 9/20/10 mid-day report.. It has maintained a strong annual earnings (A criteria) history and sales revenues and earnings increases have shown impressive acceleration in its recent quarterly comparisons. Large supply of 5.03 billion shares outstanding makes it an unlikely sprinter.
>>> The latest Featured Stock Update with an annotated graph appeared on 9/20/2010. Click here.
View all notes |
Alert me of new notes |
CANSLIM.net Company Profile |
SEC |
Zacks Reports |
StockTalk |
News |
Chart |
Request a new note
C
A N
S L
I M
|
PAY
-
NYSE
Verifone Systems Inc
COMPUTER HARDWARE - Transaction Automation Systems
|
$28.74
|
+1.01
3.64% |
$28.80
|
1,622,859
121.78% of 50 DAV
50 DAV is 1,332,600
|
$29.54
-2.72%
|
8/25/2010
|
$24.30
|
PP = $23.74
|
|
MB = $24.93
|
Most Recent Note - 9/24/2010 4:03:18 PM
G - Gapped up today for a solid gain with average volume. Extended from a sound base, its prior highs in the $23 area define chart support.
>>> The latest Featured Stock Update with an annotated graph appeared on 8/30/2010. Click here.
View all notes |
Alert me of new notes |
CANSLIM.net Company Profile |
SEC |
Zacks Reports |
StockTalk |
News |
Chart |
Request a new note
C
A N
S L
I M
|
Symbol/Exchange
Company Name
Industry Group |
PRICE |
CHANGE
(%Change) |
Day High |
Volume
(% DAV)
(% 50 day avg vol) |
52 Wk Hi
% From Hi |
Featured
Date |
Price
Featured |
Pivot Featured |
|
Max Buy |
PRGO
-
NASDAQ
Perrigo Co
DRUGS - Drug Related Products
|
$66.64
|
+2.41
3.75% |
$67.49
|
1,584,163
150.37% of 50 DAV
50 DAV is 1,053,500
|
$64.90
2.68%
|
9/15/2010
|
$63.73
|
PP = $64.76
|
|
MB = $68.00
|
Most Recent Note - 9/24/2010 12:54:17 PM
Y - Gapped up today and hit a new 52-week high, and the volume is near its average daily volume total at mid-day, running at an above average pace. To trigger a proper technical buy signal volume should be at least +50% above average with a gain above its pivot point.
>>> The latest Featured Stock Update with an annotated graph appeared on 9/15/2010. Click here.
View all notes |
Alert me of new notes |
CANSLIM.net Company Profile |
SEC |
Zacks Reports |
StockTalk |
News |
Chart |
Request a new note
C
A N
S L
I M
|
RAX
-
NYSE
Rackspace Hosting Inc
INTERNET - Internet Software and; Services
|
$24.46
|
+1.33
5.75% |
$24.63
|
2,490,705
137.24% of 50 DAV
50 DAV is 1,814,800
|
$23.86
2.51%
|
9/21/2010
|
$22.84
|
PP = $23.61
|
|
MB = $24.79
|
Most Recent Note - 9/24/2010 11:53:11 AM
Y - Gapped up today and hit a new 52-week high, with no overhead supply remaining to hinder its progress. This high-ranked Internet-Networking Solutions firm has earned very high ranks, and 3 of the past 4 quarterly earnings comparisons showed better than +25% increases. Its annual earnings history (A criteria) since trading began in 2008 has been good.
>>> The latest Featured Stock Update with an annotated graph appeared on 9/21/2010. Click here.
View all notes |
Alert me of new notes |
CANSLIM.net Company Profile |
SEC |
Zacks Reports |
StockTalk |
News |
Chart |
Request a new note
C
A N
S L
I M
|
ROVI
-
NASDAQ
Rovi Corp
COMPUTER SOFTWARE andamp; SERVICES - Security Software andamp; Services
|
$48.81
|
+1.59
3.37% |
$48.86
|
1,396,282
108.63% of 50 DAV
50 DAV is 1,285,300
|
$48.72
0.18%
|
8/31/2010
|
$43.31
|
PP = $45.06
|
|
MB = $47.31
|
Most Recent Note - 9/24/2010 4:05:35 PM
G - Gapped up today for a solid gain on average volume. Extended from its latest base, prior highs in the $45 area define support to watch now.
>>> The latest Featured Stock Update with an annotated graph appeared on 8/24/2010. Click here.
View all notes |
Alert me of new notes |
CANSLIM.net Company Profile |
SEC |
Zacks Reports |
StockTalk |
News |
Chart |
Request a new note
C
A N
S L
I M
|
SHOO
-
NASDAQ
Steven Madden Limited
CONSUMER NON-DURABLES - Textile - Apparel Footwear
|
$39.57
|
+1.55
4.08% |
$39.57
|
224,270
51.09% of 50 DAV
50 DAV is 439,000
|
$40.98
-3.44%
|
9/15/2010
|
$38.94
|
PP = $40.27
|
|
MB = $42.28
|
Most Recent Note - 9/24/2010 3:56:19 PM
Y - Gapped up today for a gain, yet volume is light for the session as it is heading for a close near its August highs and about -4% from its 52-week high.
>>> The latest Featured Stock Update with an annotated graph appeared on 8/5/2010. Click here.
View all notes |
Alert me of new notes |
CANSLIM.net Company Profile |
SEC |
Zacks Reports |
StockTalk |
News |
Chart |
Request a new note
C
A N
S L
I M
|
SLW
-
NYSE
Silver Wheaton Corp
METALS and; MINING - Silver
|
$26.60
|
+0.40
1.53% |
$27.04
|
10,157,855
207.83% of 50 DAV
50 DAV is 4,887,500
|
$26.57
0.11%
|
8/25/2010
|
$21.40
|
PP = $21.99
|
|
MB = $23.09
|
Most Recent Note - 9/24/2010 12:55:21 PM
G - Today's 5th consecutive gain for another new all-time high has it more extended from a sound base. Prior highs in the $21 area define chart support to watch.
>>> The latest Featured Stock Update with an annotated graph appeared on 8/25/2010. Click here.
View all notes |
Alert me of new notes |
CANSLIM.net Company Profile |
SEC |
Zacks Reports |
StockTalk |
News |
Chart |
Request a new note
C
A N
S L
I M
|
Symbol/Exchange
Company Name
Industry Group |
PRICE |
CHANGE
(%Change) |
Day High |
Volume
(% DAV)
(% 50 day avg vol) |
52 Wk Hi
% From Hi |
Featured
Date |
Price
Featured |
Pivot Featured |
|
Max Buy |
SVR
-
NYSE
Syniverse Holdings Inc
TELECOMMUNICATIONS - Diversified Communication Serv
|
$24.15
|
+1.12
4.86% |
$24.19
|
1,149,401
164.04% of 50 DAV
50 DAV is 700,700
|
$23.92
0.96%
|
9/22/2010
|
$23.60
|
PP = $23.87
|
|
MB = $25.06
|
Most Recent Note - 9/24/2010 11:56:26 AM
Y - Gapped up today, trading at its 52-week high and near its pivot point with no overhead supply remaining to act as resistance. It has formed a saucer-like base in the past 9 weeks that included a couple of weeks trading under its 50 DMA line.
>>> The latest Featured Stock Update with an annotated graph appeared on 9/22/2010. Click here.
View all notes |
Alert me of new notes |
CANSLIM.net Company Profile |
SEC |
Zacks Reports |
StockTalk |
News |
Chart |
Request a new note
C
A N
S L
I M
|
UA
-
NYSE
Under Armour Inc Cl A
CONSUMER NON-DURABLES - Textile - Apparel Clothing
|
$44.92
|
+0.53
1.19% |
$46.10
|
845,353
112.16% of 50 DAV
50 DAV is 753,700
|
$45.44
-1.14%
|
9/9/2010
|
$39.99
|
PP = $40.10
|
|
MB = $42.11
|
Most Recent Note - 9/22/2010 2:47:52 PM
G - Pulling back on lighter volume, it is extended from its latest sound base pattern following a streak of 14 consecutive gains.
>>> The latest Featured Stock Update with an annotated graph appeared on 9/9/2010. Click here.
View all notes |
Alert me of new notes |
CANSLIM.net Company Profile |
SEC |
Zacks Reports |
StockTalk |
News |
Chart |
Request a new note
C
A N
S L
I M
|
UFPT
-
NASDAQ
U F P Tech Inc
CONSUMER NON-DURABLES - Packaging and Containers
|
$11.20
|
-0.10
-0.88% |
$11.74
|
114,652
281.01% of 50 DAV
50 DAV is 40,800
|
$11.85
-5.49%
|
9/16/2010
|
$11.20
|
PP = $11.69
|
|
MB = $12.27
|
Most Recent Note - 9/24/2010 1:09:48 PM
Y - Enduring mild distributional pressure near its 52-week high and pivot point. No resistance remains due to overhead supply, and with only 6.21 million shares outstanding (S criteria) any institutional buying or selling can lead to greater price volatility.
>>> The latest Featured Stock Update with an annotated graph appeared on 9/17/2010. Click here.
View all notes |
Alert me of new notes |
CANSLIM.net Company Profile |
SEC |
Zacks Reports |
StockTalk |
News |
Chart |
Request a new note
C
A N
S L
I M
|
ULTA
-
NASDAQ
Ulta Salon Cosm & Frag
SPECIALTY RETAIL - Specialty Retail, Other
|
$28.93
|
+1.27
4.59% |
$28.94
|
409,888
67.45% of 50 DAV
50 DAV is 607,700
|
$29.47
-1.83%
|
9/3/2010
|
$26.36
|
PP = $25.89
|
|
MB = $27.18
|
Most Recent Note - 9/24/2010 3:59:00 PM
G - Small gap up gain today on light volume, rallying near its best close of the year. Prior highs in the $26 area define support to watch now.
>>> The latest Featured Stock Update with an annotated graph appeared on 9/3/2010. Click here.
View all notes |
Alert me of new notes |
CANSLIM.net Company Profile |
SEC |
Zacks Reports |
StockTalk |
News |
Chart |
Request a new note
C
A N
S L
I M
|
VIT
-
NYSE
Vanceinfo Tech Inc Ads
COMPUTER SOFTWARE and SERVICES - Business Software and Services
|
$32.54
|
+0.93
2.94% |
$32.97
|
1,284,418
230.89% of 50 DAV
50 DAV is 556,300
|
$31.92
1.94%
|
7/8/2010
|
$25.20
|
PP = $26.58
|
|
MB = $27.91
|
Most Recent Note - 9/24/2010 1:11:04 PM
G - Gapped up today for a second consecutive gain with above average volume and a new all-time high. It is extended from a prior resistance level in the $26 area. Its 50 DMA line defines chart support to watch.
>>> The latest Featured Stock Update with an annotated graph appeared on 8/31/2010. Click here.
View all notes |
Alert me of new notes |
CANSLIM.net Company Profile |
SEC |
Zacks Reports |
StockTalk |
News |
Chart |
Request a new note
C
A N
S L
I M
|
Symbol/Exchange
Company Name
Industry Group |
PRICE |
CHANGE
(%Change) |
Day High |
Volume
(% DAV)
(% 50 day avg vol) |
52 Wk Hi
% From Hi |
Featured
Date |
Price
Featured |
Pivot Featured |
|
Max Buy |
WCRX
-
NASDAQ
Warner Chilcott Plc
DRUGS - Drug Manufacturers - Other
|
$22.60
|
+0.13
0.58% |
$23.10
|
3,637,403
152.93% of 50 DAV
50 DAV is 2,378,500
|
$23.53
-3.95%
|
8/23/2010
|
$21.04
|
PP = $20.84
|
|
MB = $21.88
|
Most Recent Note - 9/20/2010 5:17:09 PM
G - Gain today with near average volume for yet another new all-time high. Color code was changed to green after getting extended from its prior base. (Featured price, pivot point, and max buy data are adjusted -$8.50 following recent cash dividend.)
>>> The latest Featured Stock Update with an annotated graph appeared on 8/23/2010. Click here.
View all notes |
Alert me of new notes |
CANSLIM.net Company Profile |
SEC |
Zacks Reports |
StockTalk |
News |
Chart |
Request a new note
C
A N
S L
I M
|