You are not logged in.
This means you
CAN ONLY VIEW reports that were published prior to Monday, April 14, 2025.
You
MUST UPGRADE YOUR MEMBERSHIP if you want to see any current reports.
AFTER MARKET UPDATE - TUESDAY, SEPTEMBER 23RD, 2014
Previous After Market Report Next After Market Report >>>
|
|
|
|
DOW |
-116.81 |
17,055.87 |
-0.68% |
|
Volume |
703,127,550 |
+3% |
|
Volume |
1,699,484,040 |
-2% |
|
NASDAQ |
-19.00 |
4,508.69 |
-0.42% |
|
Advancers |
892 |
28% |
|
Advancers |
822 |
29% |
|
S&P 500 |
-11.52 |
1,982.77 |
-0.58% |
|
Decliners |
2,187 |
69% |
|
Decliners |
1,946 |
68% |
|
Russell 2000 |
-10.65 |
1,118.72 |
-0.94% |
|
52 Wk Highs |
13 |
|
|
52 Wk Highs |
21 |
|
|
S&P 600 |
-6.52 |
643.80 |
-1.00% |
|
52 Wk Lows |
132 |
|
|
52 Wk Lows |
132 |
|
|
 |
Major Indices Faced Pressure
Kenneth J. Gruneisen - Passed the CAN SLIM® Master's Exam
The major averages finished on lower Tuesday’s session. The Dow fell 117 points to 17,055. The NASDAQ lost 19 points to close at 4,508. Volume totals were reported mixed, higher than the prior session total on the NYSE and lower on the Nasdaq exchange. Breadth was negative as decliners led advancers by more than a 2-1 margin on the NYSE and on the NASDAQ exchange. There were 6 high-ranked companies from the CANSLIM.net Leaders List that made new 52-week highs and appeared on the CANSLIM.net BreakOuts Page, down a notch from the prior session total of 7 stocks. New 52-week lows outnumbered a shrinking list of new highs on the NYSE and on the Nasdaq exchange. There were gains for 5 of the 11 high-ranked companies currently included on the Featured Stocks Page. The broader market (M criteria) has encountered distributional action while leadership (stocks hitting new 52-week highs) has recently been waning, putting the rally under pressure. Remember that disciplined investors buy stocks with superior fundamentals only after they have triggered a proper technical buy signal.
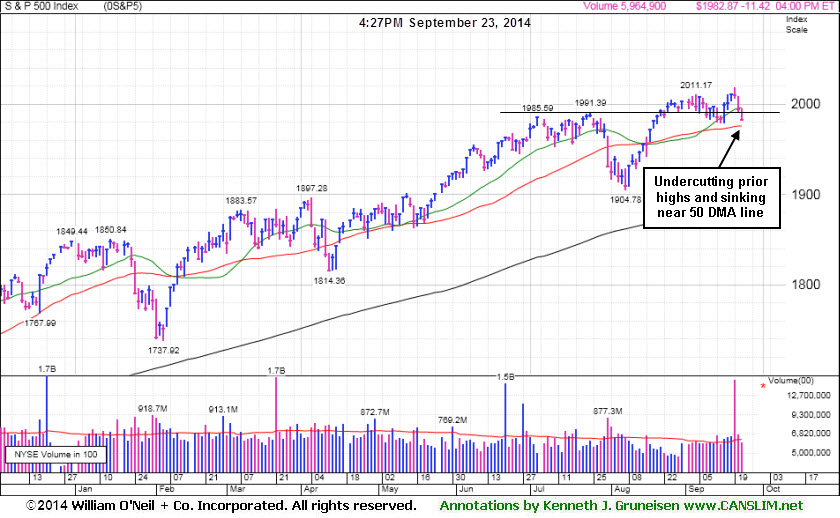
PICTURED: The S&P 500 Index declined 12 points to 1,982, undercutting prior highs and slumping toward its 50-day moving average (DMA) line.
The major averages extended their pullback amid increased tension in the Middle East. Stocks declined after the U.S. and its Arab allies launched more than 200 airstrikes against key Islamic militant targets in Syria. On the economic front, a measure of home prices increased 0.1% in July, less than an expected 0.4% increase. A separate release revealed manufacturing sentiment remained at a four year high in September. In M&A news, the Treasury Department said it plans to increase regulation on U.S companies from tax-saving merger deals. Healthcare stocks dropped in response to the news with AbbVie (ABBV -2%) and Medtronic (MDT -2.9%) falling.
All 10 sectors in the S&P 500 finished in negative territory. Consumer staples were the worst performing group with Philip Morris (PM -1.6%) and Clorox (CLX -2.5%) both ending lower. Technology was the relative outperformer on the session, buffered by Apple (AAPL +1.6%).
Treasuries rallied on the geopolitical uncertainty. The 10-year note climbed 10/32 to yield 2.53%. In commodities, WTI crude gained 0.7% to $91.47 a barrel on the NYMEX. COMEX gold climbed 0.5% to $1,223.00 an ounce.
The CANSLIM.net Featured Stocks Page shows the most action-worthy candidates and their latest notes and a Headline Link directs members to the latest detailed analysis with data-packed graphs annotated by a Certified expert along with links to additional resources. The Premium Member Homepage includes "dynamic archives" to all prior pay reports published.
|
 Kenneth J. Gruneisen started out as a licensed stockbroker in August 1987, a couple of months prior to the historic stock market crash that took the Dow Jones Industrial Average down -22.6% in a single day. He has published daily fact-based fundamental and technical analysis on high-ranked stocks online for two decades. Through FACTBASEDINVESTING.COM, Kenneth provides educational articles, news, market commentary, and other information regarding proven investment systems that work in good times and bad.
Comments contained in the body of this report are technical opinions only and are not necessarily those of Gruneisen Growth Corp. The material herein has been obtained from sources believed to be reliable and accurate, however, its accuracy and completeness cannot be guaranteed. Our firm, employees, and customers may effect transactions, including transactions contrary to any recommendation herein, or have positions in the securities mentioned herein or options with respect thereto. Any recommendation contained in this report may not be suitable for all investors and it is not to be deemed an offer or solicitation on our part with respect to the purchase or sale of any securities. |
|
 |
Financial, Retail, and Tech Indices Fell
Kenneth J. Gruneisen - Passed the CAN SLIM® Master's Exam
Financial shares created a drag on the major averages as the Bank Index ($BKX -0.89%) and the Broker/Dealer Index ($XBD -0.82%) fell on Tuesday. The Retail Index ($RLX -0.58%) suffered a modest loss and the tech sector saw unanimous losses from the Networking Index ($NWX -1.07%), Biotechnology Index ($BTK -0.37%), and the Semiconductor Index ($SOX -0.23%). The Gold & Silver Index ($XAU +1.71%) was a standout gainer and the Oil Services Index ($OSX +0.14%) inched higher while the Integrated Oil Index ($XOI -0.71%) slumped.
Charts courtesy www.stockcharts.com
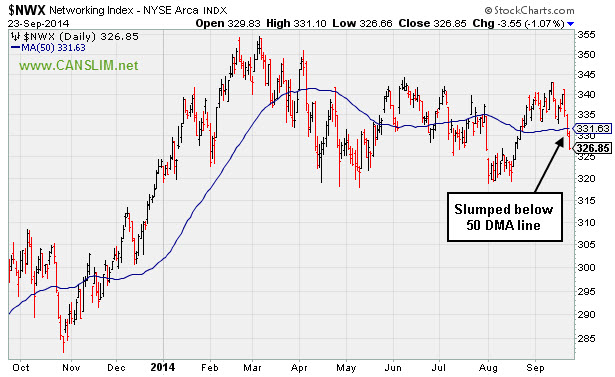
PICTURED: The Networking Index ($NWX -1.07%) recently slumped below its 50-day moving average (DMA line.
| Oil Services |
$OSX |
272.51 |
+0.38 |
+0.14% |
-3.03% |
| Integrated Oil |
$XOI |
1,581.83 |
-11.28 |
-0.71% |
+5.23% |
| Semiconductor |
$SOX |
639.85 |
-1.50 |
-0.23% |
+19.59% |
| Networking |
$NWX |
326.85 |
-3.55 |
-1.07% |
+0.90% |
| Broker/Dealer |
$XBD |
171.70 |
-1.42 |
-0.82% |
+6.94% |
| Retail |
$RLX |
931.06 |
-5.46 |
-0.58% |
-0.93% |
| Gold & Silver |
$XAU |
85.88 |
+1.44 |
+1.71% |
+2.06% |
| Bank |
$BKX |
72.50 |
-0.65 |
-0.89% |
+4.68% |
| Biotech |
$BTK |
3,075.81 |
-11.42 |
-0.37% |
+31.98% |
|
|
|
 |
Consolidating Above 50-day Moving Average and Prior Highs
Kenneth J. Gruneisen - Passed the CAN SLIM® Master's Exam
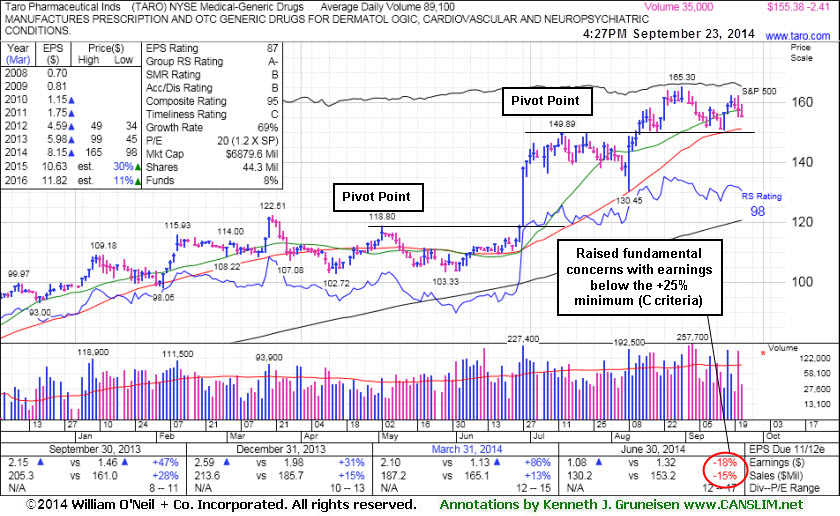
Taro Pharmaceutical Inds (TARO -$2.66 or -1.69% to $155.13) is consolidating -6% off its 52-week high, enduring more distributional pressure this week. It has been repeatedly noted with caution - "Recently reported earnings for the Jun '14 quarter below the +25% minimum earnings guideline (C criteria) raising fundamental concerns." It found support at its 50-day moving average (DMA) line and rebounded toward prior highs since last shown in this FSU section on 9/02/14 with annotated graphs under the headline,"Churning Action Indicative of Distributional Pressure". It traded up as much as +40.9% since first featured in yellow in the 6/26/14 mid-day report at $117.31.
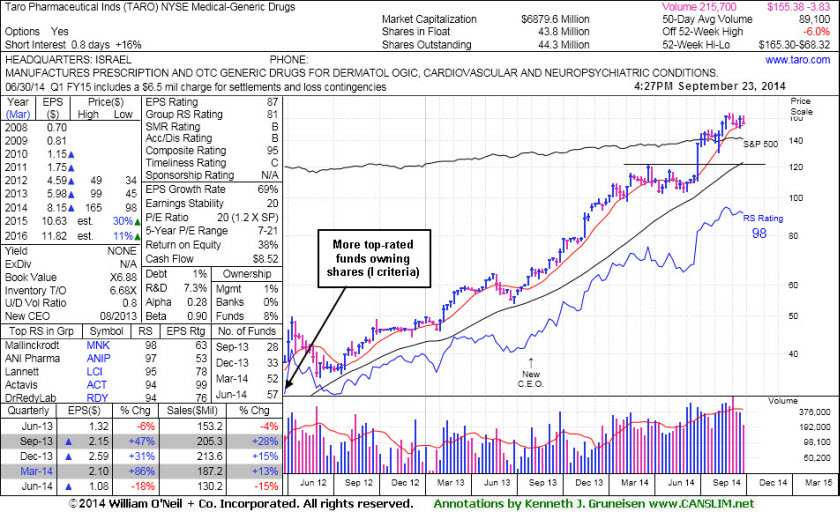
The Israel-based Medical - Generic Drugs firm has seen the number of top-rated funds owning its shares rise from 2 in Mar '12 to 57 as of Jun '14, a reassuring sign concerning the I criteria. TARO has a small supply (S criteria) of only 44.3 million shares outstanding, which is favorable, however any institutional buying or selling could lead to great price volatility. Disciplined investors who may still be giving it the benefit of the doubt should be watchful for any damaging sell signals which would prompt them to lock in gains.
|
|
|
Color Codes Explained :
Y - Better candidates highlighted by our
staff of experts.
G - Previously featured
in past reports as yellow but may no longer be buyable under the
guidelines.
***Last / Change / Volume data in this table is the closing quote data***
Symbol/Exchange
Company Name
Industry Group |
PRICE |
CHANGE
(%Change) |
Day High |
Volume
(% DAV)
(% 50 day avg vol) |
52 Wk Hi
% From Hi |
Featured
Date |
Price
Featured |
Pivot Featured |
|
Max Buy |
ACT
-
NYSE
Actavis plc
Medical-Generic Drugs
|
$240.85
|
+5.23
2.22% |
$248.81
|
6,208,544
289.04% of 50 DAV
50 DAV is 2,148,000
|
$245.50
-1.89%
|
6/20/2014
|
$216.53
|
PP = $230.87
|
|
MB = $242.41
|
 Most Recent Note - 9/23/2014 5:13:55 PM
Y - Hit a new 52-week high with today's gain backed nearly 3 times average volume, a solid confirmation day following its recently noted technical buy signal. Prior highs near $230 define near-term support to watch on pullbacks.
>>> FEATURED STOCK ARTICLE : Finally Volume-backed Gains Confirmed a Technical Buy Signal - 9/19/2014
View all notes |
Set NEW NOTE alert |
CANSLIM.net Company Profile |
SEC
News |
Chart |
Request a new note
C
A N
S L
I M


|
BITA
-
NYSE
Bitauto Hldgs Ltd Ads
Internet-Content
|
$79.02
|
+1.65
2.13% |
$81.11
|
1,415,241
82.71% of 50 DAV
50 DAV is 1,711,000
|
$98.28
-19.60%
|
6/26/2014
|
$46.20
|
PP = $47.03
|
|
MB = $49.38
|
Most Recent Note - 9/22/2014 12:09:11 PM
G - Undercutting prior lows and slumping toward its 50 DMA line with higher volume behind today's loss. Noted repeatedly with caution - "Has the look of a 'climax run' with volume-driven gains getting very extended from its prior base."
>>> FEATURED STOCK ARTICLE : Volume Totals Recently Cooling After Halting Slide - 9/18/2014
View all notes |
Set NEW NOTE alert |
CANSLIM.net Company Profile |
SEC
News |
Chart |
Request a new note
C
A N
S L
I M
|
FB
-
NASDAQ
Facebook Inc Cl A
INTERNET
|
$78.29
|
+1.49
1.94% |
$78.63
|
36,651,798
101.61% of 50 DAV
50 DAV is 36,070,000
|
$78.36
-0.09%
|
9/9/2014
|
$76.67
|
PP = $76.84
|
|
MB = $80.68
|
Most Recent Note - 9/23/2014 5:18:08 PM
Y - Rallied with average volume for its best-ever close today. The volume-driven gain on 9/19/14 helped confirm a new (or add-on) technical buy signal. Found support at its 50 DMA line ($74.19) last week after a light bout of distributional pressure.
>>> FEATURED STOCK ARTICLE : Wedging Gains Not Indicative of Institutional Conviction - 9/9/2014
View all notes |
Set NEW NOTE alert |
CANSLIM.net Company Profile |
SEC
News |
Chart |
Request a new note
C
A N
S L
I M
|
NVGS
-
NYSE
Navigator Holdings Ltd
Transportation-Ship
|
$30.87
|
-0.63
-2.00% |
$31.44
|
157,183
66.32% of 50 DAV
50 DAV is 237,000
|
$31.90
-3.23%
|
9/16/2014
|
$30.33
|
PP = $30.56
|
|
MB = $32.09
|
Most Recent Note - 9/22/2014 12:28:27 PM
Y - Still holding its ground near its 52-week high (N criteria) after volume-driven gains triggered a technical buy signal. Prior highs near $30 define initial support to watch on pullbacks. Disciplined investors do not chase stocks more than +5% above their pivot point, and they always limit losses by selling if any stock falls more than -7% from their purchase price.
>>> FEATURED STOCK ARTICLE : Finished Strong While Challenging Pivot Point and Recent Highs - 9/16/2014
View all notes |
Set NEW NOTE alert |
CANSLIM.net Company Profile |
SEC
News |
Chart |
Request a new note
C
A N
S L
I M
|
NXPI
-
NASDAQ
Nxp Semiconductors N V
ELECTRONICS - Semiconductor - Broad Line
|
$72.00
|
+1.20
1.69% |
$72.26
|
2,889,936
85.40% of 50 DAV
50 DAV is 3,384,000
|
$73.82
-2.47%
|
8/29/2014
|
$68.50
|
PP = $67.89
|
|
MB = $71.28
|
Most Recent Note - 9/23/2014 5:20:02 PM
G - Rallied for a second-best close today after quietly dipping below its "max buy" level. No overhead supply remains to act as resistance. Prior highs in the $67 area define initial support to watch on pullbacks.
>>> FEATURED STOCK ARTICLE : Consolidating Above Pivot Point and Below "Max Buy" Level - 9/17/2014
View all notes |
Set NEW NOTE alert |
CANSLIM.net Company Profile |
SEC
News |
Chart |
Request a new note
C
A N
S L
I M
|
Symbol/Exchange
Company Name
Industry Group |
PRICE |
CHANGE
(%Change) |
Day High |
Volume
(% DAV)
(% 50 day avg vol) |
52 Wk Hi
% From Hi |
Featured
Date |
Price
Featured |
Pivot Featured |
|
Max Buy |
PANW
-
NYSE
Palo Alto Networks
Computer Sftwr-Security
|
$97.43
|
-0.50
-0.51% |
$98.49
|
1,417,448
85.34% of 50 DAV
50 DAV is 1,661,000
|
$102.45
-4.90%
|
7/30/2014
|
$84.21
|
PP = $85.88
|
|
MB = $90.17
|
Most Recent Note - 9/22/2014 12:29:41 PM
G - Extended from any sound base after recent volume-driven gains. Prior highs in the $87 area define initial support to watch above its 50 DMA line ($85.83). Disciplined investors avoid chasing extended stocks.
>>> FEATURED STOCK ARTICLE : Pulling Back Following New Technical Breakout - 9/4/2014
View all notes |
Set NEW NOTE alert |
CANSLIM.net Company Profile |
SEC
News |
Chart |
Request a new note
C
A N
S L
I M
|
STRT
-
NASDAQ
Strattec Security Corp
AUTOMOTIVE - Auto Parts
|
$82.47
|
-1.47
-1.75% |
$84.38
|
45,752
207.96% of 50 DAV
50 DAV is 22,000
|
$89.87
-8.24%
|
9/19/2014
|
$86.06
|
PP = $89.97
|
|
MB = $94.47
|
Most Recent Note - 9/23/2014 12:30:32 PM
Y - Rebounded from today's early lows. Formed an advanced "3-weeks tight" base while holding its ground stubbornly. Subsequent volume-driven gains above the new pivot point cited may trigger a new (or add-on) technical buy signal. Prior highs in the $74-77 area define initial support to watch on pullbacks.
>>> FEATURED STOCK ARTICLE : Extended From Prior Highs and Previously Noted Base - 9/10/2014
View all notes |
Set NEW NOTE alert |
CANSLIM.net Company Profile |
SEC
News |
Chart |
Request a new note
C
A N
S L
I M
|
TARO
-
NYSE
Taro Pharmaceutical Inds
DRUGS - Drug Manufacturers - Other
|
$155.13
|
-2.66
-1.69% |
$159.35
|
35,417
39.79% of 50 DAV
50 DAV is 89,000
|
$165.30
-6.15%
|
7/30/2014
|
$144.24
|
PP = $149.99
|
|
MB = $157.49
|
Most Recent Note - 9/23/2014 5:11:40 PM
G - Consolidating above its 50 DMA line and -6% off its 52-week high. Enduring recent distributional pressure. See the latest FSU analysis for more details and new annotated graphs. Repeatedly noted with caution - "Recently reported earnings for the Jun '14 quarter below the +25% minimum earnings guideline (C criteria) raising fundamental concerns."
>>> FEATURED STOCK ARTICLE : Consolidating Above 50-day Moving Average and Prior Highs - 9/23/2014
View all notes |
Set NEW NOTE alert |
CANSLIM.net Company Profile |
SEC
News |
Chart |
Request a new note
C
A N
S L
I M
|
TRN
-
NYSE
Trinity Industries Inc
TRANSPORTATION - Railroads
|
$47.53
|
-0.89
-1.84% |
$48.16
|
2,541,953
98.22% of 50 DAV
50 DAV is 2,588,000
|
$50.77
-6.39%
|
4/30/2014
|
$37.79
|
PP = $38.03
|
|
MB = $39.93
|
Most Recent Note - 9/22/2014 5:44:01 PM
G - Pulled back today with above average volume following 4 consecutive volume-driven gains. It has not formed a sound base. Prior highs near $46-47 define near-term support above its 50 DMA line.
>>> FEATURED STOCK ARTICLE : Consolidating Above 50-Day Moving Average Line - 9/12/2014
View all notes |
Set NEW NOTE alert |
CANSLIM.net Company Profile |
SEC
News |
Chart |
Request a new note
C
A N
S L
I M
|
UA
-
NYSE
Under Armour Inc Cl A
CONSUMER NON-DURABLES - Textile - Apparel Clothing
|
$66.88
|
+0.41
0.62% |
$68.00
|
2,326,402
96.53% of 50 DAV
50 DAV is 2,410,000
|
$73.42
-8.91%
|
7/10/2014
|
$58.50
|
PP = $60.79
|
|
MB = $63.83
|
Most Recent Note - 9/22/2014 5:47:30 PM
G - Violated its 50 DMA line with today's 2nd consecutive loss with above average volume triggering a technical sell signal. Only a prompt rebound would help its outlook improve. Prior notes cautioned members - "Fundamental concerns were raised by earnings reported +0% on +34% sales revenues for the Jun '14 quarter, below the +25% minimum earnings guideline (C criteria)."
>>> FEATURED STOCK ARTICLE : Higher Volume Behind Loss Testing 50-Day Moving Average - 9/15/2014
View all notes |
Set NEW NOTE alert |
CANSLIM.net Company Profile |
SEC
News |
Chart |
Request a new note
C
A N
S L
I M
|
Symbol/Exchange
Company Name
Industry Group |
PRICE |
CHANGE
(%Change) |
Day High |
Volume
(% DAV)
(% 50 day avg vol) |
52 Wk Hi
% From Hi |
Featured
Date |
Price
Featured |
Pivot Featured |
|
Max Buy |
WLK
-
NYSE
Westlake Chemical Corp
CHEMICALS - Specialty Chemicals
|
$91.85
|
-1.33
-1.43% |
$93.52
|
561,822
111.47% of 50 DAV
50 DAV is 504,000
|
$98.44
-6.69%
|
4/29/2014
|
$72.79
|
PP = $69.31
|
|
MB = $72.78
|
Most Recent Note - 9/23/2014 5:16:07 PM
G - Churned higher volume today while slumping and testing prior highs in the $92 area and its 50 DMA line ($91.50). More damaging losses would raise greater concerns and trigger technical sell signals. Recent fundamental concerns were noted.
>>> FEATURED STOCK ARTICLE : Consolidating Above Near-Term Support Levels - 9/11/2014
View all notes |
Set NEW NOTE alert |
CANSLIM.net Company Profile |
SEC
News |
Chart |
Request a new note
C
A N
S L
I M
|
|
|
|
THESE ARE NOT BUY RECOMMENDATIONS!
Comments contained in the body of this report are technical
opinions only. The material herein has been obtained
from sources believed to be reliable and accurate, however,
its accuracy and completeness cannot be guaranteed.
This site is not an investment advisor, hence it does
not endorse or recommend any securities or other investments.
Any recommendation contained in this report may not
be suitable for all investors and it is not to be deemed
an offer or solicitation on our part with respect to
the purchase or sale of any securities. All trademarks,
service marks and trade names appearing in this report
are the property of their respective owners, and are
likewise used for identification purposes only.
This report is a service available
only to active Paid Premium Members.
You may opt-out of receiving report notifications
at any time. Questions or comments may be submitted
by writing to Premium Membership Services 665 S.E. 10 Street, Suite 201 Deerfield Beach, FL 33441-5634 or by calling 1-800-965-8307
or 954-785-1121.
|
|
|

