You are not logged in.
This means you
CAN ONLY VIEW reports that were published prior to Wednesday, April 9, 2025.
You
MUST UPGRADE YOUR MEMBERSHIP if you want to see any current reports.
AFTER MARKET UPDATE - WEDNESDAY, SEPTEMBER 24TH, 2014
Previous After Market Report Next After Market Report >>>
|
|
|
|
DOW |
+154.19 |
17,210.06 |
+0.90% |
|
Volume |
730,618,420 |
+4% |
|
Volume |
1,627,050,840 |
-4% |
|
NASDAQ |
+46.53 |
4,555.22 |
+1.03% |
|
Advancers |
1,796 |
56% |
|
Advancers |
1,857 |
65% |
|
S&P 500 |
+15.53 |
1,998.30 |
+0.78% |
|
Decliners |
1,243 |
39% |
|
Decliners |
893 |
31% |
|
Russell 2000 |
+9.60 |
1,128.31 |
+0.86% |
|
52 Wk Highs |
25 |
|
|
52 Wk Highs |
29 |
|
|
S&P 600 |
+5.13 |
648.93 |
+0.80% |
|
52 Wk Lows |
131 |
|
|
52 Wk Lows |
136 |
|
|
 |
Breadth Positive as Major Averages Rebounded
Kenneth J. Gruneisen - Passed the CAN SLIM® Master's Exam
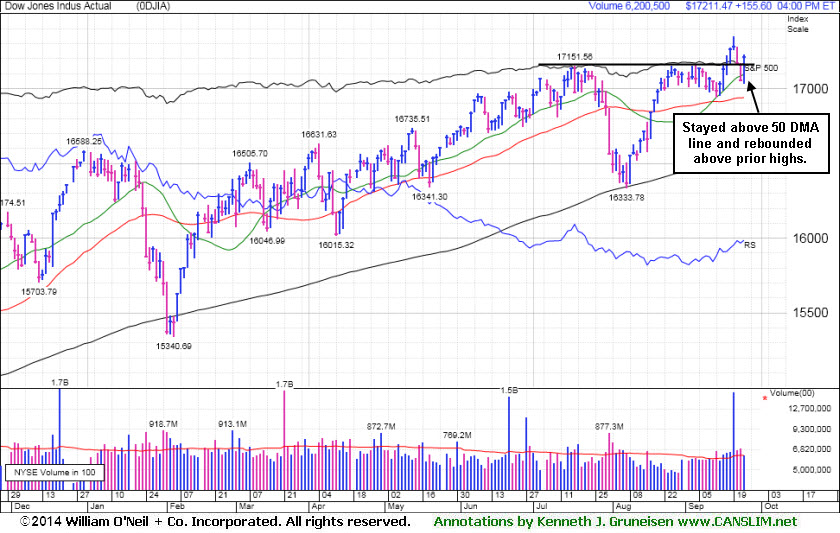
Stocks rebounded Wednesday from a three day losing streak. The S&P 500 advanced 16 points to 1,998. The NASDAQ climbed 46 points to 4,555. Volume totals were reported mixed, higher than the prior session total on the NYSE and lower on the Nasdaq exchange. Breadth was positive as advancers led decliners by a 3-2 margin on the NYSE and 2-1 on the NASDAQ exchange. There were 7 high-ranked companies from the CANSLIM.net Leaders List that made new 52-week highs and appeared on the CANSLIM.net BreakOuts Page, up a notch from the prior session total of 6 stocks. New 52-week lows outnumbered new highs on the NYSE and on the Nasdaq exchange. There were gains for 8 of the 11 high-ranked companies currently included on the Featured Stocks Page. The broader market (M criteria) has encountered distributional action while leadership (stocks hitting new 52-week highs) has recently been waning, putting the rally under pressure. Remember that disciplined investors buy stocks with superior fundamentals only after they have triggered a proper technical buy signal.
PICTURED: The Dow Jones Industrial Average gained 154 points to 17,210. It stayed above its 50-day moving average (DMA) line during its recent consolidation and rebounded above prior highs.
The major averages advanced thanks to positive housing data. A measure of new home sales climbed to a six year high in August, after gaining 1.9% in July. On the geopolitical front the U.S. and a coalition of Arab allies increased airstrikes against radical Islamist targets in Syria.
In corporate activity Bed Bath & Beyond (BBBY +7.4%) rallied after the company reported surprisingly strong earnings results. However, despite positive housing data, homebuilder KB Homes (KBH -5.3%) fell after posting a disappointing profit tally.
At the close nine of the 10 sectors in the S&P 500 finished in positive territory. Health care paced the advance, after recent regulation rattled the sector over the last two days. AbbVie (ABBV +2.6%) and Vertex Pharmaceuticals (VRTX +6.8%) advanced. The more defensive utilities sector bucked the uptrend to finish lower. NextEra Energy (NEE -0.4%) fell.
Treasuries snapped a four-day winning streak and a government auction of five-year notes received the lowest demand since last December. The benchmark 10-year note lost 11/32 to yield 2.56%.
The CANSLIM.net Featured Stocks Page shows the most action-worthy candidates and their latest notes and a Headline Link directs members to the latest detailed analysis with data-packed graphs annotated by a Certified expert along with links to additional resources. The Premium Member Homepage includes "dynamic archives" to all prior pay reports published.
|
 Kenneth J. Gruneisen started out as a licensed stockbroker in August 1987, a couple of months prior to the historic stock market crash that took the Dow Jones Industrial Average down -22.6% in a single day. He has published daily fact-based fundamental and technical analysis on high-ranked stocks online for two decades. Through FACTBASEDINVESTING.COM, Kenneth provides educational articles, news, market commentary, and other information regarding proven investment systems that work in good times and bad.
Comments contained in the body of this report are technical opinions only and are not necessarily those of Gruneisen Growth Corp. The material herein has been obtained from sources believed to be reliable and accurate, however, its accuracy and completeness cannot be guaranteed. Our firm, employees, and customers may effect transactions, including transactions contrary to any recommendation herein, or have positions in the securities mentioned herein or options with respect thereto. Any recommendation contained in this report may not be suitable for all investors and it is not to be deemed an offer or solicitation on our part with respect to the purchase or sale of any securities. |
|
 |
Tech, Retail and Financial Groups Posted Gains
Kenneth J. Gruneisen - Passed the CAN SLIM® Master's Exam
The Retail Index ($RLX +1.57%) rallied and modest gains from the financial sector also helped underpin the major averages' gains as the Bank Index ($BKX +0.36%) and the Broker/Dealer Index ($XBD +0.36%) edged higher. The tech sector had a positive bias as the Networking Index ($NWX +1.01%), Semiconductor Index ($SOX +1.20%), and Biotechnology Index ($BTK +2.76%) posted solid gains. The Gold & Silver Index ($XAU -1.05%) fell while the Oil Services Index ($OSX -0.01%) finished flat and the Integrated Oil Index ($XOI +0.62%) posted a small gain.
Charts courtesy www.stockcharts.com
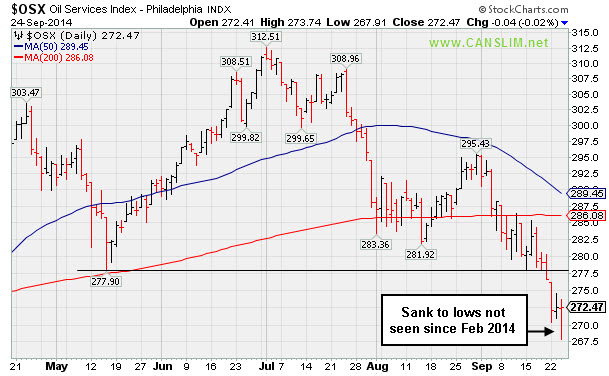
PICTURED: The Oil Services Index ($OSX -0.01%) recently sank to lows not seen since February 2014.
| Oil Services |
$OSX |
272.47 |
-0.04 |
-0.01% |
-3.05% |
| Integrated Oil |
$XOI |
1,591.62 |
+9.80 |
+0.62% |
+5.89% |
| Semiconductor |
$SOX |
647.53 |
+7.68 |
+1.20% |
+21.03% |
| Networking |
$NWX |
330.15 |
+3.30 |
+1.01% |
+1.92% |
| Broker/Dealer |
$XBD |
172.31 |
+0.62 |
+0.36% |
+7.32% |
| Retail |
$RLX |
945.64 |
+14.58 |
+1.57% |
+0.62% |
| Gold & Silver |
$XAU |
84.98 |
-0.90 |
-1.05% |
+0.99% |
| Bank |
$BKX |
72.76 |
+0.26 |
+0.36% |
+5.05% |
| Biotech |
$BTK |
3,160.62 |
+84.80 |
+2.76% |
+35.62% |
|
|
|
 |
Holding Ground Near Highs After Big Volume-Driven Gains
Kenneth J. Gruneisen - Passed the CAN SLIM® Master's Exam
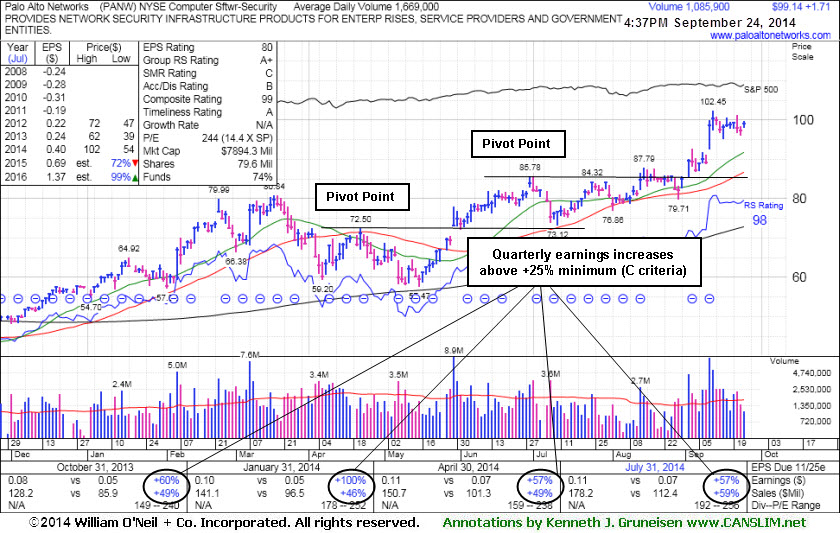
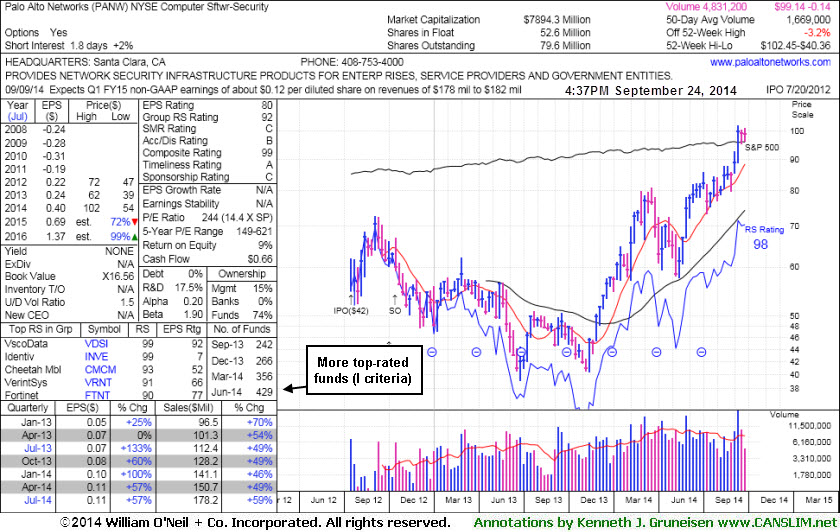
Palo Alto Networks (PANW +$1.71 or +1.76% to $99.14) is extended from any sound base and stubbornly holding its ground after recent volume-driven gains. Prior highs in the $87 area define initial support to watch above its 50-day moving average (DMA) line ($86.74). Disciplined investors avoid chasing extended stocks more the +5% above prior highs and they always limit losses by selling any stock that falls more than -7% from their purchase price. It was last shown in this FSU section with annotated graphs on 9/04/14 under the headline, "Pulling Back Following New Technical Breakout", and no resistance remains due to overhead supply. Subsequent volume-driven gains lifted it well above its "max buy" level.
The high-ranked leader hailing from the Computer Software - Security industry group reported earnings +57% on +59% sales revenues for the Jul '14 quarter continuing its record of strong sales revenues increases and earnings above the +25% minimum guideline satisfying the C criteria. Its annual earnings (A criteria) history is a bit limited, but growth has been strong since its July 2012 IPO at $42. The number of top-rated funds owning its shares rose from 246 in Jun '13 to 429 in Jun '14, a reassuring sign concerning the I criteria. Its small supply (S criteria) of only 52.6 million shares in the public float is another favorable characteristic. Its current Up/Down Volume Ratio of 1.5 is an unbiased indication its shares have been under accumulation over the past 50 days.
|
|
|
Color Codes Explained :
Y - Better candidates highlighted by our
staff of experts.
G - Previously featured
in past reports as yellow but may no longer be buyable under the
guidelines.
***Last / Change / Volume data in this table is the closing quote data***
Symbol/Exchange
Company Name
Industry Group |
PRICE |
CHANGE
(%Change) |
Day High |
Volume
(% DAV)
(% 50 day avg vol) |
52 Wk Hi
% From Hi |
Featured
Date |
Price
Featured |
Pivot Featured |
|
Max Buy |
ACT
-
NYSE
Actavis plc
Medical-Generic Drugs
|
$248.00
|
+7.15
2.97% |
$248.50
|
2,993,949
133.78% of 50 DAV
50 DAV is 2,238,000
|
$248.81
-0.33%
|
6/20/2014
|
$216.53
|
PP = $230.87
|
|
MB = $242.41
|
 Most Recent Note - 9/24/2014 5:28:51 PM
G - Finished at a best-ever close well above its "max buy" level and its color code is changed to green. Prior highs near $230 define near-term support to watch on pullbacks.
>>> FEATURED STOCK ARTICLE : Finally Volume-backed Gains Confirmed a Technical Buy Signal - 9/19/2014
View all notes |
Set NEW NOTE alert |
CANSLIM.net Company Profile |
SEC
News |
Chart |
Request a new note
C
A N
S L
I M


|
BITA
-
NYSE
Bitauto Hldgs Ltd Ads
Internet-Content
|
$78.53
|
-0.49
-0.62% |
$80.01
|
1,588,627
92.47% of 50 DAV
50 DAV is 1,718,000
|
$98.28
-20.10%
|
6/26/2014
|
$46.20
|
PP = $47.03
|
|
MB = $49.38
|
Most Recent Note - 9/22/2014 12:09:11 PM
G - Undercutting prior lows and slumping toward its 50 DMA line with higher volume behind today's loss. Noted repeatedly with caution - "Has the look of a 'climax run' with volume-driven gains getting very extended from its prior base."
>>> FEATURED STOCK ARTICLE : Volume Totals Recently Cooling After Halting Slide - 9/18/2014
View all notes |
Set NEW NOTE alert |
CANSLIM.net Company Profile |
SEC
News |
Chart |
Request a new note
C
A N
S L
I M
|
FB
-
NASDAQ
Facebook Inc Cl A
INTERNET
|
$78.54
|
+0.25
0.31% |
$78.62
|
30,618,015
84.97% of 50 DAV
50 DAV is 36,035,000
|
$78.63
-0.12%
|
9/9/2014
|
$76.67
|
PP = $76.84
|
|
MB = $80.68
|
Most Recent Note - 9/23/2014 5:18:08 PM
Y - Rallied with average volume for its best-ever close today. The volume-driven gain on 9/19/14 helped confirm a new (or add-on) technical buy signal. Found support at its 50 DMA line ($74.19) last week after a light bout of distributional pressure.
>>> FEATURED STOCK ARTICLE : Wedging Gains Not Indicative of Institutional Conviction - 9/9/2014
View all notes |
Set NEW NOTE alert |
CANSLIM.net Company Profile |
SEC
News |
Chart |
Request a new note
C
A N
S L
I M
|
NVGS
-
NYSE
Navigator Holdings Ltd
Transportation-Ship
|
$29.34
|
-1.53
-4.96% |
$30.68
|
974,377
412.87% of 50 DAV
50 DAV is 236,000
|
$31.90
-8.03%
|
9/16/2014
|
$30.33
|
PP = $30.56
|
|
MB = $32.09
|
Most Recent Note - 9/24/2014 12:25:36 PM
Y - Undercutting prior highs with a considerable volume-driven loss today raising concerns. Its 50 DMA line ($29.29) defines the next important support level for chart readers. Disciplined investors do not chase stocks more than +5% above their pivot point, and they always limit losses by selling if any stock falls more than -7% from their purchase price.
>>> FEATURED STOCK ARTICLE : Finished Strong While Challenging Pivot Point and Recent Highs - 9/16/2014
View all notes |
Set NEW NOTE alert |
CANSLIM.net Company Profile |
SEC
News |
Chart |
Request a new note
C
A N
S L
I M
|
NXPI
-
NASDAQ
Nxp Semiconductors N V
ELECTRONICS - Semiconductor - Broad Line
|
$72.21
|
+0.21
0.29% |
$72.88
|
2,368,480
69.40% of 50 DAV
50 DAV is 3,413,000
|
$73.82
-2.18%
|
8/29/2014
|
$68.50
|
PP = $67.89
|
|
MB = $71.28
|
Most Recent Note - 9/23/2014 5:20:02 PM
G - Rallied for a second-best close today after quietly dipping below its "max buy" level. No overhead supply remains to act as resistance. Prior highs in the $67 area define initial support to watch on pullbacks.
>>> FEATURED STOCK ARTICLE : Consolidating Above Pivot Point and Below "Max Buy" Level - 9/17/2014
View all notes |
Set NEW NOTE alert |
CANSLIM.net Company Profile |
SEC
News |
Chart |
Request a new note
C
A N
S L
I M
|
Symbol/Exchange
Company Name
Industry Group |
PRICE |
CHANGE
(%Change) |
Day High |
Volume
(% DAV)
(% 50 day avg vol) |
52 Wk Hi
% From Hi |
Featured
Date |
Price
Featured |
Pivot Featured |
|
Max Buy |
PANW
-
NYSE
Palo Alto Networks
Computer Sftwr-Security
|
$99.14
|
+1.71
1.76% |
$99.75
|
1,094,538
65.58% of 50 DAV
50 DAV is 1,669,000
|
$102.45
-3.23%
|
7/30/2014
|
$84.21
|
PP = $85.88
|
|
MB = $90.17
|
Most Recent Note - 9/24/2014 5:31:05 PM
G - Holding its ground near all-time highs with volume totals cooling. Prior highs in the $87 area define initial support to watch above its 50 DMA line ($86.74). Disciplined investors avoid chasing extended stocks. See the latest FSU analysis for more details and new annotated graphs.
>>> FEATURED STOCK ARTICLE : Holding Ground Near Highs After Big Volume-Driven Gains - 9/24/2014
View all notes |
Set NEW NOTE alert |
CANSLIM.net Company Profile |
SEC
News |
Chart |
Request a new note
C
A N
S L
I M
|
STRT
-
NASDAQ
Strattec Security Corp
AUTOMOTIVE - Auto Parts
|
$81.77
|
-0.70
-0.85% |
$82.50
|
11,150
48.48% of 50 DAV
50 DAV is 23,000
|
$89.87
-9.02%
|
9/19/2014
|
$86.06
|
PP = $89.97
|
|
MB = $94.47
|
Most Recent Note - 9/23/2014 12:30:32 PM
Y - Rebounded from today's early lows. Formed an advanced "3-weeks tight" base while holding its ground stubbornly. Subsequent volume-driven gains above the new pivot point cited may trigger a new (or add-on) technical buy signal. Prior highs in the $74-77 area define initial support to watch on pullbacks.
>>> FEATURED STOCK ARTICLE : Extended From Prior Highs and Previously Noted Base - 9/10/2014
View all notes |
Set NEW NOTE alert |
CANSLIM.net Company Profile |
SEC
News |
Chart |
Request a new note
C
A N
S L
I M
|
TARO
-
NYSE
Taro Pharmaceutical Inds
DRUGS - Drug Manufacturers - Other
|
$157.84
|
+2.71
1.75% |
$158.45
|
59,562
67.68% of 50 DAV
50 DAV is 88,000
|
$165.30
-4.51%
|
7/30/2014
|
$144.24
|
PP = $149.99
|
|
MB = $157.49
|
Most Recent Note - 9/23/2014 5:11:40 PM
G - Consolidating above its 50 DMA line and -6% off its 52-week high. Enduring recent distributional pressure. See the latest FSU analysis for more details and new annotated graphs. Repeatedly noted with caution - "Recently reported earnings for the Jun '14 quarter below the +25% minimum earnings guideline (C criteria) raising fundamental concerns."
>>> FEATURED STOCK ARTICLE : Consolidating Above 50-day Moving Average and Prior Highs - 9/23/2014
View all notes |
Set NEW NOTE alert |
CANSLIM.net Company Profile |
SEC
News |
Chart |
Request a new note
C
A N
S L
I M
|
TRN
-
NYSE
Trinity Industries Inc
TRANSPORTATION - Railroads
|
$48.14
|
+0.61
1.28% |
$48.36
|
2,455,909
94.39% of 50 DAV
50 DAV is 2,602,000
|
$50.77
-5.19%
|
4/30/2014
|
$37.79
|
PP = $38.03
|
|
MB = $39.93
|
Most Recent Note - 9/22/2014 5:44:01 PM
G - Pulled back today with above average volume following 4 consecutive volume-driven gains. It has not formed a sound base. Prior highs near $46-47 define near-term support above its 50 DMA line.
>>> FEATURED STOCK ARTICLE : Consolidating Above 50-Day Moving Average Line - 9/12/2014
View all notes |
Set NEW NOTE alert |
CANSLIM.net Company Profile |
SEC
News |
Chart |
Request a new note
C
A N
S L
I M
|
UA
-
NYSE
Under Armour Inc Cl A
CONSUMER NON-DURABLES - Textile - Apparel Clothing
|
$68.68
|
+1.80
2.69% |
$68.74
|
1,884,539
77.39% of 50 DAV
50 DAV is 2,435,000
|
$73.42
-6.46%
|
7/10/2014
|
$58.50
|
PP = $60.79
|
|
MB = $63.83
|
Most Recent Note - 9/24/2014 5:32:59 PM
G - Rebounded above its 50 DMA line helping its outlook improve with today's 2nd consecutive gain on lighter volume. Prior notes cautioned members - "Fundamental concerns were raised by earnings reported +0% on +34% sales revenues for the Jun '14 quarter, below the +25% minimum earnings guideline (C criteria)."
>>> FEATURED STOCK ARTICLE : Higher Volume Behind Loss Testing 50-Day Moving Average - 9/15/2014
View all notes |
Set NEW NOTE alert |
CANSLIM.net Company Profile |
SEC
News |
Chart |
Request a new note
C
A N
S L
I M
|
Symbol/Exchange
Company Name
Industry Group |
PRICE |
CHANGE
(%Change) |
Day High |
Volume
(% DAV)
(% 50 day avg vol) |
52 Wk Hi
% From Hi |
Featured
Date |
Price
Featured |
Pivot Featured |
|
Max Buy |
WLK
-
NYSE
Westlake Chemical Corp
CHEMICALS - Specialty Chemicals
|
$92.13
|
+0.28
0.30% |
$92.44
|
641,400
126.76% of 50 DAV
50 DAV is 506,000
|
$98.44
-6.41%
|
4/29/2014
|
$72.79
|
PP = $69.31
|
|
MB = $72.78
|
Most Recent Note - 9/23/2014 5:16:07 PM
G - Churned higher volume today while slumping and testing prior highs in the $92 area and its 50 DMA line ($91.50). More damaging losses would raise greater concerns and trigger technical sell signals. Recent fundamental concerns were noted.
>>> FEATURED STOCK ARTICLE : Consolidating Above Near-Term Support Levels - 9/11/2014
View all notes |
Set NEW NOTE alert |
CANSLIM.net Company Profile |
SEC
News |
Chart |
Request a new note
C
A N
S L
I M
|
|
|
|
THESE ARE NOT BUY RECOMMENDATIONS!
Comments contained in the body of this report are technical
opinions only. The material herein has been obtained
from sources believed to be reliable and accurate, however,
its accuracy and completeness cannot be guaranteed.
This site is not an investment advisor, hence it does
not endorse or recommend any securities or other investments.
Any recommendation contained in this report may not
be suitable for all investors and it is not to be deemed
an offer or solicitation on our part with respect to
the purchase or sale of any securities. All trademarks,
service marks and trade names appearing in this report
are the property of their respective owners, and are
likewise used for identification purposes only.
This report is a service available
only to active Paid Premium Members.
You may opt-out of receiving report notifications
at any time. Questions or comments may be submitted
by writing to Premium Membership Services 665 S.E. 10 Street, Suite 201 Deerfield Beach, FL 33441-5634 or by calling 1-800-965-8307
or 954-785-1121.
|
|
|