You are not logged in.
This means you
CAN ONLY VIEW reports that were published prior to Monday, April 14, 2025.
You
MUST UPGRADE YOUR MEMBERSHIP if you want to see any current reports.
AFTER MARKET UPDATE - FRIDAY, SEPTEMBER 23RD, 2011
Previous After Market Report Next After Market Report >>>
|
|
|
|
DOW |
+37.65 |
10,771.48 |
+0.35% |
|
Volume |
1,229,826,920 |
-28% |
|
Volume |
1,933,778,140 |
-34% |
|
NASDAQ |
+27.56 |
2,483.23 |
+1.12% |
|
Advancers |
1,905 |
61% |
|
Advancers |
1,748 |
66% |
|
S&P 500 |
+6.87 |
1,136.43 |
+0.61% |
|
Decliners |
1,102 |
36% |
|
Decliners |
820 |
31% |
|
Russell 2000 |
+9.01 |
652.43 |
+1.40% |
|
52 Wk Highs |
7 |
|
|
52 Wk Highs |
4 |
|
|
S&P 600 |
+4.93 |
357.89 |
+1.40% |
|
52 Wk Lows |
275 |
|
|
52 Wk Lows |
202 |
|
|
 |
Major Averages Quietly Ended Worst Week Since October 2008
Kenneth J. Gruneisen - Passed the CAN SLIM® Master's Exam
It was a rough week on Wall Street as the major averages declined the most since October 2008. For the week, S&P 500 Index was down -6.5%, the Dow Jones Industrial Average declined -6.4% and the Nasdaq Composite Index shed -5.3%. Friday's modest advance for the major averages snapped a 4-day losing streak. However, lighter volume totals reported on the NYSE and on the Nasdaq exchange gave a clear sign that institutional investors did not have a very hearty appetite for buying stocks after the heavy wave of distributional action that sent the major averages back into a correction this week. Breadth was positive as advancers led decliners by better that 2-1 on the Nasdaq exchage and by nearly 2-1 on the NYSE. The new 52-week lows totals contracted but still greatly outnumbered new 52-week highs on both the Nasdaq exchange and the NYSE. New highs totals on the NYSE and Nasdaq remained in the single digits for a second consecutive session. There were gains from 8 of the 16 high-ranked companies currently included on the Featured Stocks Page. Meanwhile, for the second day in a row, Goodrich Corp (GR +0.95%) was the sole high-ranked company from the CANSLIM.net Leaders List that made a new 52-week high and appeared on the CANSLIM.net BreakOuts Page after the widely rumored deal with United Technologies Corp (UTX +0.89%).
Some expected that policy makers would work over the weekend to come up with a solution to shore up the global economy from heading into another recession. A report cited an internal document that European governments are looking to accelerate the set up of a permanent rescue fund. Late yesterday finance ministers of G-20 nations pledged to address the increasing risks and urged European leaders to take action to contain the region's debt crisis.
In company news, Hewlett-Packard Co (HPQ -2.11%) announced it has named former eBay CEO Meg Whitman as its new president and CEO. Whitman replaces highly criticized Leo Apotheker in an attempt by the company to restore investor confidence. Nike Inc (NKE +5.30%) rallied after it reported better-than-expected fiscal first-quarter earnings as revenues in North America surged. The maker of athletic shoes and apparel reported $1.36 for the most recent quarter compared to Wall Street analyst estimates of $1.21. Discretionary and tech stocks led Friday's gains with The Home Depot Inc (HD +2.03%) and Intel Corp (INTC +2.52%) among the standouts lifting the Dow.
Lower oil prices coupled with positive analyst comments sent airlines higher led by United Continental Holdings Inc (UAL +6.34%). Commodities continued their decline as crude oil fell $0.31 to $80.20 a barrel. Commodity prices were in negative territory. Gold remained under pressure as it continued its decline from its record price of $1,923.70 an ounce set on September 6th. Treasuries snapped a six day winning streak as the benchmark 10-year note fell over a point to push its yield 1.83%.
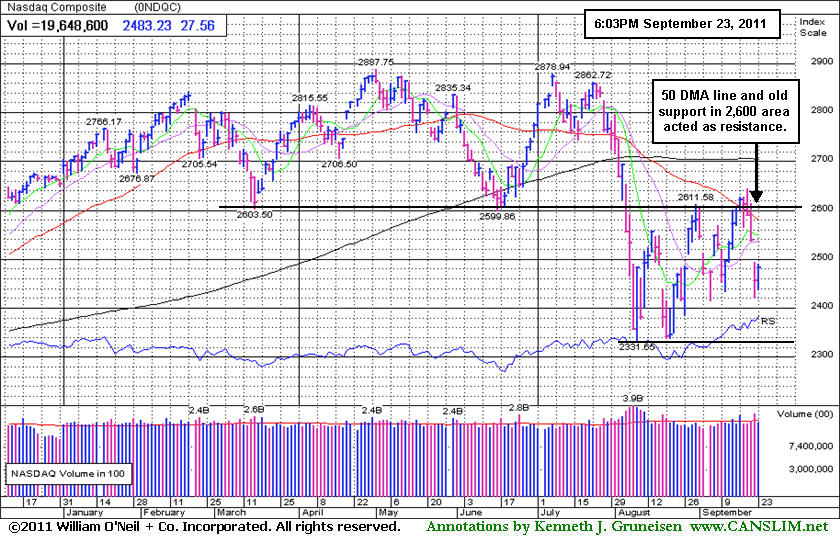
The market environment (M criteria) is clearly under pressure and back in a correction. The latest confirmed rally may, at best, be considered barely alive by the fact that the Nasdaq Composite Index and S&P 500 Index are still fighting to stay above their respective Day 1 (8/09/11) lows.
The September 2011 issue of CANSLIM.net News will be available soon. The Q3 2011 Webcast has also been scheduled for Wednesday, September 28th at 8PM EST. Links to all prior reports and webcasts are available on the Premium Member Homepage.
PICTURED: The Nasdaq Composite Index ran into resistance at its 50-day moving average (DMA) line and prior support in the 2,600 area.
|
 Kenneth J. Gruneisen started out as a licensed stockbroker in August 1987, a couple of months prior to the historic stock market crash that took the Dow Jones Industrial Average down -22.6% in a single day. He has published daily fact-based fundamental and technical analysis on high-ranked stocks online for two decades. Through FACTBASEDINVESTING.COM, Kenneth provides educational articles, news, market commentary, and other information regarding proven investment systems that work in good times and bad.
Comments contained in the body of this report are technical opinions only and are not necessarily those of Gruneisen Growth Corp. The material herein has been obtained from sources believed to be reliable and accurate, however, its accuracy and completeness cannot be guaranteed. Our firm, employees, and customers may effect transactions, including transactions contrary to any recommendation herein, or have positions in the securities mentioned herein or options with respect thereto. Any recommendation contained in this report may not be suitable for all investors and it is not to be deemed an offer or solicitation on our part with respect to the purchase or sale of any securities. |
|
 |
Financials Bounce From Lows While XAU Dives to Low
Kenneth J. Gruneisen - Passed the CAN SLIM® Master's Exam
The Broker/Dealer Index ($XBD +2.00%) and Bank Index ($BKX +1.60%) posted small gains and half-heartedly rose from their latest lows. The Retail Index ($RLX +1.41%) posted a small gain. The tech sector had a positive bias as the Semiconductor Index ($SOX +2.03%), Internet Index ($IIX +1.48%), Networking Index ($NWX +1.12%), and Biotechnology Index ($BTK +1.22%) finished with unanimous gains, and the Healthcare Index ($HMO +1.61%) rose. Falling energy prices were a factor as the Oil Services Index ($OSX -1.82%) and Integrated Oil Index ($XOI -0.47%) lost ground.
Charts courtesy www.stockcharts.com
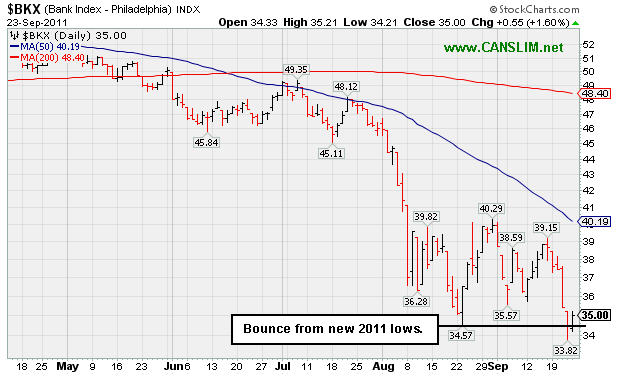
PICTURED 1: The Bank Index ($BKX +1.60%) posted small gain and half-heartedly rose from its latest low.
Charts courtesy www.stockcharts.com
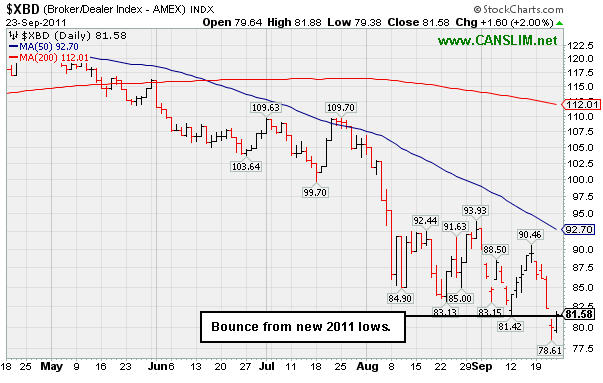
PICTURED 2: The Broker/Dealer Index ($XBD +2.00%) posted small gain and half-heartedly rose from its latest low.
Charts courtesy www.stockcharts.com
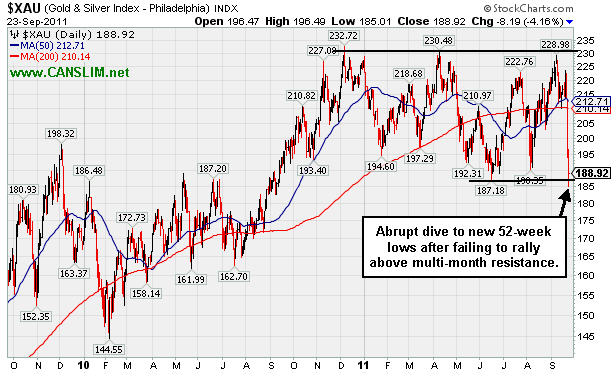
PICTURED 3: The Gold & Silver Index ($XAU -4.16%) slumped as gold sold off sharply. The price of the precious metal fell $89.90 to $1,649.50 an ounce. The XAU abruptly fell to a new 52-week low after failing to rally above multi-month resistance.
| Oil Services |
$OSX |
201.00 |
-3.72 |
-1.82% |
-18.00% |
| Healthcare |
$HMO |
1,932.84 |
+30.67 |
+1.61% |
+14.23% |
| Integrated Oil |
$XOI |
1,027.61 |
-4.83 |
-0.47% |
-15.29% |
| Semiconductor |
$SOX |
359.95 |
+7.17 |
+2.03% |
-12.60% |
| Networking |
$NWX |
219.37 |
+2.40 |
+1.11% |
-21.81% |
| Internet |
$IIX |
271.78 |
+3.97 |
+1.48% |
-11.68% |
| Broker/Dealer |
$XBD |
81.58 |
+1.60 |
+2.00% |
-32.86% |
| Retail |
$RLX |
506.08 |
+7.02 |
+1.41% |
-0.45% |
| Gold & Silver |
$XAU |
188.92 |
-8.19 |
-4.16% |
-16.62% |
| Bank |
$BKX |
35.00 |
+0.55 |
+1.60% |
-32.96% |
| Biotech |
$BTK |
1,142.72 |
+13.97 |
+1.24% |
-11.94% |
|
|
|
 |
Damaging Distributional Likely Triggered Loss Limiting Sell Rules
Kenneth J. Gruneisen - Passed the CAN SLIM® Master's Exam
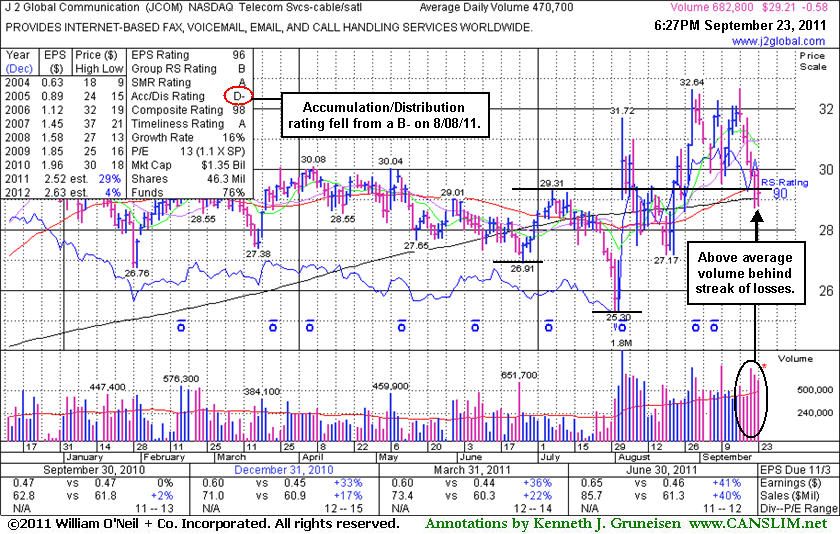
J 2 Global Communication (JCOM -$0.58 or -1.95% to $29.21) endured damaging distributional pressure this week. It slumped below previous highs in the $30-31 area while testing support near its closely coinciding 50-day and 200-day moving average (DMA) lines after above average volume was behind 6 consecutive losses since touching a new 52-week high. Disciplined investors always limit losses by following the investment system's rule of selling if a stock ever falls more than -7% from their buy point, so any recent buyers may already have been prompted to sell.
After its last appearance in this FSU section on 8/29/11 with an annotated graph under the headline, "Confirming Gain on +43% Above Average Volume", it powered higher to a new 52-week high with heavier volume backing its 8/30/11 gain. After triggering that confirming technical buy signal, it stalled. It has sputtered since its 8/03/11 gap up. The 3 latest quarterly comparisons through June '11 show sales revenues and earnings acceleration and the high-ranked Telecom Services - Cable/Satellite firm has a strong annual earnings history, satisfying the C and A criteria. One concern we have highlighted is the waning ownership by top-rated funds, falling from 421 in Mar '11 to 398 in June '11. Normally, increasing interest from top-rated funds is preferred with respect to the I criteria. Its Accumulation/Distribution rating of D- (see red circle) is down from a B- when it was shown in this FSU section on 8/08/11.
Higher trading in recent weeks created a batch of investors who own the stock at higher prices, termed "overhead supply", which is a source of resistance that might hinder its progress for the near term as those anxious sellers watch for an opportunity to unload shares. Meanwhile, the broader market (M criteria) also has flashed warning signs while slumping into the latest recognized market correction.
|
|
|
Color Codes Explained :
Y - Better candidates highlighted by our
staff of experts.
G - Previously featured
in past reports as yellow but may no longer be buyable under the
guidelines.
***Last / Change / Volume data in this table is the closing quote data***
Symbol/Exchange
Company Name
Industry Group |
PRICE |
CHANGE
(%Change) |
Day High |
Volume
(% DAV)
(% 50 day avg vol) |
52 Wk Hi
% From Hi |
Featured
Date |
Price
Featured |
Pivot Featured |
|
Max Buy |
AAPL
-
NASDAQ
Apple Inc
COMPUTER HARDWARE - Personal Computers
|
$404.30
|
+2.48
0.62% |
$406.74
|
19,509,810
86.04% of 50 DAV
50 DAV is 22,674,600
|
$422.86
-4.39%
|
9/16/2011
|
$399.14
|
PP = $404.60
|
|
MB = $424.83
|
Most Recent Note - 9/22/2011 12:30:52 PM
Y - Pulling back near its prior highs and pivot point amid widespread market weakness today. Recent rally to a new all-time high was not marked by very heavy volume. It is already heavily owned by the institutional crowd, and ownership by top-rated funds fell from 4,367 in Mar '11 to 4,345 in Jun '11.
>>> The latest Featured Stock Update with an annotated graph appeared on 9/19/2011. Click here.
View all notes |
Alert me of new notes |
CANSLIM.net Company Profile |
SEC |
Zacks Reports |
StockTalk |
News |
Chart |
Request a new note
C
A N
S L
I M


|
ALXN
-
NASDAQ
Alexion Pharmaceuticals
DRUGS - Drug Manufacturers - Other
|
$66.15
|
+2.78
4.39% |
$67.58
|
2,715,563
168.50% of 50 DAV
50 DAV is 1,611,600
|
$67.75
-2.36%
|
9/15/2011
|
$63.20
|
PP = $60.81
|
|
MB = $63.85
|
 Most Recent Note - 9/23/2011 12:23:16 PM
G - Considerable gain today with volume running at an above average pace while challenging its all-time high hit on Wednesday. Broader market weakness (M criteria) this week argues more strongly for protecting capital as opposed to taking on more exposure to equities. Prior resistance in the $59-60 area defines initial support to watch on pullbacks.
>>> The latest Featured Stock Update with an annotated graph appeared on 9/15/2011. Click here.
View all notes |
Alert me of new notes |
CANSLIM.net Company Profile |
SEC |
Zacks Reports |
StockTalk |
News |
Chart |
Request a new note
C
A N
S L
I M
|
ATHN
-
NASDAQ
Athenahealth Inc
DIVERSIFIED SERVICES - Business/Management Services
|
$63.65
|
+0.82
1.31% |
$64.35
|
719,938
86.67% of 50 DAV
50 DAV is 830,700
|
$72.70
-12.45%
|
9/8/2011
|
$61.93
|
PP = $61.78
|
|
MB = $64.87
|
Most Recent Note - 9/22/2011 9:48:36 AM
G - Gapped down today amid widespread market weakness, raising concerns. Abruptly pulling back to prior highs in the $61 area previously noted as initial support on pullbacks.
>>> The latest Featured Stock Update with an annotated graph appeared on 9/8/2011. Click here.
View all notes |
Alert me of new notes |
CANSLIM.net Company Profile |
SEC |
Zacks Reports |
StockTalk |
News |
Chart |
Request a new note
C
A N
S L
I M
|
CELG
-
NASDAQ
Celgene Corp
DRUGS - Drug Manufacturers - Major
|
$62.67
|
-0.87
-1.37% |
$63.75
|
4,827,876
115.65% of 50 DAV
50 DAV is 4,174,600
|
$65.86
-4.84%
|
9/16/2011
|
$61.21
|
PP = $62.59
|
|
MB = $65.72
|
Most Recent Note - 9/23/2011 12:29:48 PM
Y - On track for a 3rd consecutive loss today with volume running at an above average pace. Following its breakout on 9/20/11 it has abruptly pulled back near previously stubborn resistance in the $62 area which may act as a support level.
>>> The latest Featured Stock Update with an annotated graph appeared on 9/16/2011. Click here.
View all notes |
Alert me of new notes |
CANSLIM.net Company Profile |
SEC |
Zacks Reports |
StockTalk |
News |
Chart |
Request a new note
C
A N
S L
I M
|
CPA
-
NYSE
Copa Holdings Sa
TRANSPORTATION - Regional Airlines
|
$62.39
|
-0.88
-1.39% |
$62.98
|
567,459
190.87% of 50 DAV
50 DAV is 297,300
|
$72.86
-14.37%
|
9/21/2011
|
$69.67
|
PP = $72.86
|
|
MB = $76.50
|
Most Recent Note - 9/22/2011 9:53:40 AM
G - Gapped down today and violated its 50 DMA line raising concerns, and its color code is changed to green. Finished at the prior session low after a damaging loss with above average volume. While forming a high handle following a 10-week cup shaped base pattern it was highlighted in yellow in the 9/21/11 mid-day report with a pivot point based on its 9/14/11 high. It is normally best if the volume totals are light while a "handle" is formed, so the distributional loss it suffered may not bode well. Additionally, as it was noted earlier - "Confirming gains with heavy volume for a new high close are needed before disciplined investors might consider this high-ranked Panama-based airline a legitimate buy candidate. Found support above its 200 DMA line and prior highs in the $59 area during its recent consolidation. It is hovering near its 52-week high and within close striking distance of its 2007 all-time high ($73.33). Reported earnings +52% on +41% sales revenues for the quarter ended June 30, 2011 versus the year ago period. Sales revenues and earnings have improved in the 3 most recent quarterly comparisons (Dec '10, Mar and Jun '11) after a streak of negative or weak comparisons. Annual earnings (the A criteria) growth has been good, and increasing institutional ownership (the I criteria) is an encouraging sign.

There are no Featured Stock Updates™ available for this stock at this time. You may request one by clicking the Request a New Note link below
View all notes |
Alert me of new notes |
CANSLIM.net Company Profile |
SEC |
Zacks Reports |
StockTalk |
News |
Chart |
Request a new note
C
A N
S L
I M
|
Symbol/Exchange
Company Name
Industry Group |
PRICE |
CHANGE
(%Change) |
Day High |
Volume
(% DAV)
(% 50 day avg vol) |
52 Wk Hi
% From Hi |
Featured
Date |
Price
Featured |
Pivot Featured |
|
Max Buy |
DMND
-
NASDAQ
Diamond Foods Inc
FOOD and; BEVERAGE - Processed and; Packaged Goods
|
$90.37
|
-0.76
-0.83% |
$91.75
|
392,090
124.99% of 50 DAV
50 DAV is 313,700
|
$96.13
-5.99%
|
9/13/2011
|
$75.57
|
PP = $80.16
|
|
MB = $84.17
|
Most Recent Note - 9/22/2011 12:59:58 PM
G - Holding its ground near its all-time high today, extended from its latest sound base pattern. Prior highs in the $80 area define initial chart support to watch on pullbacks.
>>> The latest Featured Stock Update with an annotated graph appeared on 9/13/2011. Click here.
View all notes |
Alert me of new notes |
CANSLIM.net Company Profile |
SEC |
Zacks Reports |
StockTalk |
News |
Chart |
Request a new note
C
A N
S L
I M
|
EXLS
-
NASDAQ
Exlservice Holdings Inc
DIVERSIFIED SERVICES - Business/Management Services
|
$22.38
|
-0.02
-0.09% |
$22.80
|
169,838
83.58% of 50 DAV
50 DAV is 203,200
|
$26.55
-15.71%
|
8/2/2011
|
$24.85
|
PP = $24.85
|
|
MB = $26.09
|
Most Recent Note - 9/22/2011 4:17:09 PM
G - Testing support at its 200 DMA line today, failing to rebound following its damaging 9/13/11 gap down. Churned above average volume while posting 7 losses in the past 8 sessions. Priced its previously noted Secondary Offering at $23.00. A rebound above its 50 DMA line would help its outlook.
>>> The latest Featured Stock Update with an annotated graph appeared on 9/7/2011. Click here.
View all notes |
Alert me of new notes |
CANSLIM.net Company Profile |
SEC |
Zacks Reports |
StockTalk |
News |
Chart |
Request a new note
C
A N
S L
I M
|
FCFS
-
NASDAQ
First Cash Financial Svs
SPECIALTY RETAIL - Specialty Retail, Other
|
$44.46
|
-1.10
-2.41% |
$45.10
|
973,561
244.67% of 50 DAV
50 DAV is 397,900
|
$52.18
-14.79%
|
5/31/2011
|
$42.00
|
PP = $40.23
|
|
MB = $42.24
|
Most Recent Note - 9/23/2011 3:50:53 PM
Violated its 50 DMA line today with above average and ever-increasing volume behind its 4th consecutive loss, triggering a technical sell signal and raising concerns. It marked its all-time high on 9/20/11 with a negative reversal. Based on weakness it will be dropped from the Featured Stocks list tonight. A prompt rebound above its short-term average would help its outlook, however it needs time to form a sound base of sufficient length.
>>> The latest Featured Stock Update with an annotated graph appeared on 9/6/2011. Click here.
View all notes |
Alert me of new notes |
CANSLIM.net Company Profile |
SEC |
Zacks Reports |
StockTalk |
News |
Chart |
Request a new note
C
A N
S L
I M
|
JAZZ
-
NASDAQ
Jazz Pharmaceuticals Inc
DRUGS - Biotechnology
|
$43.50
|
-0.46
-1.05% |
$44.51
|
665,416
69.21% of 50 DAV
50 DAV is 961,500
|
$47.88
-9.15%
|
9/20/2011
|
$46.56
|
PP = $44.63
|
|
MB = $46.86
|
Most Recent Note - 9/22/2011 9:56:23 AM
Y - Gapped down today amid widespread market weakness. Its 50 DMA line defines important chart support to watch. See the latest FSU analysis for more details and an annotated weekly graph.
>>> The latest Featured Stock Update with an annotated graph appeared on 9/20/2011. Click here.
View all notes |
Alert me of new notes |
CANSLIM.net Company Profile |
SEC |
Zacks Reports |
StockTalk |
News |
Chart |
Request a new note
C
A N
S L
I M
|
JCOM
-
NASDAQ
J 2 Global Communication
INTERNET - Internet Software and Services
|
$29.21
|
-0.58
-1.95% |
$30.04
|
689,990
146.59% of 50 DAV
50 DAV is 470,700
|
$32.67
-10.60%
|
8/8/2011
|
$30.38
|
PP = $29.31
|
|
MB = $30.78
|
Most Recent Note - 9/23/2011 6:48:23 PM
G - Suffered a 6th consecutive damaging loss today. Testing support near its closely coinciding 50 and 200 DMA lines. See latest FSU analysis for more details and a new annotated graph.
>>> The latest Featured Stock Update with an annotated graph appeared on 9/23/2011. Click here.
View all notes |
Alert me of new notes |
CANSLIM.net Company Profile |
SEC |
Zacks Reports |
StockTalk |
News |
Chart |
Request a new note
C
A N
S L
I M
|
Symbol/Exchange
Company Name
Industry Group |
PRICE |
CHANGE
(%Change) |
Day High |
Volume
(% DAV)
(% 50 day avg vol) |
52 Wk Hi
% From Hi |
Featured
Date |
Price
Featured |
Pivot Featured |
|
Max Buy |
MA
-
NYSE
Mastercard Inc Cl A
DIVERSIFIED SERVICES - Business/Management Services
|
$337.03
|
+6.07
1.83% |
$338.14
|
1,294,044
81.43% of 50 DAV
50 DAV is 1,589,100
|
$361.94
-6.88%
|
8/3/2011
|
$324.82
|
PP = $322.38
|
|
MB = $338.50
|
Most Recent Note - 9/22/2011 4:06:29 PM
G - Gapped down today, retreating from an all-time high hit earlier this week. It slumped under prior chart highs in the $340 area raising concerns while sinking near its 50 DMA line.
>>> The latest Featured Stock Update with an annotated graph appeared on 9/12/2011. Click here.
View all notes |
Alert me of new notes |
CANSLIM.net Company Profile |
SEC |
Zacks Reports |
StockTalk |
News |
Chart |
Request a new note
C
A N
S L
I M
|
MG
-
NYSE
Mistras Group Inc
DIVERSIFIED SERVICES - Bulding and Faci;ity Management Services
|
$18.98
|
+0.05
0.26% |
$19.37
|
302,258
161.64% of 50 DAV
50 DAV is 187,000
|
$20.82
-8.84%
|
8/10/2011
|
$17.89
|
PP = $17.58
|
|
MB = $18.46
|
Most Recent Note - 9/22/2011 3:44:30 PM
G - Rebounded into positive territory and back above its 50 DMA line with a positive reversal today against a widely negative market backdrop. Prior highs in the $18 area and its 50 DMA line were previously noted as important chart support to watch on pullbacks.
>>> The latest Featured Stock Update with an annotated graph appeared on 9/9/2011. Click here.
View all notes |
Alert me of new notes |
CANSLIM.net Company Profile |
SEC |
Zacks Reports |
StockTalk |
News |
Chart |
Request a new note
C
A N
S L
I M
|
MKTX
-
NASDAQ
Marketaxess Holdings Inc
FINANCIAL SERVICES - Investment Brokerage - Nationa
|
$27.11
|
+0.18
0.67% |
$27.44
|
185,469
64.00% of 50 DAV
50 DAV is 289,800
|
$30.95
-12.40%
|
7/29/2011
|
$25.87
|
PP = $26.35
|
|
MB = $27.67
|
Most Recent Note - 9/22/2011 3:40:24 PM
G - Rebounding near its 50 DMA line today with a gain on higher volume, bucking a widely negative market. Testing support at prior highs in the $26 area. It gapped down on 9/16/11 following news of a small Secondary Offering of 950,000 shares priced at $28.65.
>>> The latest Featured Stock Update with an annotated graph appeared on 9/2/2011. Click here.
View all notes |
Alert me of new notes |
CANSLIM.net Company Profile |
SEC |
Zacks Reports |
StockTalk |
News |
Chart |
Request a new note
C
A N
S L
I M
|
PCLN
-
NASDAQ
Priceline.Com Inc
INTERNET - Internet Software and Services
|
$514.61
|
+9.04
1.79% |
$517.61
|
1,342,718
99.13% of 50 DAV
50 DAV is 1,354,500
|
$561.88
-8.41%
|
9/20/2011
|
$539.46
|
PP = $552.25
|
|
MB = $579.86
|
Most Recent Note - 9/22/2011 10:06:55 AM
Y - Gapped down today amid widespread market weakness, violating its 50 DMA line and raising concerns while trading near recent lows. It finished just below the mid-point of the session's range after highlighted in the 9/20/11 mid-day report (read here) in yellow with pivot point cited based on its 7/08/11 high plus 10 cents. A volume-driven gain did not yet trigger a proper technical buy signal. PCLN rebounded after a brief violation of its 200 DMA line during its choppy consolidation since it was dropped from the Featured Stocks list on 8/18/11.
>>> The latest Featured Stock Update with an annotated graph appeared on 9/22/2011. Click here.
View all notes |
Alert me of new notes |
CANSLIM.net Company Profile |
SEC |
Zacks Reports |
StockTalk |
News |
Chart |
Request a new note
C
A N
S L
I M
|
PSMT
-
NASDAQ
Pricesmart Inc
RETAIL - Drug Stores
|
$68.28
|
-0.79
-1.14% |
$69.86
|
469,107
157.21% of 50 DAV
50 DAV is 298,400
|
$75.16
-9.15%
|
8/30/2011
|
$63.01
|
PP = $62.37
|
|
MB = $65.49
|
Most Recent Note - 9/22/2011 4:09:03 PM
G - Today's 3rd consecutive loss came with near average volume. It is extended from its prior base. Prior highs and its 50 DMA line define support levels to watch on pullbacks.
>>> The latest Featured Stock Update with an annotated graph appeared on 9/14/2011. Click here.
View all notes |
Alert me of new notes |
CANSLIM.net Company Profile |
SEC |
Zacks Reports |
StockTalk |
News |
Chart |
Request a new note
C
A N
S L
I M
|
Symbol/Exchange
Company Name
Industry Group |
PRICE |
CHANGE
(%Change) |
Day High |
Volume
(% DAV)
(% 50 day avg vol) |
52 Wk Hi
% From Hi |
Featured
Date |
Price
Featured |
Pivot Featured |
|
Max Buy |
V
-
NYSE
Visa Inc Cl A
DIVERSIFIED SERVICES - Business/Management Services
|
$90.08
|
+1.78
2.02% |
$90.93
|
5,381,447
89.20% of 50 DAV
50 DAV is 6,033,100
|
$94.75
-4.93%
|
9/20/2011
|
$93.91
|
PP = $90.93
|
|
MB = $95.48
|
Most Recent Note - 9/22/2011 1:20:12 PM
Y - Up from earlier lows after a gap down today amid widespread market weakness. It raised concerns by abruptly diving back into its prior base and testing support at its 50 DMA line. See the latest FSU analysis for more details and an annotated daily graph.
>>> The latest Featured Stock Update with an annotated graph appeared on 9/21/2011. Click here.
View all notes |
Alert me of new notes |
CANSLIM.net Company Profile |
SEC |
Zacks Reports |
StockTalk |
News |
Chart |
Request a new note
C
A N
S L
I M
|
|
|
|
THESE ARE NOT BUY RECOMMENDATIONS!
Comments contained in the body of this report are technical
opinions only. The material herein has been obtained
from sources believed to be reliable and accurate, however,
its accuracy and completeness cannot be guaranteed.
This site is not an investment advisor, hence it does
not endorse or recommend any securities or other investments.
Any recommendation contained in this report may not
be suitable for all investors and it is not to be deemed
an offer or solicitation on our part with respect to
the purchase or sale of any securities. All trademarks,
service marks and trade names appearing in this report
are the property of their respective owners, and are
likewise used for identification purposes only.
This report is a service available
only to active Paid Premium Members.
You may opt-out of receiving report notifications
at any time. Questions or comments may be submitted
by writing to Premium Membership Services 665 S.E. 10 Street, Suite 201 Deerfield Beach, FL 33441-5634 or by calling 1-800-965-8307
or 954-785-1121.
|
|
|

