***Last / Change / Volume data in this table is the closing quote data***
Symbol/Exchange
Company Name
Industry Group |
PRICE |
CHANGE
(%Change) |
Day High |
Volume
(% DAV)
(% 50 day avg vol) |
52 Wk Hi
% From Hi |
Featured
Date |
Price
Featured |
Pivot Featured |
|
Max Buy |
ABV
-
NYSE
Comp De Bebidas Adr
FOOD and BEVERAGE - Beverages - Brewers
|
$120.51
|
-0.23
-0.19% |
$122.38
|
417,590
68.58% of 50 DAV
50 DAV is 608,900
|
$122.49
-1.62%
|
6/29/2010
|
$104.74
|
PP = $109.33
|
|
MB = $114.80
|
Most Recent Note - 9/17/2010 4:19:00 PM
G - This Brazil-based beverage firm hit another new all-time high today. Extended from a sound base, its prior highs in the $111-112 area define support above its 50 DMA line.
>>> The latest Featured Stock Update with an annotated graph appeared on 8/18/2010. Click here.
View all notes |
Alert me of new notes |
CANSLIM.net Company Profile |
SEC |
Zacks Reports |
StockTalk |
News |
Chart |
Request a new note
C
A N
S L
I M


|
ARUN
-
NASDAQ
Aruba Networks Inc
COMPUTER HARDWARE - Networking andamp; Communication Dev
|
$21.07
|
+0.22
1.06% |
$21.61
|
2,129,872
106.16% of 50 DAV
50 DAV is 2,006,200
|
$22.18
-5.00%
|
8/30/2010
|
$18.12
|
PP = $18.51
|
|
MB = $19.44
|
Most Recent Note - 9/22/2010 2:29:32 PM
G - Considerable loss today, erasing the prior session's big volume-driven gain. Extended from its latest base. Prior highs near $18 define a chart support level to watch.
>>> The latest Featured Stock Update with an annotated graph appeared on 9/2/2010. Click here.
View all notes |
Alert me of new notes |
CANSLIM.net Company Profile |
SEC |
Zacks Reports |
StockTalk |
News |
Chart |
Request a new note
C
A N
S L
I M
|
ASPS
-
NASDAQ
Altisource Ptf Sltns Sa
REAL ESTATE - Property Management/Developmen
|
$29.43
|
+1.77
6.40% |
$29.49
|
408,046
369.61% of 50 DAV
50 DAV is 110,400
|
$28.83
2.08%
|
9/23/2010
|
$28.36
|
PP = $28.90
|
|
MB = $30.35
|
 Most Recent Note - 9/23/2010 5:41:53 PM
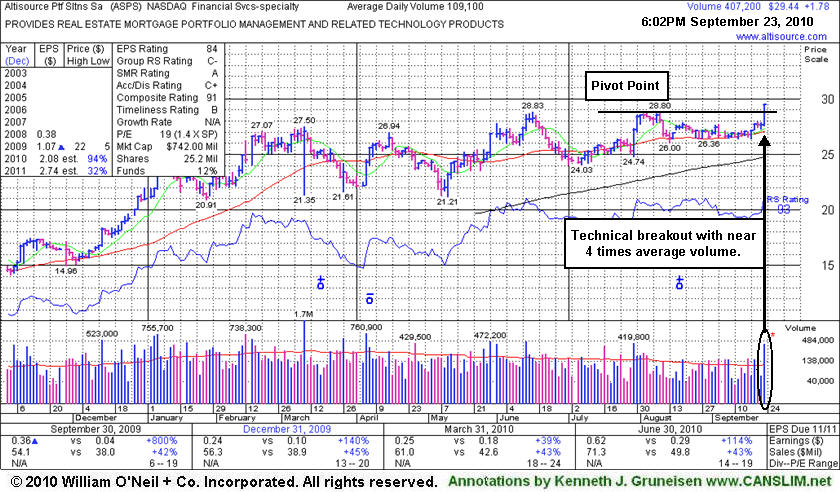
Y - Triggered a technical buy signal today with a considerable gain on nearly 4 times average volume. No overhead supply remains as this Luxembourg-based Financial Services firm spiked to a new 52-week high after it was featured in yellow in the mid-day report (read here) while building on an orderly 9-week flat base above its 50 DMA line. Its Sep '09 quarter and FY '09 earnings results have blue triangles beside the earnings figure on the graph service used by our experts indicating that pre-tax, non-recurring items were included (where possible, such items are normally removed to provide data better suited for comparison). The number of top-rated funds owning its shares fell from 47 in Sep '09 to 35 in Jun '10. It did not make significant progress since noted in February 2010 mid-day reports -"Annual earnings (A criteria) history has been up and down and needs additional review."
>>> The latest Featured Stock Update with an annotated graph appeared on 9/23/2010. Click here.
View all notes |
Alert me of new notes |
CANSLIM.net Company Profile |
SEC |
Zacks Reports |
StockTalk |
News |
Chart |
Request a new note
C
A N
S L
I M
|
BIDU
-
NASDAQ
Baidu Inc Ads
INTERNET - Internet Information Providers
|
$95.03
|
+3.22
3.51% |
$95.16
|
14,873,733
157.79% of 50 DAV
50 DAV is 9,426,300
|
$92.31
2.95%
|
9/17/2010
|
$85.73
|
PP = $88.42
|
|
MB = $92.84
|
Most Recent Note - 9/23/2010 4:39:06 PM
G - Up again today with a considerable gain on +57% above average volume lifting it above its "max buy" level. Color code is changed to green as it gets extended from prior highs by more than +5%.
>>> The latest Featured Stock Update with an annotated graph appeared on 8/13/2010. Click here.
View all notes |
Alert me of new notes |
CANSLIM.net Company Profile |
SEC |
Zacks Reports |
StockTalk |
News |
Chart |
Request a new note
C
A N
S L
I M
|
CACC
-
NASDAQ
Credit Acceptance Corp
FINANCIAL SERVICES - Credit Services
|
$60.36
|
-0.53
-0.87% |
$62.15
|
13,998
30.10% of 50 DAV
50 DAV is 46,500
|
$63.45
-4.87%
|
7/29/2010
|
$52.04
|
PP = $54.07
|
|
MB = $56.77
|
Most Recent Note - 9/21/2010 4:47:15 PM
G - Loss on light volume today, finishing under its old high closes and slumping back into the previous short (4-week) flat base. An upward trendline defines support above its 50 DMA line and its recent chart low ($56.06).
>>> The latest Featured Stock Update with an annotated graph appeared on 8/2/2010. Click here.
View all notes |
Alert me of new notes |
CANSLIM.net Company Profile |
SEC |
Zacks Reports |
StockTalk |
News |
Chart |
Request a new note
C
A N
S L
I M
|
Symbol/Exchange
Company Name
Industry Group |
PRICE |
CHANGE
(%Change) |
Day High |
Volume
(% DAV)
(% 50 day avg vol) |
52 Wk Hi
% From Hi |
Featured
Date |
Price
Featured |
Pivot Featured |
|
Max Buy |
CMG
-
NYSE
Chipotle Mexican Grill
LEISURE - Restaurants
|
$166.66
|
+0.92
0.56% |
$168.25
|
483,708
68.21% of 50 DAV
50 DAV is 709,100
|
$171.46
-2.80%
|
9/1/2010
|
$158.31
|
PP = $155.52
|
|
MB = $163.30
|
Most Recent Note - 9/20/2010 5:42:20 PM
G - Gain today with below average volume for a new all-time high. Extended from prior highs in the $155 area that define chart support.
>>> The latest Featured Stock Update with an annotated graph appeared on 9/1/2010. Click here.
View all notes |
Alert me of new notes |
CANSLIM.net Company Profile |
SEC |
Zacks Reports |
StockTalk |
News |
Chart |
Request a new note
C
A N
S L
I M
|
CRM
-
NYSE
Salesforce.Com Inc
INTERNET - Internet Software and Services
|
$117.49
|
-1.20
-1.01% |
$119.44
|
2,020,411
75.60% of 50 DAV
50 DAV is 2,672,500
|
$123.77
-5.07%
|
6/2/2010
|
$88.44
|
PP = $89.60
|
|
MB = $94.08
|
Most Recent Note - 9/22/2010 2:51:31 PM
G - Pulling back on lighter volume after its 9/20/10 gain with +54% above average volume helped it rally from an advanced "3-weeks tight" type pattern to a new all-time high.
>>> The latest Featured Stock Update with an annotated graph appeared on 8/16/2010. Click here.
View all notes |
Alert me of new notes |
CANSLIM.net Company Profile |
SEC |
Zacks Reports |
StockTalk |
News |
Chart |
Request a new note
C
A N
S L
I M
|
EBIX
-
NASDAQ
Ebix Inc
COMPUTER SOFTWARE and SERVICES - Business Software and Services
|
$21.64
|
+0.79
3.79% |
$21.94
|
850,632
193.99% of 50 DAV
50 DAV is 438,500
|
$22.62
-4.34%
|
9/23/2010
|
$21.78
|
PP = $22.74
|
|
MB = $23.88
|
Most Recent Note - 9/23/2010 12:32:16 PM
Y - Recent quarterly sales revenues and earnings increases have been strong. Color code is changed to yellow, while it may encounter resistance near its old high and form a handle after its recent rally. It has formed a large cup shaped pattern in the past year, maintaining strong fundamentals since it was dropped from the Featured Stocks list on 11/05/09.
>>> The latest Featured Stock Update with an annotated graph appeared on 11/2/2009. Click here.
View all notes |
Alert me of new notes |
CANSLIM.net Company Profile |
SEC |
Zacks Reports |
StockTalk |
News |
Chart |
Request a new note
C
A N
S L
I M
|
EGO
-
NYSE
Eldorado Gold Corp
METALS and MINING - Gold
|
$18.70
|
-0.25
-1.32% |
$18.94
|
4,717,763
109.81% of 50 DAV
50 DAV is 4,296,200
|
$20.23
-7.56%
|
8/19/2010
|
$18.25
|
PP = $19.17
|
|
MB = $20.13
|
Most Recent Note - 9/22/2010 6:25:16 PM
Y - Gain today halted its slide after 3 consecutive losses with above average volume. It encountered heavy distributional pressure, pulling back under its pivot point near prior highs in the $18-19 area.
>>> The latest Featured Stock Update with an annotated graph appeared on 8/19/2010. Click here.
View all notes |
Alert me of new notes |
CANSLIM.net Company Profile |
SEC |
Zacks Reports |
StockTalk |
News |
Chart |
Request a new note
C
A N
S L
I M
|
FFIV
-
NASDAQ
F 5 Networks Inc
INTERNET - Internet Software and Services
|
$102.49
|
+2.00
1.99% |
$104.09
|
1,672,723
99.88% of 50 DAV
50 DAV is 1,674,700
|
$105.20
-2.58%
|
6/16/2010
|
$74.50
|
PP = $74.10
|
|
MB = $77.81
|
Most Recent Note - 9/22/2010 2:34:51 PM
G - Pulling back on lighter volume after starting the week with a gain for a new all-time high with volume slightly above average. A steep upward trendline connecting July-August lows defines an initial chart support level well above its 50 DMA line.
>>> The latest Featured Stock Update with an annotated graph appeared on 9/13/2010. Click here.
View all notes |
Alert me of new notes |
CANSLIM.net Company Profile |
SEC |
Zacks Reports |
StockTalk |
News |
Chart |
Request a new note
C
A N
S L
I M
|
Symbol/Exchange
Company Name
Industry Group |
PRICE |
CHANGE
(%Change) |
Day High |
Volume
(% DAV)
(% 50 day avg vol) |
52 Wk Hi
% From Hi |
Featured
Date |
Price
Featured |
Pivot Featured |
|
Max Buy |
FOSL
-
NASDAQ
Fossil Inc
CONSUMER DURABLES - Recreational Goods, Other
|
$51.24
|
-0.07
-0.14% |
$52.03
|
565,197
73.78% of 50 DAV
50 DAV is 766,100
|
$52.64
-2.66%
|
8/10/2010
|
$45.54
|
PP = $42.69
|
|
MB = $44.82
|
Most Recent Note - 9/20/2010 2:28:10 PM
G - Gain today with below average volume for another new all-time high. Extended from any sound base after a recent streak of gains, its prior high in the $46 area defines support to watch.
>>> The latest Featured Stock Update with an annotated graph appeared on 8/11/2010. Click here.
View all notes |
Alert me of new notes |
CANSLIM.net Company Profile |
SEC |
Zacks Reports |
StockTalk |
News |
Chart |
Request a new note
C
A N
S L
I M
|
GMCR
-
NASDAQ
Green Mtn Coffee Roastrs
FOOD and BEVERAGE - Processed and Packaged Goods
|
$35.78
|
-0.03
-0.08% |
$36.25
|
1,721,453
68.38% of 50 DAV
50 DAV is 2,517,500
|
$37.32
-4.13%
|
8/17/2010
|
$33.62
|
PP = $33.30
|
|
MB = $34.97
|
Most Recent Note - 9/22/2010 2:37:55 PM
G - Loss today with lighter volume erased the prior session's big volume-driven gain. Prior highs in the $33 area define support to watch.
>>> The latest Featured Stock Update with an annotated graph appeared on 8/17/2010. Click here.
View all notes |
Alert me of new notes |
CANSLIM.net Company Profile |
SEC |
Zacks Reports |
StockTalk |
News |
Chart |
Request a new note
C
A N
S L
I M
|
HS
-
NYSE
Healthspring Inc
HEALTH SERVICES - Health Care Plans
|
$24.91
|
+0.39
1.59% |
$25.33
|
1,327,129
195.22% of 50 DAV
50 DAV is 679,800
|
$24.65
1.06%
|
8/27/2010
|
$19.91
|
PP = $19.75
|
|
MB = $20.74
|
Most Recent Note - 9/23/2010 12:45:12 PM
G - Hit another new 52-week high and matched its 2007 all-time high ($25.33) today. Support to watch is prior chart highs in the $19-20 area. Disciplined investors do not chase stocks that are extended from a sound base.
>>> The latest Featured Stock Update with an annotated graph appeared on 8/27/2010. Click here.
View all notes |
Alert me of new notes |
CANSLIM.net Company Profile |
SEC |
Zacks Reports |
StockTalk |
News |
Chart |
Request a new note
C
A N
S L
I M
|
IGTE
-
NASDAQ
Igate Corp
COMPUTER SOFTWARE and SERVICES - Information Technology Service
|
$17.63
|
-0.86
-4.65% |
$18.63
|
542,977
122.79% of 50 DAV
50 DAV is 442,200
|
$19.45
-9.36%
|
9/8/2010
|
$17.29
|
PP = $18.26
|
|
MB = $19.17
|
Most Recent Note - 9/23/2010 4:25:18 PM
Y - Loss today on higher volume is a sign of more distributional pressure, and it slumped below its pivot point again. Its 2 recent gains with above average volume were a sign of prompt support at its 50 DMA line and solid new buying demand as it followed-through to new highs, reconfirming its prior breakout.
>>> The latest Featured Stock Update with an annotated graph appeared on 9/10/2010. Click here.
View all notes |
Alert me of new notes |
CANSLIM.net Company Profile |
SEC |
Zacks Reports |
StockTalk |
News |
Chart |
Request a new note
C
A N
S L
I M
|
JOBS
-
NASDAQ
Fifty One Job Inc Ads
DIVERSIFIED SERVICES - Staffing and; Outsourcing Service
|
$37.48
|
+1.06
2.91% |
$38.40
|
236,000
184.95% of 50 DAV
50 DAV is 127,600
|
$37.60
-0.32%
|
9/16/2010
|
$31.59
|
PP = $30.40
|
|
MB = $31.92
|
Most Recent Note - 9/23/2010 4:49:21 PM
G - Gain today with nearly 2 times average volume for another new 52-week high. Very extended from a sound base, its prior highs in the $30 area define chart support now.
>>> The latest Featured Stock Update with an annotated graph appeared on 9/16/2010. Click here.
View all notes |
Alert me of new notes |
CANSLIM.net Company Profile |
SEC |
Zacks Reports |
StockTalk |
News |
Chart |
Request a new note
C
A N
S L
I M
|
Symbol/Exchange
Company Name
Industry Group |
PRICE |
CHANGE
(%Change) |
Day High |
Volume
(% DAV)
(% 50 day avg vol) |
52 Wk Hi
% From Hi |
Featured
Date |
Price
Featured |
Pivot Featured |
|
Max Buy |
MELI
-
NASDAQ
Mercadolibre Inc
INTERNET - Internet Software and; Services
|
$70.93
|
-0.82
-1.14% |
$71.97
|
458,020
55.14% of 50 DAV
50 DAV is 830,700
|
$74.78
-5.15%
|
5/13/2010
|
$54.21
|
PP = $55.85
|
|
MB = $58.64
|
Most Recent Note - 9/17/2010 10:18:51 AM
G - Gapped down today. In recent weeks it wedged to new high ground with light volume behind gains as it got extended from a sound base. Its 50 DMA line defines important chart support.
>>> The latest Featured Stock Update with an annotated graph appeared on 8/26/2010. Click here.
View all notes |
Alert me of new notes |
CANSLIM.net Company Profile |
SEC |
Zacks Reports |
StockTalk |
News |
Chart |
Request a new note
C
A N
S L
I M
|
MRX
-
NYSE
Medicis Pharmaceut Cl A
DRUGS - Biotechnology
|
$29.47
|
-0.13
-0.44% |
$30.02
|
956,795
78.41% of 50 DAV
50 DAV is 1,220,200
|
$30.29
-2.71%
|
8/12/2010
|
$26.88
|
PP = $26.71
|
|
MB = $28.05
|
Most Recent Note - 9/22/2010 6:21:12 PM
G - Loss on light volume today after a gain with above average volume on the prior session for a new 2010 high. Prior highs in the $28 area define the initial chart support level to watch.
>>> The latest Featured Stock Update with an annotated graph appeared on 8/12/2010. Click here.
View all notes |
Alert me of new notes |
CANSLIM.net Company Profile |
SEC |
Zacks Reports |
StockTalk |
News |
Chart |
Request a new note
C
A N
S L
I M
|
MWIV
-
NASDAQ
M W I Veterinary Supply
HEALTH SERVICES - Medical Instruments and; Supplies
|
$55.60
|
-1.62
-2.83% |
$57.60
|
31,341
41.73% of 50 DAV
50 DAV is 75,100
|
$57.99
-4.12%
|
7/29/2010
|
$52.05
|
PP = $52.09
|
|
MB = $54.69
|
Most Recent Note - 9/23/2010 4:29:48 PM
G - Pulling back on light volume after getting extended with gains on higher volume. Its 50 DMA line defines important chart support.
>>> The latest Featured Stock Update with an annotated graph appeared on 9/7/2010. Click here.
View all notes |
Alert me of new notes |
CANSLIM.net Company Profile |
SEC |
Zacks Reports |
StockTalk |
News |
Chart |
Request a new note
C
A N
S L
I M
|
NEM
-
NYSE
Newmont Mining Corp
METALS and MINING - Gold
|
$63.85
|
-1.09
-1.68% |
$65.25
|
5,896,213
93.31% of 50 DAV
50 DAV is 6,318,700
|
$65.50
-2.52%
|
8/31/2010
|
$61.32
|
PP = $63.48
|
|
MB = $66.65
|
Most Recent Note - 9/22/2010 1:18:26 PM
Y - Gapped up and hit a new all-time high today. A positive reversal and strong close on the prior session helped it rally above its pivot point for a gain with +48% above average volume. Technically the breakout was near the minimum volume guideline for a proper buy signal. No overhead supply remains to hinder its progress. Leadership in the Mining - Gold/Silver/Gems group (L criteria) is a nice reassurance.
>>> The latest Featured Stock Update with an annotated graph appeared on 9/14/2010. Click here.
View all notes |
Alert me of new notes |
CANSLIM.net Company Profile |
SEC |
Zacks Reports |
StockTalk |
News |
Chart |
Request a new note
C
A N
S L
I M
|
NEOG
-
NASDAQ
Neogen Corp
DRUGS - Diagnostic Substances
|
$32.25
|
-0.15
-0.46% |
$33.65
|
201,622
201.02% of 50 DAV
50 DAV is 100,300
|
$32.95
-2.12%
|
9/1/2010
|
$30.79
|
PP = $30.49
|
|
MB = $32.01
|
Most Recent Note - 9/23/2010 12:57:12 PM
G- Gapped up today and hit a new 52-week high, getting more extended from a sound base. For the period ended Aug 31, 2010 it reported earnings +32% while a +33% sales revenues increase was a sign of acceleration and strong growth versus the year ago period. Prior highs in the $30 area define initial support to watch.
>>> The latest Featured Stock Update with an annotated graph appeared on 8/20/2010. Click here.
View all notes |
Alert me of new notes |
CANSLIM.net Company Profile |
SEC |
Zacks Reports |
StockTalk |
News |
Chart |
Request a new note
C
A N
S L
I M
|
Symbol/Exchange
Company Name
Industry Group |
PRICE |
CHANGE
(%Change) |
Day High |
Volume
(% DAV)
(% 50 day avg vol) |
52 Wk Hi
% From Hi |
Featured
Date |
Price
Featured |
Pivot Featured |
|
Max Buy |
NFLX
-
NASDAQ
Netflix Inc
SPECIALTY RETAIL - Music and Video Stores
|
$160.47
|
+3.54
2.26% |
$163.72
|
11,706,962
239.46% of 50 DAV
50 DAV is 4,888,800
|
$156.97
2.23%
|
8/10/2010
|
$124.05
|
PP = $124.00
|
|
MB = $130.20
|
Most Recent Note - 9/23/2010 12:58:04 PM
G - Gapped up today, hitting new all-time highs, getting more extended from a sound base. Prior highs define important support to watch along with an upward trendline that comes into play well above its 50 DMA line.
>>> The latest Featured Stock Update with an annotated graph appeared on 8/10/2010. Click here.
View all notes |
Alert me of new notes |
CANSLIM.net Company Profile |
SEC |
Zacks Reports |
StockTalk |
News |
Chart |
Request a new note
C
A N
S L
I M
|
NTAP
-
NASDAQ
Netapp Inc
COMPUTER HARDWARE - Data Storage Devices
|
$48.29
|
-0.16
-0.33% |
$48.90
|
7,209,669
92.23% of 50 DAV
50 DAV is 7,817,300
|
$49.87
-3.17%
|
9/8/2010
|
$46.98
|
PP = $44.99
|
|
MB = $47.24
|
Most Recent Note - 9/21/2010 4:49:19 PM
G - Loss today with above average volume, a sign of distribution. Extended from a sound base, support to watch is at prior chart highs near its latest pivot point.
>>> The latest Featured Stock Update with an annotated graph appeared on 9/8/2010. Click here.
View all notes |
Alert me of new notes |
CANSLIM.net Company Profile |
SEC |
Zacks Reports |
StockTalk |
News |
Chart |
Request a new note
C
A N
S L
I M
|
ORCL
-
NASDAQ
Oracle Corp
COMPUTER SOFTWARE and SERVICES - Application Software
|
$27.12
|
-0.08
-0.29% |
$27.49
|
33,113,853
96.23% of 50 DAV
50 DAV is 34,412,000
|
$27.57
-1.63%
|
9/20/2010
|
$27.32
|
PP = $26.73
|
|
MB = $28.07
|
Most Recent Note - 9/22/2010 1:26:11 PM
Y - Rising today after slumping near its pivot point. A "breakaway gap" on 9/17/10 was backed by 5 times average volume, and it was featured in yellow in the 9/20/10 mid-day report.. It has maintained a strong annual earnings (A criteria) history and sales revenues and earnings increases have shown impressive acceleration in its recent quarterly comparisons. Large supply of 5.03 billion shares outstanding makes it an unlikely sprinter.
>>> The latest Featured Stock Update with an annotated graph appeared on 9/20/2010. Click here.
View all notes |
Alert me of new notes |
CANSLIM.net Company Profile |
SEC |
Zacks Reports |
StockTalk |
News |
Chart |
Request a new note
C
A N
S L
I M
|
PAY
-
NYSE
Verifone Systems Inc
COMPUTER HARDWARE - Transaction Automation Systems
|
$27.73
|
-0.46
-1.63% |
$28.62
|
1,280,082
96.06% of 50 DAV
50 DAV is 1,332,600
|
$29.54
-6.14%
|
8/25/2010
|
$24.30
|
PP = $23.74
|
|
MB = $24.93
|
Most Recent Note - 9/21/2010 4:50:41 PM
G - Pulling back with average volume today. Very extended from a sound base, its prior highs in the $23 area define chart support.
>>> The latest Featured Stock Update with an annotated graph appeared on 8/30/2010. Click here.
View all notes |
Alert me of new notes |
CANSLIM.net Company Profile |
SEC |
Zacks Reports |
StockTalk |
News |
Chart |
Request a new note
C
A N
S L
I M
|
PRGO
-
NASDAQ
Perrigo Co
DRUGS - Drug Related Products
|
$64.23
|
-0.29
-0.45% |
$64.86
|
641,767
60.92% of 50 DAV
50 DAV is 1,053,500
|
$64.69
-0.71%
|
9/15/2010
|
$63.73
|
PP = $64.76
|
|
MB = $68.00
|
Most Recent Note - 9/20/2010 5:45:34 PM
Y - Gain today with light volume, closing -3.5% off its 52-week high. Distributional pressure was noted last week after, technically, it did not trigger a proper technical buy signal.
>>> The latest Featured Stock Update with an annotated graph appeared on 9/15/2010. Click here.
View all notes |
Alert me of new notes |
CANSLIM.net Company Profile |
SEC |
Zacks Reports |
StockTalk |
News |
Chart |
Request a new note
C
A N
S L
I M
|
Symbol/Exchange
Company Name
Industry Group |
PRICE |
CHANGE
(%Change) |
Day High |
Volume
(% DAV)
(% 50 day avg vol) |
52 Wk Hi
% From Hi |
Featured
Date |
Price
Featured |
Pivot Featured |
|
Max Buy |
RAX
-
NYSE
Rackspace Hosting Inc
INTERNET - Internet Software and; Services
|
$23.13
|
+0.15
0.65% |
$23.86
|
1,593,721
87.82% of 50 DAV
50 DAV is 1,814,800
|
$23.51
-1.62%
|
9/21/2010
|
$22.84
|
PP = $23.61
|
|
MB = $24.79
|
Most Recent Note - 9/21/2010 1:11:50 PM
Y - Gain today has it trading pennies from its 52-week high, with no overhead supply remaining to hinder its progress. A solid gain on the prior session reconfirmed a recent technical breakout above prior chart highs. Subsequent gains into new high territory with volume conviction could signal the beginning of a meaningful price advance. This high-ranked Internet-Networking Solutions firm has earned very high ranks, and 3 of the past 4 quarterly earnings comparisons showed better than +25% increases. Its annual earnings history (A criteria) since trading began in 2008 has been good.
>>> The latest Featured Stock Update with an annotated graph appeared on 9/21/2010. Click here.
View all notes |
Alert me of new notes |
CANSLIM.net Company Profile |
SEC |
Zacks Reports |
StockTalk |
News |
Chart |
Request a new note
C
A N
S L
I M
|
ROVI
-
NASDAQ
Rovi Corp
COMPUTER SOFTWARE andamp; SERVICES - Security Software andamp; Services
|
$47.22
|
+1.17
2.54% |
$47.86
|
1,832,230
142.55% of 50 DAV
50 DAV is 1,285,300
|
$48.72
-3.08%
|
8/31/2010
|
$43.31
|
PP = $45.06
|
|
MB = $47.31
|
Most Recent Note - 9/23/2010 1:04:15 PM
G - Color code is changed to green today as it again rallies, getting extended from its latest base. Two very strong gains with heavy volume followed news of a multi-year licensing deal with Apple Corp (AAPL), and it found prompt support near its 50 DMA line.
>>> The latest Featured Stock Update with an annotated graph appeared on 8/24/2010. Click here.
View all notes |
Alert me of new notes |
CANSLIM.net Company Profile |
SEC |
Zacks Reports |
StockTalk |
News |
Chart |
Request a new note
C
A N
S L
I M
|
SHOO
-
NASDAQ
Steven Madden Limited
CONSUMER NON-DURABLES - Textile - Apparel Footwear
|
$38.02
|
-0.47
-1.22% |
$39.05
|
243,853
55.55% of 50 DAV
50 DAV is 439,000
|
$40.98
-7.22%
|
9/15/2010
|
$38.94
|
PP = $40.27
|
|
MB = $42.28
|
Most Recent Note - 9/22/2010 2:45:52 PM
Y - Holding its ground, quietly perched near its August high and only -5.8% from its 52-week high. New pivot point was cited based on its 7/30/10 high plus ten cents.
>>> The latest Featured Stock Update with an annotated graph appeared on 8/5/2010. Click here.
View all notes |
Alert me of new notes |
CANSLIM.net Company Profile |
SEC |
Zacks Reports |
StockTalk |
News |
Chart |
Request a new note
C
A N
S L
I M
|
SLW
-
NYSE
Silver Wheaton Corp
METALS and; MINING - Silver
|
$26.20
|
+0.24
0.92% |
$26.56
|
9,434,957
193.04% of 50 DAV
50 DAV is 4,887,500
|
$25.99
0.81%
|
8/25/2010
|
$21.40
|
PP = $21.99
|
|
MB = $23.09
|
Most Recent Note - 9/23/2010 1:17:45 PM
G - Today's 4th consecutive gain for another new all-time high has it more extended from a sound base. Prior highs in the $21 area define chart support to watch.
>>> The latest Featured Stock Update with an annotated graph appeared on 8/25/2010. Click here.
View all notes |
Alert me of new notes |
CANSLIM.net Company Profile |
SEC |
Zacks Reports |
StockTalk |
News |
Chart |
Request a new note
C
A N
S L
I M
|
SVR
-
NYSE
Syniverse Holdings Inc
TELECOMMUNICATIONS - Diversified Communication Serv
|
$23.03
|
-0.06
-0.26% |
$23.43
|
481,070
68.66% of 50 DAV
50 DAV is 700,700
|
$23.92
-3.72%
|
9/22/2010
|
$23.60
|
PP = $23.87
|
|
MB = $25.06
|
Most Recent Note - 9/22/2010 1:48:35 PM
Y - Spiked up to a new 52-week high earlier today. It has formed a saucer-like base in the past 9 weeks that included a couple of weeks trading under its 50 DMA line. It found support near prior chart highs following the previously noted 7/13/10 breakaway gap to a new multi-year high. Recent quarterly comparisons show encouraging sales revenues and earnings acceleration versus the year-ago periods. Up and down annual earnings history (A criteria) remains a concern.
>>> The latest Featured Stock Update with an annotated graph appeared on 9/22/2010. Click here.
View all notes |
Alert me of new notes |
CANSLIM.net Company Profile |
SEC |
Zacks Reports |
StockTalk |
News |
Chart |
Request a new note
C
A N
S L
I M
|
Symbol/Exchange
Company Name
Industry Group |
PRICE |
CHANGE
(%Change) |
Day High |
Volume
(% DAV)
(% 50 day avg vol) |
52 Wk Hi
% From Hi |
Featured
Date |
Price
Featured |
Pivot Featured |
|
Max Buy |
UA
-
NYSE
Under Armour Inc Cl A
CONSUMER NON-DURABLES - Textile - Apparel Clothing
|
$44.39
|
-0.69
-1.53% |
$45.18
|
784,969
104.15% of 50 DAV
50 DAV is 753,700
|
$45.44
-2.31%
|
9/9/2010
|
$39.99
|
PP = $40.10
|
|
MB = $42.11
|
Most Recent Note - 9/22/2010 2:47:52 PM
G - Pulling back on lighter volume, it is extended from its latest sound base pattern following a streak of 14 consecutive gains.
>>> The latest Featured Stock Update with an annotated graph appeared on 9/9/2010. Click here.
View all notes |
Alert me of new notes |
CANSLIM.net Company Profile |
SEC |
Zacks Reports |
StockTalk |
News |
Chart |
Request a new note
C
A N
S L
I M
|
UFPT
-
NASDAQ
U F P Tech Inc
CONSUMER NON-DURABLES - Packaging and Containers
|
$11.30
|
-0.23
-1.99% |
$11.49
|
94,304
231.14% of 50 DAV
50 DAV is 40,800
|
$11.85
-4.64%
|
9/16/2010
|
$11.20
|
PP = $11.69
|
|
MB = $12.27
|
Most Recent Note - 9/23/2010 1:30:02 PM
Y - Hovering near its 52-week high and pivot point, pulling back on light volume. No resistance remains due to overhead supply, and with only 6.21 million shares outstanding (S criteria) any institutional buying or selling can lead to greater price volatility.
>>> The latest Featured Stock Update with an annotated graph appeared on 9/17/2010. Click here.
View all notes |
Alert me of new notes |
CANSLIM.net Company Profile |
SEC |
Zacks Reports |
StockTalk |
News |
Chart |
Request a new note
C
A N
S L
I M
|
ULTA
-
NASDAQ
Ulta Salon Cosm & Frag
SPECIALTY RETAIL - Specialty Retail, Other
|
$27.66
|
-0.28
-1.00% |
$28.35
|
501,228
82.48% of 50 DAV
50 DAV is 607,700
|
$29.47
-6.14%
|
9/3/2010
|
$26.36
|
PP = $25.89
|
|
MB = $27.18
|
Most Recent Note - 9/22/2010 2:31:45 PM
G - Loss today has erased the prior session's big volume-driven gain. Prior highs in the $26 area define support to watch now.
>>> The latest Featured Stock Update with an annotated graph appeared on 9/3/2010. Click here.
View all notes |
Alert me of new notes |
CANSLIM.net Company Profile |
SEC |
Zacks Reports |
StockTalk |
News |
Chart |
Request a new note
C
A N
S L
I M
|
VIT
-
NYSE
Vanceinfo Tech Inc Ads
COMPUTER SOFTWARE and SERVICES - Business Software and Services
|
$31.61
|
+0.87
2.83% |
$31.91
|
703,756
126.51% of 50 DAV
50 DAV is 556,300
|
$31.88
-0.85%
|
7/8/2010
|
$25.20
|
PP = $26.58
|
|
MB = $27.91
|
Most Recent Note - 9/23/2010 4:46:42 PM
G - Gain today with above average volume for a new all-time high close. It is extended from a prior resistance level in the $26 area. Its 50 DMA line defines chart support to watch.
>>> The latest Featured Stock Update with an annotated graph appeared on 8/31/2010. Click here.
View all notes |
Alert me of new notes |
CANSLIM.net Company Profile |
SEC |
Zacks Reports |
StockTalk |
News |
Chart |
Request a new note
C
A N
S L
I M
|
WCRX
-
NASDAQ
Warner Chilcott Plc
DRUGS - Drug Manufacturers - Other
|
$22.47
|
-0.31
-1.36% |
$23.00
|
2,263,165
95.15% of 50 DAV
50 DAV is 2,378,500
|
$23.53
-4.50%
|
8/23/2010
|
$21.04
|
PP = $20.84
|
|
MB = $21.88
|
Most Recent Note - 9/20/2010 5:17:09 PM
G - Gain today with near average volume for yet another new all-time high. Color code was changed to green after getting extended from its prior base. (Featured price, pivot point, and max buy data are adjusted -$8.50 following recent cash dividend.)
>>> The latest Featured Stock Update with an annotated graph appeared on 8/23/2010. Click here.
View all notes |
Alert me of new notes |
CANSLIM.net Company Profile |
SEC |
Zacks Reports |
StockTalk |
News |
Chart |
Request a new note
C
A N
S L
I M
|
Symbol/Exchange
Company Name
Industry Group |
PRICE |
CHANGE
(%Change) |
Day High |
Volume
(% DAV)
(% 50 day avg vol) |
52 Wk Hi
% From Hi |
Featured
Date |
Price
Featured |
Pivot Featured |
|
Max Buy |