You are not logged in.
This means you
CAN ONLY VIEW reports that were published prior to Monday, April 14, 2025.
You
MUST UPGRADE YOUR MEMBERSHIP if you want to see any current reports.
AFTER MARKET UPDATE - WEDNESDAY, SEPTEMBER 23RD, 2009
Previous After Market Report Next After Market Report >>>
|
|
|
|
DOW |
-81.32 |
9,748.55 |
-0.83% |
|
Volume |
1,320,149,790 |
+4% |
|
Volume |
2,734,847,300 |
+7% |
|
NASDAQ |
-14.88 |
2,131.42 |
-0.69% |
|
Advancers |
1,067 |
34% |
|
Advancers |
1,048 |
37% |
|
S&P 500 |
-10.79 |
1,060.87 |
-1.01% |
|
Decliners |
1,955 |
63% |
|
Decliners |
1,683 |
59% |
|
Russell 2000 |
-7.32 |
613.37 |
-1.18% |
|
52 Wk Highs |
305 |
|
|
52 Wk Highs |
128 |
|
|
S&P 600 |
-3.41 |
321.07 |
-1.05% |
|
52 Wk Lows |
2 |
|
|
52 Wk Lows |
3 |
|
|
 |
Major Averages Negatively Reverse For Losses On Higher Volume
Adam Sarhan, Contributing Writer,
The major averages negatively reversed and closed lower as volume totals exceeded the prior session's levels on both exchanges. This marked a distribution day for the major averages and suggests a pullback of some sort may be in the cards. Decliners led advancers by nearly a 2-to-1 ratio on the NYSE and by a 3-to-2 ratio on the Nasdaq exchange. There were 33 high-ranked companies from the CANSLIM.net Leaders List that made a new 52-week high and appeared on the CANSLIM.net BreakOuts Page, lower from 36 issues that appeared on the prior session. New 52-week highs were in the triple digits on both exchanges, while new 52-week lows were in the single digits yet again.
President Obama, and several other heads of state, addressed the United Nations' General Assembly today and tackled several important topics. The market edged higher all day but turned lower in the last hour as the bears showed up and send prices lower. Around 2pm EST, the Federal Reserve held rates steady and concluded their two-day meeting. The Fed said that it plans on slowing the purchases of mortgage-backed securities and housing-agency bonds “in order to promote a smooth transition in markets.” The Fed's $1.45 trillion in purchases will be executed by the end of the first quarter of 2010 as the market continues to stabilize from the worst sell off in several generations. This sent the US dollar higher and in turn several other markets lower.
The Dow Jones Industrial Average briefly traded above 9,900 which is the last round number below the psychologically important 10,000 level. The benchmark S&P 500 Index hit a high of 1,080 before turning lower and closing in the lower half of its range which is not an encouraging sign. Meanwhile, the tech-heavy Nasdaq Composite Index also negatively reversed and closed near its intra-day lows after hitting a new 2009 high of 2,167.70. The fact that all the major averages and several leading stocks negatively reversed after hitting a fresh 2009 highs suggests the long overdue pullback may be in the cards. Looking forward, one would be wise to closely watch your stocks and raise your stops to prevent any unnecessary losses from occurring.
Q3 Webcast- Last Chance- Sign Up Now!
If you have not already signed up for tonight's webcast- please Click Here. The webcast will be available On-Demand,which means that you can play, pause, stop, rewind and fast forward as many times as you like. The webcast will review the entire 2007-2009 Bear Market, show you day by day how the market topped out, analyze the important events that occurred in 2008 and show you how the market bottomed in March 2009. The webcast will also list several high ranked growth stocks that could be on an active watchlist.
PICTURED: The Nasdaq Composite Index negatively reversed today on higher volume than the prior session.
|
|
|
 |
SOX Hits New 2009 High; XAU Consolidating Above Prior Highs
Kenneth J. Gruneisen - Passed the CAN SLIM® Master's Exam
Commodity-linked stocks were among Wednesday's weaker participants as the Oil Services Index ($OSX -2.24%) and Integrated Oil Index ($XOI -2.03%) backpedaled. Financial shares also lagged as the Bank Index ($BKX -2.12%) and Broker/Dealer Index ($XBD -1.14%) pulled back. Losses in the Healthcare Index ($HMO -1.98%), Retail Index ($RLX -1.11%) and most tech indexes also weighed on the major averages. The Networking Index ($NWX -1.76%), Biotechnology Index ($BTK -1.28%), and Internet Index ($IIX -0.64%) suffered losses and only the Semiconductor Index ($SOX +0.52%) finished the session with a gain.
Charts courtesy www.stockcharts.com
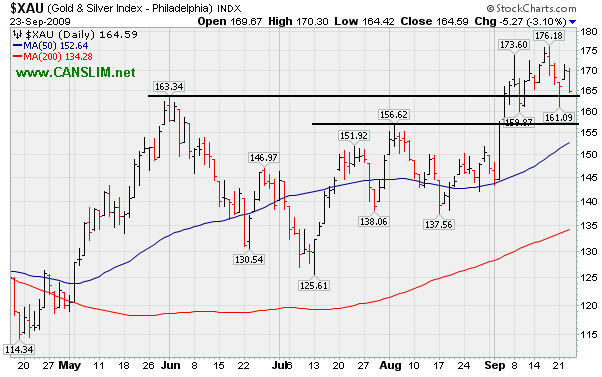
PICTURED 1: The Gold & Silver Index ($XAU -3.10%) is consolidating above prior chart highs.
Charts courtesy www.stockcharts.com
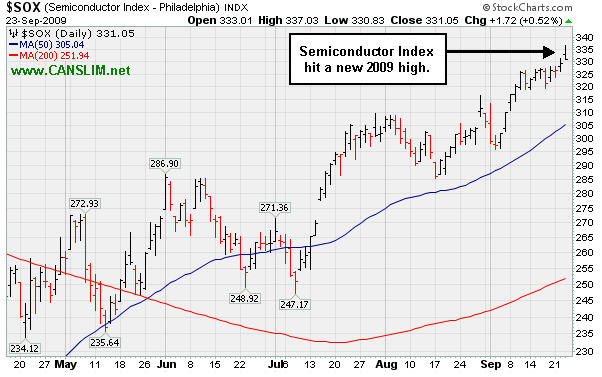
PICTURED 2: The Semiconductor Index ($SOX +0.52%) rallied to a new 2009 high.
| Oil Services |
$OSX |
193.85 |
-4.44 |
-2.24% |
+59.69% |
| Healthcare |
$HMO |
1,228.04 |
-24.77 |
-1.98% |
+27.90% |
| Integrated Oil |
$XOI |
1,034.48 |
-21.45 |
-2.03% |
+5.59% |
| Semiconductor |
$SOX |
331.05 |
+1.72 |
+0.52% |
+56.03% |
| Networking |
$NWX |
236.17 |
-4.22 |
-1.76% |
+64.13% |
| Internet |
$IIX |
218.67 |
-1.40 |
-0.64% |
+63.47% |
| Broker/Dealer |
$XBD |
121.32 |
-1.40 |
-1.14% |
+56.60% |
| Retail |
$RLX |
380.65 |
-4.27 |
-1.11% |
+36.31% |
| Gold & Silver |
$XAU |
164.59 |
-5.27 |
-3.10% |
+32.89% |
| Bank |
$BKX |
47.52 |
-1.03 |
-2.12% |
+7.22% |
| Biotech |
$BTK |
944.80 |
-12.24 |
-1.28% |
+45.99% |
|
|
|
 |
Healthier Pattern Now Developing
Kenneth J. Gruneisen - Passed the CAN SLIM® Master's Exam
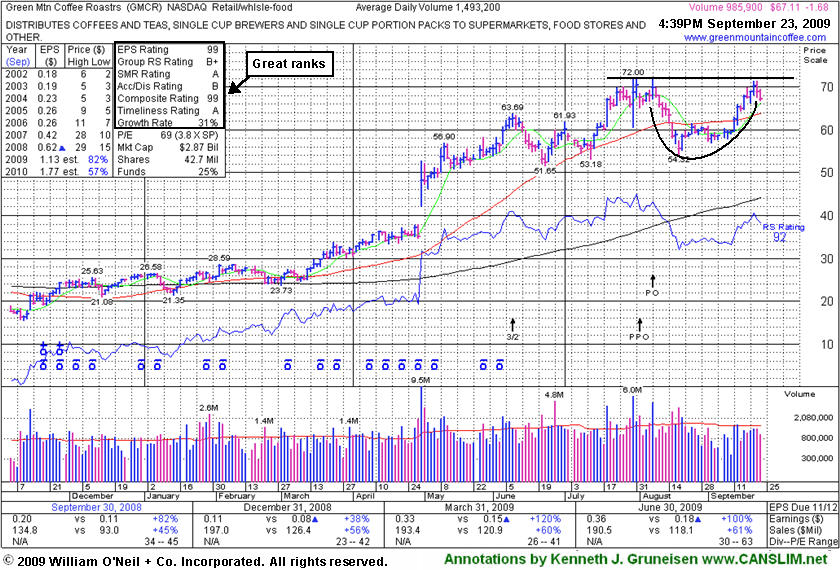
Green Mountain Coffee Roasters (GMCR -$1.68 or -2.52% to $67.11) is consolidating on the right side of a 6-week cup shaped base, and it closed the session less than -7% off its all-time high. It did a great job of overcoming distributional pressure since its last appearance in this FSU section on 9/10/09 under the headline, "Struggling Below 50 Day Average 4 Weeks With Lack Of Volume Behind Gains," showing a possible "head-and-shoulders" top taking shape. It avoided losses afterward that would have undercut its neckline and triggered a worrisome technical sell signal.
It completed an additional share offering on 8/07/09. Volume totals have been light or near average as it recently rose back above its 50-day moving average (DMA) line and rallied up through most overhead supply. It may go on to form a sound cup-with-handle type pattern in due time. GMCR traded up more than +168% since appearing with an annotated graph under the headline "It May Soon Be Time To Go Green" when featured in the January 2009 CANSLIM.net News (read here).
|
|
|
Color Codes Explained :
Y - Better candidates highlighted by our
staff of experts.
G - Previously featured
in past reports as yellow but may no longer be buyable under the
guidelines.
***Last / Change / Volume quote data in this table corresponds with the timestamp on the note***
Symbol/Exchange
Company Name
Industry Group |
Last |
Chg. |
Vol
% DAV |
Date Featured |
Price Featured |
Latest Pivot Point
Featured |
Status |
| Latest Max Buy Price |
ARO
- NYSE
Aeropostale Inc
RETAIL - Apparel Stores
|
$43.57
|
-0.16
|
1,868,097
67% DAV
2,772,900
|
8/21/2009
(Date
Featured) |
$39.21
(Price
Featured) |
PP = $38.84 |
G |
| MB = $40.78 |
Most Recent Note - 9/23/2009 4:25:01 PM
G - This high-ranked leader in the Retail - Clothing/shoe group negatively reversed for a second day in a row after initially gapping up. It is extended from a sound base and not buyable under the investment system guidelines now. Support to watch is at prior highs in the $38 area. It was featured in yellow in the 8/21/09 Mid-Day BreakOuts Report (read here).
>>> The latest Featured Stock Update with an annotated graph appeared on 9/18/2009. click here.
|
|
C
A
S
I |
News |
Chart |
SEC
View all notes Alert
me of new notes
Company
Profile
|
ARST
-
|
$23.55
|
+0.03
|
1,055,409
142% DAV
742,400
|
9/1/2009
(Date
Featured) |
$19.91
(Price
Featured) |
PP = $20.90 |
G |
| MB = $21.95 |
Most Recent Note - 9/23/2009 4:25:44 PM
G - Today's 4th consecutive gain with above average volume helped it hit another new all-time high. It is extended from its latest base. Prior chart highs in the $20 area are important support to watch on pullbacks.
>>> The latest Featured Stock Update with an annotated graph appeared on 9/17/2009. click here.
|
|
C
A
S
I |
News |
Chart |
SEC
View all notes Alert
me of new notes
Company
Profile
|
BIDU
- NASDAQ
Baidu Inc Ads
INTERNET - Internet Information Providers
|
$394.95
|
-1.34
|
1,416,822
77% DAV
1,834,200
|
9/8/2009
(Date
Featured) |
$351.80
(Price
Featured) |
PP = $368.59 |
G |
| MB = $387.02 |
Most Recent Note - 9/23/2009 4:26:36 PM
G - Today it negatively reversed once again while hovering near the $400 level. Extended from a sound base, thus not buyable now under the investment system guidelines. BIDU was featured in yellow in the 9/08/09 Mid-Day BreakOuts Report (read here).
>>> The latest Featured Stock Update with an annotated graph appeared on 9/21/2009. click here.
|
|
C
A
S
I |
News |
Chart |
SEC
View all notes Alert
me of new notes
Company
Profile
|
CRM
- NYSE
Salesforce.com Inc
INTERNET - Internet Software & Services
|
$57.54
|
+0.67
|
1,504,634
74% DAV
2,030,400
|
8/16/2009
(Date
Featured) |
$47.12
(Price
Featured) |
PP = $45.59 |
G |
| MB = $47.87 |
Most Recent Note - 9/23/2009 4:27:40 PM
G - Quietly consolidating, it is still extended from a sound base, thus not buyable now under the guidelines. Prior highs near $55 are an intial support level to watch on pullbacks.
>>> The latest Featured Stock Update with an annotated graph appeared on 9/15/2009. click here.
|
|
C
A
S
I |
News |
Chart |
SEC
View all notes Alert
me of new notes
Company
Profile
|
EBIX
- NASDAQ
Ebix Inc
COMPUTER SOFTWARE & SERVICES - Business Software & Services
|
$47.27
|
+0.92
|
210,079
154% DAV
136,500
|
8/28/2009
(Date
Featured) |
$45.86
(Price
Featured) |
PP = $45.35 |
G |
| MB = $47.62 |
Most Recent Note - 9/23/2009 4:29:38 PM
G - Gain today halted its streak of losses on heavy volume. Recent weakness has been indicative of distributional pressure while consolidating toward important support at prior chart highs and its 50 DMA line in the $44-45 area. Recent whipsaw action briefly tested support, like its shakeout in mid-August. It has a small supply of only 6.62 million shares in the float. EBIX rallied as much as +19.76% since featured in yellow in the 8/28/09 Mid-Day BreakOuts Report (read here).
>>> The latest Featured Stock Update with an annotated graph appeared on 9/11/2009. click here.
|
|
C
A
S
I |
News |
Chart |
SEC
View all notes Alert
me of new notes
Company
Profile
|
GMCR
- NASDAQ
Green Mtn Coffee Roastrs
FOOD & BEVERAGE - Processed & Packaged Goods
|
$67.10
|
-1.69
|
1,002,030
67% DAV
1,493,200
|
7/17/2009
(Date
Featured) |
$60.15
(Price
Featured) |
PP = $63.79 |
G |
| MB = $66.98 |
Most Recent Note - 9/23/2009 4:30:31 PM
G - After another small gap up today it again negatively reversed and closed in the lower half of its intra-day range. It did a great job of overcoming distributional pressure after it completed an additional share offering on 8/07/09. Volume totals have been light or near average as it recently rose back above its 50 DMA line and rallied up through most overhead supply. GMCR traded up more than +168% since appearing with an annotated graph under the headline "It May Soon Be Time To Go Green" when featured in the January 2009 CANSLIM.net News (read here).
>>> The latest Featured Stock Update with an annotated graph appeared on 9/23/2009. click here.
|
|
C
A
S
I |
News |
Chart |
SEC
View all notes Alert
me of new notes
Company
Profile
|
NTES
- NASDAQ
Netease Inc Adr
INTERNET - Internet Information Providers
|
$47.00
|
+2.10
|
4,591,461
219% DAV
2,093,900
|
9/23/2009
(Date
Featured) |
$47.11
(Price
Featured) |
PP = $47.04 |
Y |
| MB = $49.39 |
Most Recent Note - 9/23/2009 4:36:43 PM
Y - Gapped up and closed at a new high today near its latest pivot point with a considerable gain on more than twice average volume after a choppy consolidation. Color code was changed to yellow with new pivot point and max buy levels noted. This may be considered a riskier late-stage base. Important support is at its 50 DMA line and upward trendline. Deterioration below those levels would raise more serious concerns and trigger technical sell signals.
>>> The latest Featured Stock Update with an annotated graph appeared on 9/14/2009. click here.
|
|
C
A
S
I |
News |
Chart |
SEC
View all notes Alert
me of new notes
Company
Profile
|
NVEC
- NASDAQ
N V E Corp
ELECTRONICS - Semiconductor - Specialized
|
$56.70
|
-0.01
|
53,800
59% DAV
90,900
|
8/26/2009
(Date
Featured) |
$55.32
(Price
Featured) |
PP = $57.60 |
G |
| MB = $60.48 |
Most Recent Note - 9/23/2009 4:37:15 PM
G - Quietly consolidating above support at its 50 DMA line and near prior resistance in the $56-57 area. As previously noted, "Keep in mind its small supply (the S criteria) of shares outstanding which can contribute to greater than usual volatility. Be mindful of its still rather minuscule sales revenues. These concerns heighten the need for great discipline in trading (buying AND selling)."
>>> The latest Featured Stock Update with an annotated graph appeared on 9/16/2009. click here.
|
|
C
A
S
I |
News |
Chart |
SEC
View all notes Alert
me of new notes
Company
Profile
|
PEGA
- NASDAQ
Pegasystems Inc
COMPUTER SOFTWARE & SERVICES - Business Software & Services
|
$34.01
|
+0.43
|
391,491
102% DAV
384,300
|
9/9/2009
(Date
Featured) |
$31.14
(Price
Featured) |
PP = $33.35 |
Y |
| MB = $35.02 |
Most Recent Note - 9/23/2009 4:38:12 PM
Y - Gain today on average volume for a new high. A pullback under its latest pivot point on 9/17/09 raised concerns after volume-driven gains pegged the high-ranked Computer Software - Financial firm to a new all-time high.
>>> The latest Featured Stock Update with an annotated graph appeared on 9/22/2009. click here.
|
|
C
A
S
I |
News |
Chart |
SEC
View all notes Alert
me of new notes
Company
Profile
|
|
|
|
THESE ARE NOT BUY RECOMMENDATIONS!
Comments contained in the body of this report are technical
opinions only. The material herein has been obtained
from sources believed to be reliable and accurate, however,
its accuracy and completeness cannot be guaranteed.
This site is not an investment advisor, hence it does
not endorse or recommend any securities or other investments.
Any recommendation contained in this report may not
be suitable for all investors and it is not to be deemed
an offer or solicitation on our part with respect to
the purchase or sale of any securities. All trademarks,
service marks and trade names appearing in this report
are the property of their respective owners, and are
likewise used for identification purposes only.
This report is a service available
only to active Paid Premium Members.
You may opt-out of receiving report notifications
at any time. Questions or comments may be submitted
by writing to Premium Membership Services 665 S.E. 10 Street, Suite 201 Deerfield Beach, FL 33441-5634 or by calling 1-800-965-8307
or 954-785-1121.
|
|
|


