You are not logged in.
This means you
CAN ONLY VIEW reports that were published prior to Monday, April 14, 2025.
You
MUST UPGRADE YOUR MEMBERSHIP if you want to see any current reports.
AFTER MARKET UPDATE - THURSDAY, SEPTEMBER 22ND, 2011
Previous After Market Report Next After Market Report >>>
|
|
|
|
DOW |
-391.01 |
10,733.83 |
-3.51% |
|
Volume |
1,716,201,600 |
+42% |
|
Volume |
2,915,257,941 |
+37% |
|
NASDAQ |
-82.52 |
2,455.67 |
-3.25% |
|
Advancers |
345 |
11% |
|
Advancers |
368 |
14% |
|
S&P 500 |
-37.20 |
1,129.56 |
-3.19% |
|
Decliners |
2,743 |
88% |
|
Decliners |
2,283 |
85% |
|
Russell 2000 |
-21.16 |
643.42 |
-3.18% |
|
52 Wk Highs |
7 |
|
|
52 Wk Highs |
3 |
|
|
S&P 600 |
-10.05 |
352.96 |
-2.77% |
|
52 Wk Lows |
787 |
|
|
52 Wk Lows |
596 |
|
|
 |
Significant Losses While Volume Swells and Dow Exceeds Prior Low
Kenneth J. Gruneisen - Passed the CAN SLIM® Master's Exam
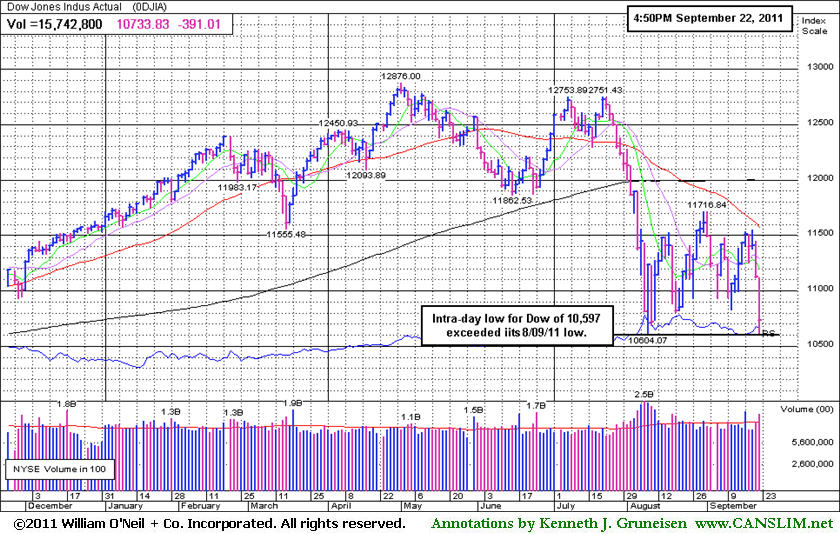
The Federal Reserve's statement that there are "significant downside risks" to the economic outlook echoed around the world and continued to spook markets on Thursday. The result was the biggest two-day slump for the major stock averages in nearly three years. The reported volume totals were higher on the NYSE and on the Nasdaq exchange, indicating another clear increase in distributional pressure from large institutional investors. Declining issues beat advancers by nearly 8-1 on the NYSE and by 6-1 on the Nasdaq exchange. The new 52-week lows list expanded sharply again and greatly outnumbered new 52-week highs on both the Nasdaq exchange and the NYSE. New highs totals on the NYSE and Nasdaq slumped into the single digits. There was only 1 high-ranked company from the CANSLIM.net Leaders List that made a new 52-week high and appeared on the CANSLIM.net BreakOuts Page, down from the prior session total of 9 stocks. The list of noteworthy buy candidates has recently expanded, but on Thursday there were losses from 14 of the 16 high-ranked companies currently included on the Featured Stocks Page.
The stock market was under heavy pressure amid concern global economic growth is slowing. The price of oil sank by more than $5 per barrel to a 6-week low. The price of gold was down over $77 an ounce at one point before finishing down $66 at a 4-week low. While equities and commodity prices plunged, bonds rallied.
The 10-year Treasury note was up a full point to yield 1.72% at one point reaching the lowest in Fed figures beginning in 1953. Yields on 30-year bonds decreased to 2.88%, compared with 3.36% a week ago. Bank stocks fell following the Fed's decision yesterday to adjust its portfolio in an attempt to lower long-term interest rates. Reducing the disparity between short and long-term rates may put downward pressure on profits, particularly at regional banks. Moody's Investors Service yesterday downgraded three U.S. banks, including Bank of America Corp (BAC -5.02%).
News out of Asia deepened concerns about the global economy. China's manufacturing may shrink for a third month in September after a preliminary index of purchasing managers showed a decline in export orders and output. U.S. economic reports were mixed. Initial jobless claims totaled 423,000 in the latest week, slightly above expectations. The index of U.S. leading economic indicators increased 0.3% in August, more than forecast, pointing to a faster pace of growth heading into next year.
FedEx Corp (FDX -8.17%) slumped after the company cut its full-year profit forecast as volumes declined. Bed Bath & Beyond (BBBY +0.63%) posted earnings that beat expectations, and shares bucked the widely negative market. In merger news, Dow component United Technologies Corp (UTX -8.76%) announced a deal to buy Goodrich Corp (GR +10.15%) for $16.5 billion. The deal had been rumored for several days.
The market environment (M criteria) is clearly under pressure and back in a correction. The latest confirmed rally may, at best, be considered barely alive by the fact that the Nasdaq Composite Index and S&P 500 Index are still fighting to stay above their respective Day 1 (8/09/11) lows.
The September 2011 issue of CANSLIM.net News will be available soon. The Q3 2011 Webcast has also been scheduled for Wednesday, September 28th at 8PM EST. Links to all prior reports and webcasts are available on the Premium Member Homepage.
PICTURED: The Dow Jones Industrial Average's intra-day low exceeded its 8/09/11 low.
|
 Kenneth J. Gruneisen started out as a licensed stockbroker in August 1987, a couple of months prior to the historic stock market crash that took the Dow Jones Industrial Average down -22.6% in a single day. He has published daily fact-based fundamental and technical analysis on high-ranked stocks online for two decades. Through FACTBASEDINVESTING.COM, Kenneth provides educational articles, news, market commentary, and other information regarding proven investment systems that work in good times and bad.
Comments contained in the body of this report are technical opinions only and are not necessarily those of Gruneisen Growth Corp. The material herein has been obtained from sources believed to be reliable and accurate, however, its accuracy and completeness cannot be guaranteed. Our firm, employees, and customers may effect transactions, including transactions contrary to any recommendation herein, or have positions in the securities mentioned herein or options with respect thereto. Any recommendation contained in this report may not be suitable for all investors and it is not to be deemed an offer or solicitation on our part with respect to the purchase or sale of any securities. |
|
 |
Commodity-Linked Groups Led Big Widespread Losses
Kenneth J. Gruneisen - Passed the CAN SLIM® Master's Exam
Commodity-linked groups led the market's retreat as the Gold & Silver Index ($XAU -7.81%) plunged and the Oil Services Index ($OSX -6.55%) and Integrated Oil Index ($XOI -4.78%) faced the greatest selling pressure. The tech sector melted down as the Networking Index ($NWX -4.58%), Biotechnology Index ($BTK -3.60%), Semiconductor Index ($SOX -3.45%), and Internet Index ($IIX -3.42%) were unanimously lower. The Healthcare Index ($HMO -2.84%) could not avoid also suffering the ills of the broader market. Losses from the Retail Index ($RLX -2.99%) and weakness in influential financial shares dragged the Broker/Dealer Index ($XBD -2.83%) and Bank Index ($BKX -2.68%) lower again.
Charts courtesy www.stockcharts.com
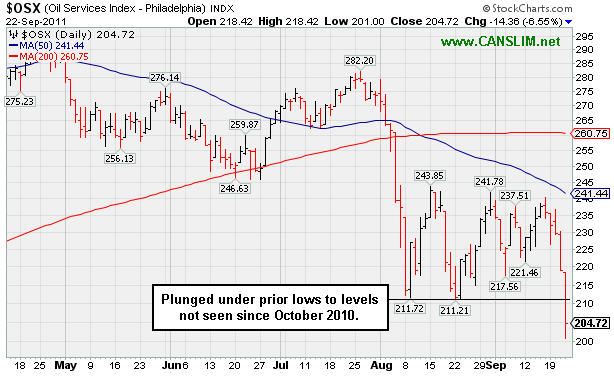
PICTURED 1: The Oil Services Index ($OSX -6.55%) plunged under prior lows to levels not seen since October 2010. A weaker global economic outlook has led analysts to lower their expectations for energy demand.
Charts courtesy www.stockcharts.com
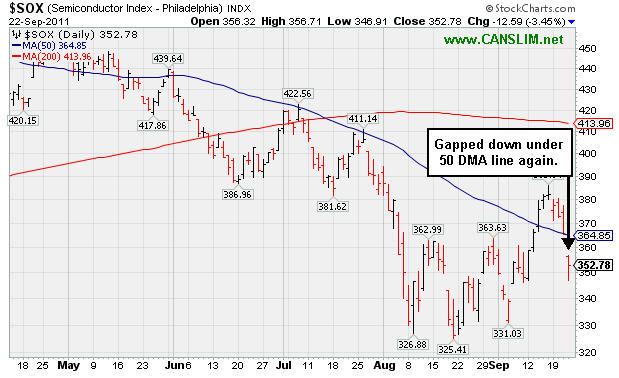
PICTURED 2: The Semiconductor Index ($SOX -3.45%) gapped down under its 50-day moving average (DMA) line again.
| Oil Services |
$OSX |
204.72 |
-14.36 |
-6.55% |
-16.48% |
| Healthcare |
$HMO |
1,902.17 |
-55.50 |
-2.84% |
+12.42% |
| Integrated Oil |
$XOI |
1,032.44 |
-51.88 |
-4.78% |
-14.90% |
| Semiconductor |
$SOX |
352.78 |
-12.59 |
-3.45% |
-14.34% |
| Networking |
$NWX |
216.97 |
-10.40 |
-4.58% |
-22.67% |
| Internet |
$IIX |
267.82 |
-9.49 |
-3.42% |
-12.97% |
| Broker/Dealer |
$XBD |
79.98 |
-2.33 |
-2.83% |
-34.18% |
| Retail |
$RLX |
499.56 |
-14.90 |
-2.90% |
-1.73% |
| Gold & Silver |
$XAU |
197.11 |
-16.69 |
-7.81% |
-13.01% |
| Bank |
$BKX |
34.33 |
-1.07 |
-3.02% |
-34.25% |
| Biotech |
$BTK |
1,128.72 |
-42.19 |
-3.60% |
-13.02% |
|
|
|
 |
Gap Down Under 50-Day Average After No New Technical Buy Signal
Kenneth J. Gruneisen - Passed the CAN SLIM® Master's Exam
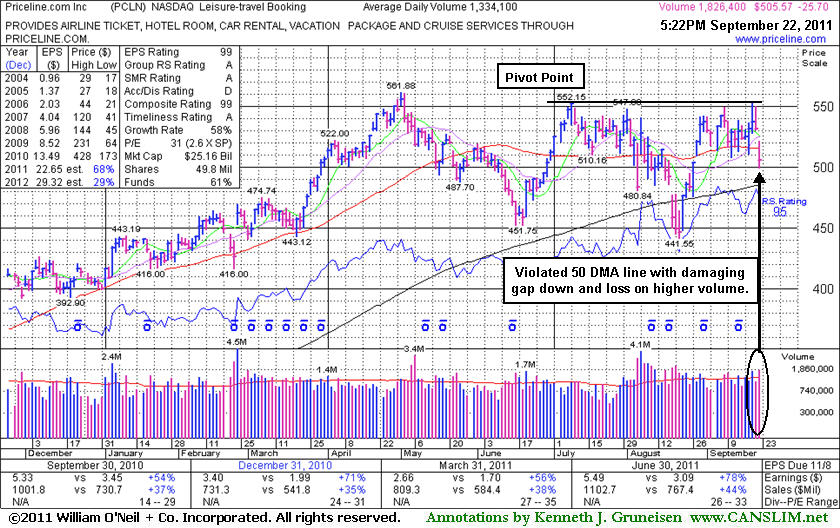
Priceline.com Inc. (PCLN -$25.70 or -4.84% to $505.57) gapped down today for a damaging loss amid widespread market weakness, violating its 50-day moving average (DMA) line and raising concerns while trading near recent lows. It was highlighted in the 9/20/11 mid-day report (read here) in yellow with pivot point cited based on its 7/08/11 high plus 10 cents. A volume-driven gain did not yet trigger a proper technical buy signal. It remains a worthy candidate for investors' watchlists. Meanwhile, the 200 DMA line and recent chart lows define the next important support to watch.
PCLN rebounded after a brief violation of its 200 DMA line during its choppy consolidation since it was dropped from the Featured Stocks list on 8/18/11. Its last appearance in this FSU section was on 8/12/11 under the headline, "Overhead Supply May Act As Resistance". It announced earnings +78% on +44% sales revenues (an impressive sequential acceleration) for the latest quarter ended June 30, 2011 versus the year ago period. The company has maintained a stellar earnings history that satisfies the C and A criteria.
Keep in mind, the investment system's biggest winning models were typically held by at least a few mutual funds and attracting many others. However, once a stock is very heavily owned by a long list of mutual funds, as is now the case with PCLN, investors should be especially cautious and alert for any technical sell signals or fundamental disappointments which could prompt a rush for the exits. The number of top-rated funds owning its shares rose from 1,354 in Sep '10 to 1,631 in June '11, and increasing interest is an encouraging sign concerning the I criteria.
Eventually a convincing volume-driven breakout could trigger a fresh new (or add-on) technical buy signal, but for now it needs to work its way up through overhead supply into the $550 area again. Also, the M criteria may override all other promising criteria, since 3 out of 4 stocks follow the direction of the major averages.
|
|
|
Color Codes Explained :
Y - Better candidates highlighted by our
staff of experts.
G - Previously featured
in past reports as yellow but may no longer be buyable under the
guidelines.
***Last / Change / Volume data in this table is the closing quote data***
Symbol/Exchange
Company Name
Industry Group |
PRICE |
CHANGE
(%Change) |
Day High |
Volume
(% DAV)
(% 50 day avg vol) |
52 Wk Hi
% From Hi |
Featured
Date |
Price
Featured |
Pivot Featured |
|
Max Buy |
AAPL
-
NASDAQ
Apple Inc
COMPUTER HARDWARE - Personal Computers
|
$401.82
|
-10.32
-2.50% |
$409.82
|
34,541,290
155.15% of 50 DAV
50 DAV is 22,262,600
|
$422.86
-4.98%
|
9/16/2011
|
$399.14
|
PP = $404.60
|
|
MB = $424.83
|
 Most Recent Note - 9/22/2011 12:30:52 PM
Y - Pulling back near its prior highs and pivot point amid widespread market weakness today. Recent rally to a new all-time high was not marked by very heavy volume. It is already heavily owned by the institutional crowd, and ownership by top-rated funds fell from 4,367 in Mar '11 to 4,345 in Jun '11.
>>> The latest Featured Stock Update with an annotated graph appeared on 9/19/2011. Click here.
View all notes |
Alert me of new notes |
CANSLIM.net Company Profile |
SEC |
Zacks Reports |
StockTalk |
News |
Chart |
Request a new note
C
A N
S L
I M


|
ALXN
-
NASDAQ
Alexion Pharmaceuticals
DRUGS - Drug Manufacturers - Other
|
$63.37
|
-2.34
-3.56% |
$64.96
|
1,733,576
107.86% of 50 DAV
50 DAV is 1,607,300
|
$67.75
-6.46%
|
9/15/2011
|
$63.20
|
PP = $60.81
|
|
MB = $63.85
|
Most Recent Note - 9/22/2011 2:47:55 PM
G - Gapped down today amid widespread market weakness, slumping back below its "max buy" level. Broader market weakness (M criteria) this week argues more strongly for protecting capital as opposed to taking on more exposure to equities. Prior resistance in the $59-60 area defines initial support to watch on pullbacks.
>>> The latest Featured Stock Update with an annotated graph appeared on 9/15/2011. Click here.
View all notes |
Alert me of new notes |
CANSLIM.net Company Profile |
SEC |
Zacks Reports |
StockTalk |
News |
Chart |
Request a new note
C
A N
S L
I M
|
ATHN
-
NASDAQ
Athenahealth Inc
DIVERSIFIED SERVICES - Business/Management Services
|
$62.83
|
-3.05
-4.63% |
$64.34
|
1,414,300
174.71% of 50 DAV
50 DAV is 809,500
|
$72.70
-13.58%
|
9/8/2011
|
$61.93
|
PP = $61.78
|
|
MB = $64.87
|
Most Recent Note - 9/22/2011 9:48:36 AM
G - Gapped down today amid widespread market weakness, raising concerns. Abruptly pulling back to prior highs in the $61 area previously noted as initial support on pullbacks.
>>> The latest Featured Stock Update with an annotated graph appeared on 9/8/2011. Click here.
View all notes |
Alert me of new notes |
CANSLIM.net Company Profile |
SEC |
Zacks Reports |
StockTalk |
News |
Chart |
Request a new note
C
A N
S L
I M
|
CELG
-
NASDAQ
Celgene Corp
DRUGS - Drug Manufacturers - Major
|
$63.54
|
-0.26
-0.41% |
$63.69
|
7,234,439
177.69% of 50 DAV
50 DAV is 4,071,300
|
$65.86
-3.52%
|
9/16/2011
|
$61.21
|
PP = $62.59
|
|
MB = $65.72
|
Most Recent Note - 9/22/2011 12:50:18 PM
Y - Trading near the session high after a gap down today amid widespread market weakness. It abruptly pulled back near previously stubborn resistance in the $62 area which may act as a support level.
>>> The latest Featured Stock Update with an annotated graph appeared on 9/16/2011. Click here.
View all notes |
Alert me of new notes |
CANSLIM.net Company Profile |
SEC |
Zacks Reports |
StockTalk |
News |
Chart |
Request a new note
C
A N
S L
I M
|
CPA
-
NYSE
Copa Holdings Sa
TRANSPORTATION - Regional Airlines
|
$63.27
|
-4.19
-6.21% |
$65.64
|
473,813
161.11% of 50 DAV
50 DAV is 294,100
|
$72.86
-13.16%
|
9/21/2011
|
$69.67
|
PP = $72.86
|
|
MB = $76.50
|
Most Recent Note - 9/22/2011 9:53:40 AM
G - Gapped down today and violated its 50 DMA line raising concerns, and its color code is changed to green. Finished at the prior session low after a damaging loss with above average volume. While forming a high handle following a 10-week cup shaped base pattern it was highlighted in yellow in the 9/21/11 mid-day report with a pivot point based on its 9/14/11 high. It is normally best if the volume totals are light while a "handle" is formed, so the distributional loss it suffered may not bode well. Additionally, as it was noted earlier - "Confirming gains with heavy volume for a new high close are needed before disciplined investors might consider this high-ranked Panama-based airline a legitimate buy candidate. Found support above its 200 DMA line and prior highs in the $59 area during its recent consolidation. It is hovering near its 52-week high and within close striking distance of its 2007 all-time high ($73.33). Reported earnings +52% on +41% sales revenues for the quarter ended June 30, 2011 versus the year ago period. Sales revenues and earnings have improved in the 3 most recent quarterly comparisons (Dec '10, Mar and Jun '11) after a streak of negative or weak comparisons. Annual earnings (the A criteria) growth has been good, and increasing institutional ownership (the I criteria) is an encouraging sign.

There are no Featured Stock Updates™ available for this stock at this time. You may request one by clicking the Request a New Note link below
View all notes |
Alert me of new notes |
CANSLIM.net Company Profile |
SEC |
Zacks Reports |
StockTalk |
News |
Chart |
Request a new note
C
A N
S L
I M
|
Symbol/Exchange
Company Name
Industry Group |
PRICE |
CHANGE
(%Change) |
Day High |
Volume
(% DAV)
(% 50 day avg vol) |
52 Wk Hi
% From Hi |
Featured
Date |
Price
Featured |
Pivot Featured |
|
Max Buy |
DMND
-
NASDAQ
Diamond Foods Inc
FOOD and; BEVERAGE - Processed and; Packaged Goods
|
$91.13
|
-0.78
-0.85% |
$91.98
|
760,479
250.08% of 50 DAV
50 DAV is 304,100
|
$96.13
-5.20%
|
9/13/2011
|
$75.57
|
PP = $80.16
|
|
MB = $84.17
|
Most Recent Note - 9/22/2011 12:59:58 PM
G - Holding its ground near its all-time high today, extended from its latest sound base pattern. Prior highs in the $80 area define initial chart support to watch on pullbacks.
>>> The latest Featured Stock Update with an annotated graph appeared on 9/13/2011. Click here.
View all notes |
Alert me of new notes |
CANSLIM.net Company Profile |
SEC |
Zacks Reports |
StockTalk |
News |
Chart |
Request a new note
C
A N
S L
I M
|
EXLS
-
NASDAQ
Exlservice Holdings Inc
DIVERSIFIED SERVICES - Business/Management Services
|
$22.40
|
-0.35
-1.54% |
$22.75
|
548,147
284.16% of 50 DAV
50 DAV is 192,900
|
$26.55
-15.63%
|
8/2/2011
|
$24.85
|
PP = $24.85
|
|
MB = $26.09
|
Most Recent Note - 9/22/2011 4:17:09 PM
G - Testing support at its 200 DMA line today, failing to rebound following its damaging 9/13/11 gap down. Churned above average volume while posting 7 losses in the past 8 sessions. Priced its previously noted Secondary Offering at $23.00. A rebound above its 50 DMA line would help its outlook.
>>> The latest Featured Stock Update with an annotated graph appeared on 9/7/2011. Click here.
View all notes |
Alert me of new notes |
CANSLIM.net Company Profile |
SEC |
Zacks Reports |
StockTalk |
News |
Chart |
Request a new note
C
A N
S L
I M
|
FCFS
-
NASDAQ
First Cash Financial Svs
SPECIALTY RETAIL - Specialty Retail, Other
|
$45.56
|
-3.57
-7.27% |
$48.74
|
728,397
188.07% of 50 DAV
50 DAV is 387,300
|
$52.18
-12.69%
|
5/31/2011
|
$42.00
|
PP = $40.23
|
|
MB = $42.24
|
Most Recent Note - 9/22/2011 2:49:57 PM
G - Gapped down today amid widespread market weakness. Slumping for a 3rd consecutive loss since its negative reversal after reaching a new all-time high. It is extended from its prior base, and its 50 DMA line defines support to watch.
>>> The latest Featured Stock Update with an annotated graph appeared on 9/6/2011. Click here.
View all notes |
Alert me of new notes |
CANSLIM.net Company Profile |
SEC |
Zacks Reports |
StockTalk |
News |
Chart |
Request a new note
C
A N
S L
I M
|
JAZZ
-
NASDAQ
Jazz Pharmaceuticals Inc
DRUGS - Biotechnology
|
$43.96
|
-2.02
-4.39% |
$45.16
|
1,101,186
115.63% of 50 DAV
50 DAV is 952,300
|
$47.88
-8.19%
|
9/20/2011
|
$46.56
|
PP = $44.63
|
|
MB = $46.86
|
Most Recent Note - 9/22/2011 9:56:23 AM
Y - Gapped down today amid widespread market weakness. Its 50 DMA line defines important chart support to watch. See the latest FSU analysis for more details and an annotated weekly graph.
>>> The latest Featured Stock Update with an annotated graph appeared on 9/20/2011. Click here.
View all notes |
Alert me of new notes |
CANSLIM.net Company Profile |
SEC |
Zacks Reports |
StockTalk |
News |
Chart |
Request a new note
C
A N
S L
I M
|
JCOM
-
NASDAQ
J 2 Global Communication
INTERNET - Internet Software and Services
|
$29.79
|
-0.14
-0.47% |
$29.93
|
811,530
177.46% of 50 DAV
50 DAV is 457,300
|
$32.67
-8.83%
|
8/8/2011
|
$30.38
|
PP = $29.31
|
|
MB = $30.78
|
Most Recent Note - 9/22/2011 4:13:50 PM
G - Slumping below previous highs in the $30-31 area and testing its closely coinciding 50 and 200 DMA lines, raising concerns. Closed near the session high today but with above average volume behind its 5th consecutive loss since touching a new 52-week high.
>>> The latest Featured Stock Update with an annotated graph appeared on 8/29/2011. Click here.
View all notes |
Alert me of new notes |
CANSLIM.net Company Profile |
SEC |
Zacks Reports |
StockTalk |
News |
Chart |
Request a new note
C
A N
S L
I M
|
Symbol/Exchange
Company Name
Industry Group |
PRICE |
CHANGE
(%Change) |
Day High |
Volume
(% DAV)
(% 50 day avg vol) |
52 Wk Hi
% From Hi |
Featured
Date |
Price
Featured |
Pivot Featured |
|
Max Buy |
MA
-
NYSE
Mastercard Inc Cl A
DIVERSIFIED SERVICES - Business/Management Services
|
$330.96
|
-10.01
-2.94% |
$338.02
|
2,218,536
141.35% of 50 DAV
50 DAV is 1,569,500
|
$361.94
-8.56%
|
8/3/2011
|
$324.82
|
PP = $322.38
|
|
MB = $338.50
|
Most Recent Note - 9/22/2011 4:06:29 PM
G - Gapped down today, retreating from an all-time high hit earlier this week. It slumped under prior chart highs in the $340 area raising concerns while sinking near its 50 DMA line.
>>> The latest Featured Stock Update with an annotated graph appeared on 9/12/2011. Click here.
View all notes |
Alert me of new notes |
CANSLIM.net Company Profile |
SEC |
Zacks Reports |
StockTalk |
News |
Chart |
Request a new note
C
A N
S L
I M
|
MG
-
NYSE
Mistras Group Inc
DIVERSIFIED SERVICES - Bulding and Faci;ity Management Services
|
$18.93
|
+0.67
3.67% |
$19.00
|
240,795
131.80% of 50 DAV
50 DAV is 182,700
|
$20.82
-9.08%
|
8/10/2011
|
$17.89
|
PP = $17.58
|
|
MB = $18.46
|
Most Recent Note - 9/22/2011 3:44:30 PM
G - Rebounded into positive territory and back above its 50 DMA line with a positive reversal today against a widely negative market backdrop. Prior highs in the $18 area and its 50 DMA line were previously noted as important chart support to watch on pullbacks.
>>> The latest Featured Stock Update with an annotated graph appeared on 9/9/2011. Click here.
View all notes |
Alert me of new notes |
CANSLIM.net Company Profile |
SEC |
Zacks Reports |
StockTalk |
News |
Chart |
Request a new note
C
A N
S L
I M
|
MKTX
-
NASDAQ
Marketaxess Holdings Inc
FINANCIAL SERVICES - Investment Brokerage - Nationa
|
$26.93
|
+1.12
4.34% |
$27.35
|
374,207
132.14% of 50 DAV
50 DAV is 283,200
|
$30.95
-12.99%
|
7/29/2011
|
$25.87
|
PP = $26.35
|
|
MB = $27.67
|
Most Recent Note - 9/22/2011 3:40:24 PM
G - Rebounding near its 50 DMA line today with a gain on higher volume, bucking a widely negative market. Testing support at prior highs in the $26 area. It gapped down on 9/16/11 following news of a small Secondary Offering of 950,000 shares priced at $28.65.
>>> The latest Featured Stock Update with an annotated graph appeared on 9/2/2011. Click here.
View all notes |
Alert me of new notes |
CANSLIM.net Company Profile |
SEC |
Zacks Reports |
StockTalk |
News |
Chart |
Request a new note
C
A N
S L
I M
|
PCLN
-
NASDAQ
Priceline.Com Inc
INTERNET - Internet Software and Services
|
$505.57
|
-25.70
-4.84% |
$521.49
|
1,832,243
137.34% of 50 DAV
50 DAV is 1,334,100
|
$561.88
-10.02%
|
9/20/2011
|
$539.46
|
PP = $552.25
|
|
MB = $579.86
|
Most Recent Note - 9/22/2011 10:06:55 AM
Y - Gapped down today amid widespread market weakness, violating its 50 DMA line and raising concerns while trading near recent lows. It finished just below the mid-point of the session's range after highlighted in the 9/20/11 mid-day report (read here) in yellow with pivot point cited based on its 7/08/11 high plus 10 cents. A volume-driven gain did not yet trigger a proper technical buy signal. PCLN rebounded after a brief violation of its 200 DMA line during its choppy consolidation since it was dropped from the Featured Stocks list on 8/18/11.
>>> The latest Featured Stock Update with an annotated graph appeared on 9/22/2011. Click here.
View all notes |
Alert me of new notes |
CANSLIM.net Company Profile |
SEC |
Zacks Reports |
StockTalk |
News |
Chart |
Request a new note
C
A N
S L
I M
|
PSMT
-
NASDAQ
Pricesmart Inc
RETAIL - Drug Stores
|
$69.07
|
-1.74
-2.46% |
$70.69
|
317,665
107.39% of 50 DAV
50 DAV is 295,800
|
$75.16
-8.10%
|
8/30/2011
|
$63.01
|
PP = $62.37
|
|
MB = $65.49
|
Most Recent Note - 9/22/2011 4:09:03 PM
G - Today's 3rd consecutive loss came with near average volume. It is extended from its prior base. Prior highs and its 50 DMA line define support levels to watch on pullbacks.
>>> The latest Featured Stock Update with an annotated graph appeared on 9/14/2011. Click here.
View all notes |
Alert me of new notes |
CANSLIM.net Company Profile |
SEC |
Zacks Reports |
StockTalk |
News |
Chart |
Request a new note
C
A N
S L
I M
|
Symbol/Exchange
Company Name
Industry Group |
PRICE |
CHANGE
(%Change) |
Day High |
Volume
(% DAV)
(% 50 day avg vol) |
52 Wk Hi
% From Hi |
Featured
Date |
Price
Featured |
Pivot Featured |
|
Max Buy |
V
-
NYSE
Visa Inc Cl A
DIVERSIFIED SERVICES - Business/Management Services
|
$88.30
|
-3.12
-3.41% |
$90.00
|
8,922,106
149.98% of 50 DAV
50 DAV is 5,948,900
|
$94.75
-6.81%
|
9/20/2011
|
$93.91
|
PP = $90.93
|
|
MB = $95.48
|
Most Recent Note - 9/22/2011 1:20:12 PM
Y - Up from earlier lows after a gap down today amid widespread market weakness. It raised concerns by abruptly diving back into its prior base and testing support at its 50 DMA line. See the latest FSU analysis for more details and an annotated daily graph.
>>> The latest Featured Stock Update with an annotated graph appeared on 9/21/2011. Click here.
View all notes |
Alert me of new notes |
CANSLIM.net Company Profile |
SEC |
Zacks Reports |
StockTalk |
News |
Chart |
Request a new note
C
A N
S L
I M
|
|
|
|
THESE ARE NOT BUY RECOMMENDATIONS!
Comments contained in the body of this report are technical
opinions only. The material herein has been obtained
from sources believed to be reliable and accurate, however,
its accuracy and completeness cannot be guaranteed.
This site is not an investment advisor, hence it does
not endorse or recommend any securities or other investments.
Any recommendation contained in this report may not
be suitable for all investors and it is not to be deemed
an offer or solicitation on our part with respect to
the purchase or sale of any securities. All trademarks,
service marks and trade names appearing in this report
are the property of their respective owners, and are
likewise used for identification purposes only.
This report is a service available
only to active Paid Premium Members.
You may opt-out of receiving report notifications
at any time. Questions or comments may be submitted
by writing to Premium Membership Services 665 S.E. 10 Street, Suite 201 Deerfield Beach, FL 33441-5634 or by calling 1-800-965-8307
or 954-785-1121.
|
|
|

