You are not logged in.
This means you
CAN ONLY VIEW reports that were published prior to Tuesday, April 22, 2025.
You
MUST UPGRADE YOUR MEMBERSHIP if you want to see any current reports.
AFTER MARKET UPDATE - WEDNESDAY, SEPTEMBER 21ST, 2011
Previous After Market Report Next After Market Report >>>
|
|
|
|
DOW |
-283.82 |
11,124.84 |
-2.49% |
|
Volume |
1,210,408,930 |
+31% |
|
Volume |
2,122,959,860 |
+13% |
|
NASDAQ |
-52.05 |
2,538.19 |
-2.01% |
|
Advancers |
416 |
13% |
|
Advancers |
436 |
16% |
|
S&P 500 |
-35.33 |
1,166.76 |
-2.94% |
|
Decliners |
2,620 |
84% |
|
Decliners |
2,139 |
81% |
|
Russell 2000 |
-25.37 |
664.58 |
-3.68% |
|
52 Wk Highs |
16 |
|
|
52 Wk Highs |
10 |
|
|
S&P 600 |
-13.94 |
363.01 |
-3.70% |
|
52 Wk Lows |
284 |
|
|
52 Wk Lows |
278 |
|
|
 |
Major Averages Fall After Fed Cites "Significant Downside Risks"
Kenneth J. Gruneisen - Passed the CAN SLIM® Master's Exam
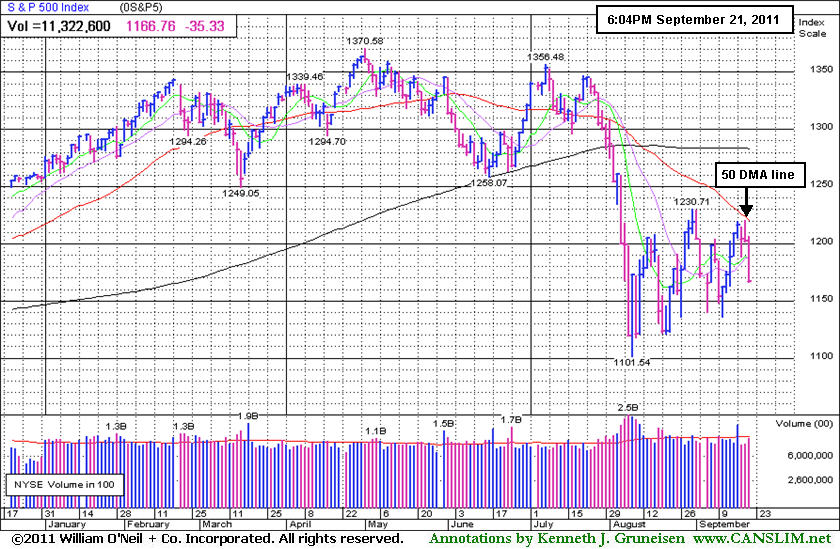
The major averages finished near the session lows after a sharp sell-off in the final hour following the Federal Reserve's statement that there are "significant downside risks" to the economic outlook. The reported volume totals were higher on the NYSE and on the Nasdaq exchange, indicating a clear increase in distributional pressure from large institutional investors. Declining issues beat advancers by 6-1 on the NYSE and by nearly 5-1 on the Nasdaq exchange. The new 52-week lows list expanded sharply and greatly outnumbered new 52-week highs on both the Nasdaq exchange and the NYSE. There were only 9 high-ranked companies from the CANSLIM.net Leaders List that made new 52-week highs and appeared on the CANSLIM.net BreakOuts Page, down from the prior session total of 40 stocks. The list of noteworthy buy candidates has recently expanded, but on Wednesday there were losses from all 16 of the high-ranked companies included on the Featured Stocks Page.
Cautious trading ahead of the Federal Reserve's 2:15 PM announcement was followed by disappointment after the Fed added the word "significant" to its prior comments concerning downside risk. Some traders were disappointed that the Fed's action was not more dramatic. In an action dubbed "Operation Twist" it aimed to push down long-term interest rates by purchasing long-term debt and selling short-term debt. The 10-year Treasury note rallied 22/32 to yield a record low 1.86%.
Bank of America Corp (BAC -7.5%) led financial shares lower after Moody's downgraded the long-term senior debt of the company. Eastern railroad stocks including Norfolk Southern Corp (NSC -8.31%) dropped as coal companies lowered their forecasts for Appalachian production. General Mills Inc (GIS +2.53%) rose after the food company posted quarterly earnings that beat forecasts.
Shares of several key technology stocks bucked the market's downdraft. Hewlett Packard Co (HPQ +6.72%) rose following reports the company may replace its chief executive officer. Adobe Systems Inc (ADBE +1.01%) and Oracle Corp (ORCL +4.20%) both reported better-than-expected results. Dow component Microsoft Corp (MSFT -3.67%) fell after the company raised its quarterly dividend +25% to 20 cents per share.
Homebuilding stocks slumped into the red with the broader market after initially rising following a report that August existing home sales increased 7.7% to a five-month high. Distressed properties were a high percentage of sales. The median price of a previously owned home dropped 5.1% from August of 2010.
The market environment (M criteria) remains in an uptrend despite recent pressure, and disciplined investors may carefully consider new buying efforts when all key criteria are satisfied. While it is encouraging that the major averages have been keeping the rally alive by staying well above their Day 1 (8/09/11) lows, a further expansion in leadership (new 52-week highs) remains crucial to any sustained advance.
The September 2011 issue of CANSLIM.net News will be available soon. The Q3 2011 Webcast has also been scheduled for Wednesday, September 28th at 8PM EST. Links to all prior reports and webcasts are available on the Premium Member Homepage.
PICTURED: The benchmark S&P 500 Index has not traded above its 50-day moving average (DMA) line since 8/01/11, and it has turned downward after recently challenging that important short-term average.
|
 Kenneth J. Gruneisen started out as a licensed stockbroker in August 1987, a couple of months prior to the historic stock market crash that took the Dow Jones Industrial Average down -22.6% in a single day. He has published daily fact-based fundamental and technical analysis on high-ranked stocks online for two decades. Through FACTBASEDINVESTING.COM, Kenneth provides educational articles, news, market commentary, and other information regarding proven investment systems that work in good times and bad.
Comments contained in the body of this report are technical opinions only and are not necessarily those of Gruneisen Growth Corp. The material herein has been obtained from sources believed to be reliable and accurate, however, its accuracy and completeness cannot be guaranteed. Our firm, employees, and customers may effect transactions, including transactions contrary to any recommendation herein, or have positions in the securities mentioned herein or options with respect thereto. Any recommendation contained in this report may not be suitable for all investors and it is not to be deemed an offer or solicitation on our part with respect to the purchase or sale of any securities. |
|
 |
Financial, Energy, Defensive Groups Led Broad Declines
Kenneth J. Gruneisen - Passed the CAN SLIM® Master's Exam
The financial group led the major averages lower as the Bank Index ($BKX -5.50%) and Broker/Dealer Index ($XBD -4.44%) suffered damaging losses. Weakness in energy-related shares pressured the Oil Services Index ($OSX -4.54%) and Integrated Oil Index ($XOI -4.05%). Defensively positioned investors received no reward as the Healthcare Index ($HMO -4.05%) and Gold & Silver Index ($XAU -2.83%) were also smacked with large losses. The Retail Index ($RLX -2.26%), and tech shares also fell as the Networking Index ($NWX -3.17%), Semiconductor Index ($SOX -1.98%), Internet Index ($IIX -1.95%), and Biotechnology Index ($BTK -1.55%) finished unanimously lower.
Charts courtesy www.stockcharts.com
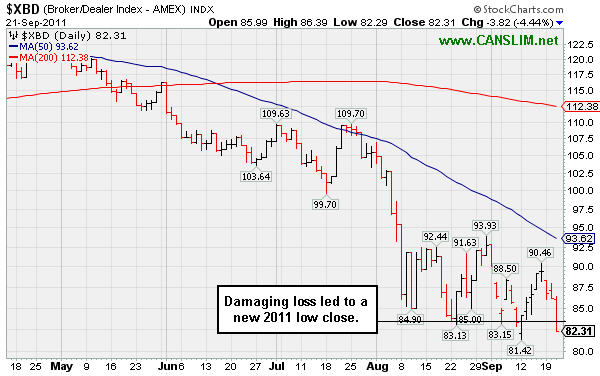
PICTURED 1: The Broker/Dealer Index ($XBD -4.44%) suffered a damaging loss as it sank to a new low close for 2011.
Charts courtesy www.stockcharts.com
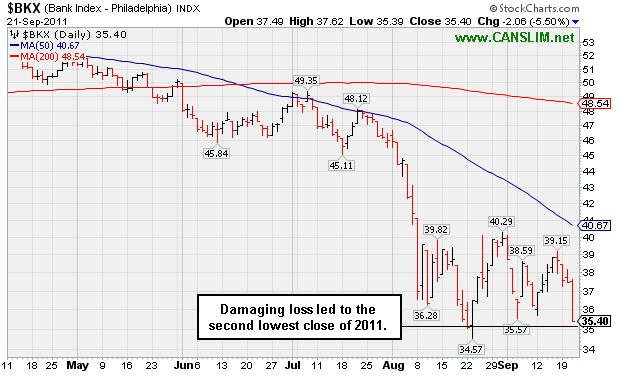
PICTURED 2: The Bank Index ($BKX -5.50%) suffered a damaging loss leading to its second lowest close of 2011. Regular readers of this commentary know the importance we have repeatedly placed on the financial group as a leading indicator for the broader market. If the financial groups can promptly make a stand near prior lows they may help to save the struggling rally, but additional losses from financials could signal that the broader market is in more serious trouble and may send the major averages down past the -20% threshold that marks a Bear Market.
| Oil Services |
$OSX |
219.08 |
-10.41 |
-4.54% |
-10.62% |
| Healthcare |
$HMO |
1,957.67 |
-82.58 |
-4.05% |
+15.70% |
| Integrated Oil |
$XOI |
1,084.32 |
-45.72 |
-4.05% |
-10.62% |
| Semiconductor |
$SOX |
365.37 |
-7.39 |
-1.98% |
-11.28% |
| Networking |
$NWX |
227.37 |
-7.44 |
-3.17% |
-18.96% |
| Internet |
$IIX |
277.31 |
-5.52 |
-1.95% |
-9.89% |
| Broker/Dealer |
$XBD |
82.31 |
-3.82 |
-4.44% |
-32.27% |
| Retail |
$RLX |
514.46 |
-11.90 |
-2.26% |
+1.20% |
| Gold & Silver |
$XAU |
213.80 |
-6.22 |
-2.83% |
-5.64% |
| Bank |
$BKX |
35.40 |
-2.06 |
-5.50% |
-32.20% |
| Biotech |
$BTK |
1,170.91 |
-18.38 |
-1.55% |
-9.76% |
|
|
|
 |
Leadership in Group Has Been a Reassuring Sign
Kenneth J. Gruneisen - Passed the CAN SLIM® Master's Exam
Often, when a leading stock is setting up to breakout of a solid base, it is highlighted in CANSLIM.net's Mid-Day Breakouts Report. The most relevant factors are noted in the report which allows prudent CANSLIM oriented investors to place the issue in their watch list. After doing any necessary backup research, the investor is prepared to act if and when the stock triggers a technical buy signal (breaks above its pivot point on more than +50% average turnover). In the event the stock fails to trigger a technical buy signal and its price declines then it will simply be removed from the watch list.
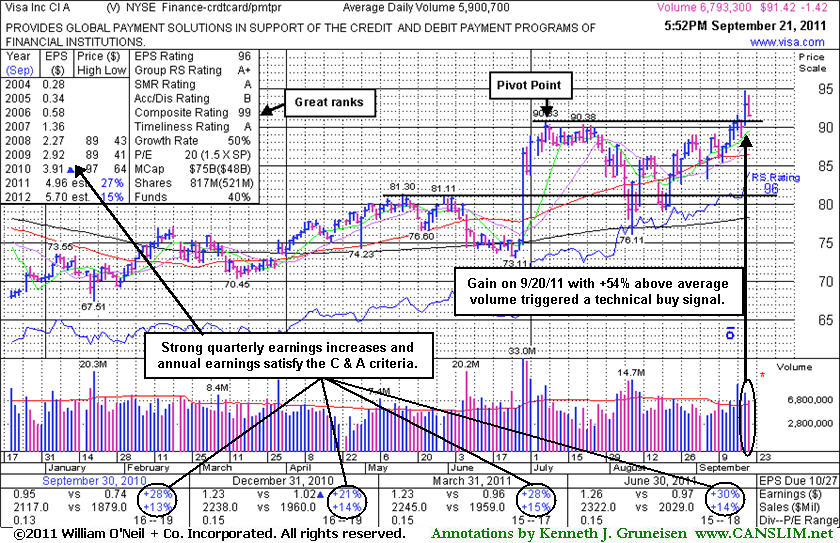
Visa Inc (V -$1.42 or -1.53% to $91.42) pulled back today with volume slightly above average. It was featured in yellow in the 9/20/11 mid-day report with a pivot point based on its 7/07/11 high plus 10 cents. Its considerable closing gain for a new all-time high was ultimately backed by volume +54% above average. That technically triggered a buy signal by clearing an 11-week base during which it found impressive support near its longer-term 200 DMA line. Its quarterly and annual earnings history has been strong enough to satisfy the C and A criteria. The number of top-rated funds owning its shares rose from 1,878 in Dec '10 to 2,040 in Jun '11, a reassuring sign concerning the I criteria, however it is already well known by the institutional crowd. Leadership shown by at least one other well-known firm in the Finance - Credit Card Payment Processing firm (L criteria) has been a reassuring sign.
Disciplined investors always limit losses by selling if ever any stock falls -7% from their purchase price. Otherwise, if leaving the risk un-contained, the damage can become more severe and undisciplined investors must be prepared to suffer the painful consequences. Keep in mind that the M criteria tells us that typically 3 out of 4 stocks move in the same direction of the major averages, and the rally has been coming under pressure recently, hurting investors chances for landing great gains.
|
|
|
Color Codes Explained :
Y - Better candidates highlighted by our
staff of experts.
G - Previously featured
in past reports as yellow but may no longer be buyable under the
guidelines.
***Last / Change / Volume data in this table is the closing quote data***
Symbol/Exchange
Company Name
Industry Group |
PRICE |
CHANGE
(%Change) |
Day High |
Volume
(% DAV)
(% 50 day avg vol) |
52 Wk Hi
% From Hi |
Featured
Date |
Price
Featured |
Pivot Featured |
|
Max Buy |
AAPL
-
NASDAQ
Apple Inc
COMPUTER HARDWARE - Personal Computers
|
$412.14
|
-1.31
-0.32% |
$421.59
|
21,624,310
97.62% of 50 DAV
50 DAV is 22,152,300
|
$422.86
-2.54%
|
9/16/2011
|
$399.14
|
PP = $404.60
|
|
MB = $424.83
|
Most Recent Note - 9/20/2011 12:14:05 PM
Y - Gapped up today following a finish near the session high on the prior session after rallying to a new all-time high with +36% above average volume behind a 6th consecutive gain. It is already heavily owned by the institutional crowd, and ownership by top-rated funds fell from 4,366 in Mar '11 to 4,343 in Jun '11. See the latest FSU analysis for more details and a new annotated graph.
>>> The latest Featured Stock Update with an annotated graph appeared on 9/19/2011. Click here.
View all notes |
Alert me of new notes |
CANSLIM.net Company Profile |
SEC |
Zacks Reports |
StockTalk |
News |
Chart |
Request a new note
C
A N
S L
I M


|
ALXN
-
NASDAQ
Alexion Pharmaceuticals
DRUGS - Drug Manufacturers - Other
|
$65.71
|
-0.49
-0.74% |
$67.75
|
2,181,191
136.47% of 50 DAV
50 DAV is 1,598,300
|
$66.90
-1.78%
|
9/15/2011
|
$63.20
|
PP = $60.81
|
|
MB = $63.85
|
Most Recent Note - 9/20/2011 12:20:47 PM
G - Color code was changed to green after rallying well above its "max buy" level. Prior resistance in the $59-60 area defines initial support to watch on pullbacks.
>>> The latest Featured Stock Update with an annotated graph appeared on 9/15/2011. Click here.
View all notes |
Alert me of new notes |
CANSLIM.net Company Profile |
SEC |
Zacks Reports |
StockTalk |
News |
Chart |
Request a new note
C
A N
S L
I M
|
ATHN
-
NASDAQ
Athenahealth Inc
DIVERSIFIED SERVICES - Business/Management Services
|
$65.88
|
-2.43
-3.56% |
$69.59
|
1,279,014
161.80% of 50 DAV
50 DAV is 790,500
|
$72.70
-9.38%
|
9/8/2011
|
$61.93
|
PP = $61.78
|
|
MB = $64.87
|
 Most Recent Note - 9/21/2011 6:31:49 PM
G - Finished near the session low today with a 2nd consecutive loss with above average volume. It is extended from its prior base. Prior highs in the $61 area define initial support on pullbacks.
>>> The latest Featured Stock Update with an annotated graph appeared on 9/8/2011. Click here.
View all notes |
Alert me of new notes |
CANSLIM.net Company Profile |
SEC |
Zacks Reports |
StockTalk |
News |
Chart |
Request a new note
C
A N
S L
I M
|
CELG
-
NASDAQ
Celgene Corp
DRUGS - Drug Manufacturers - Major
|
$63.80
|
-1.76
-2.68% |
$65.83
|
5,721,559
143.24% of 50 DAV
50 DAV is 3,994,500
|
$65.86
-3.12%
|
9/16/2011
|
$61.21
|
PP = $62.59
|
|
MB = $65.72
|
Most Recent Note - 9/21/2011 6:33:59 PM
Y - Pulled back today for a loss with above average volume and closed near the session low after trading near its "max buy" level earlier. Its considerable gain on 9/20/11 with more than 3 times average volume triggered a technical buy signal as it spiked to a new 52-week high and rallied above previously stubborn resistance in the $62 area. Disciplined investors use a tactic called "pyramiding" to avoid chasing stocks more than +5% above prior highs. See the latest FSU analysis for more details and an annotated weekly graph.
>>> The latest Featured Stock Update with an annotated graph appeared on 9/16/2011. Click here.
View all notes |
Alert me of new notes |
CANSLIM.net Company Profile |
SEC |
Zacks Reports |
StockTalk |
News |
Chart |
Request a new note
C
A N
S L
I M
|
CPA
-
NYSE
Copa Holdings Sa
TRANSPORTATION - Regional Airlines
|
$67.46
|
-3.15
-4.46% |
$70.87
|
478,479
165.62% of 50 DAV
50 DAV is 288,900
|
$72.86
-7.41%
|
9/21/2011
|
$69.67
|
PP = $72.86
|
|
MB = $76.50
|
Most Recent Note - 9/21/2011 6:43:24 PM
Y - Finished at the session low today after a damaging loss with above average volume. While forming a high handle following a 10-week cup shaped base pattern it was highlighted in yellow in today's mid-day report with a pivot point based on its 9/14/11 high. It is normally best if the volume totals are light while a "handle" is formed, so the distributional loss it suffered may not bode well. Additionally, as it was noted earlier - "Confirming gains with heavy volume for a new high close are needed before disciplined investors might consider this high-ranked Panama-based airline a legitimate buy candidate. Found support above its 200 DMA line and prior highs in the $59 area during its recent consolidation. It is hovering near its 52-week high and within close striking distance of its 2007 all-time high ($73.33). Reported earnings +52% on +41% sales revenues for the quarter ended June 30, 2011 versus the year ago period. Sales revenues and earnings have improved in the 3 most recent quarterly comparisons (Dec '10, Mar and Jun '11) after a streak of negative or weak comparisons. Annual earnings (the A criteria) growth has been good, and increasing institutional ownership (the I criteria) is an encouraging sign.

There are no Featured Stock Updates™ available for this stock at this time. You may request one by clicking the Request a New Note link below
View all notes |
Alert me of new notes |
CANSLIM.net Company Profile |
SEC |
Zacks Reports |
StockTalk |
News |
Chart |
Request a new note
C
A N
S L
I M
|
Symbol/Exchange
Company Name
Industry Group |
PRICE |
CHANGE
(%Change) |
Day High |
Volume
(% DAV)
(% 50 day avg vol) |
52 Wk Hi
% From Hi |
Featured
Date |
Price
Featured |
Pivot Featured |
|
Max Buy |
DMND
-
NASDAQ
Diamond Foods Inc
FOOD and; BEVERAGE - Processed and; Packaged Goods
|
$91.91
|
-0.56
-0.61% |
$96.13
|
723,060
247.88% of 50 DAV
50 DAV is 291,700
|
$93.33
-1.52%
|
9/13/2011
|
$75.57
|
PP = $80.16
|
|
MB = $84.17
|
Most Recent Note - 9/21/2011 12:48:42 PM
G - Hit another new all-time high today before reversing into the red. It is extended from its latest sound base pattern, and prior highs in the $80 area define initial chart support to watch on pullbacks.
>>> The latest Featured Stock Update with an annotated graph appeared on 9/13/2011. Click here.
View all notes |
Alert me of new notes |
CANSLIM.net Company Profile |
SEC |
Zacks Reports |
StockTalk |
News |
Chart |
Request a new note
C
A N
S L
I M
|
EXLS
-
NASDAQ
Exlservice Holdings Inc
DIVERSIFIED SERVICES - Business/Management Services
|
$22.75
|
-0.04
-0.18% |
$22.85
|
254,505
134.59% of 50 DAV
50 DAV is 189,100
|
$26.55
-14.31%
|
8/2/2011
|
$24.85
|
PP = $24.85
|
|
MB = $26.09
|
Most Recent Note - 9/20/2011 4:27:11 PM
G - Churning above average volume while still holding its ground above its 200 DMA line following its damaging 9/13/11 gap down. Priced its previously noted Secondary Offering at $23.00. A rebound above its 50 DMA line would help its outlook.
>>> The latest Featured Stock Update with an annotated graph appeared on 9/7/2011. Click here.
View all notes |
Alert me of new notes |
CANSLIM.net Company Profile |
SEC |
Zacks Reports |
StockTalk |
News |
Chart |
Request a new note
C
A N
S L
I M
|
FCFS
-
NASDAQ
First Cash Financial Svs
SPECIALTY RETAIL - Specialty Retail, Other
|
$49.13
|
-1.23
-2.44% |
$50.79
|
395,178
103.23% of 50 DAV
50 DAV is 382,800
|
$52.18
-5.85%
|
5/31/2011
|
$42.00
|
PP = $40.23
|
|
MB = $42.24
|
Most Recent Note - 9/20/2011 4:00:27 PM
G - Touched another new all-time high today then reversed into the red for a small loss on below average volume. It is extended from its prior base, and its 50 DMA line defines support to watch.
>>> The latest Featured Stock Update with an annotated graph appeared on 9/6/2011. Click here.
View all notes |
Alert me of new notes |
CANSLIM.net Company Profile |
SEC |
Zacks Reports |
StockTalk |
News |
Chart |
Request a new note
C
A N
S L
I M
|
JAZZ
-
NASDAQ
Jazz Pharmaceuticals Inc
DRUGS - Biotechnology
|
$45.98
|
-0.82
-1.75% |
$47.88
|
1,062,116
113.35% of 50 DAV
50 DAV is 937,000
|
$47.88
-3.97%
|
9/20/2011
|
$46.56
|
PP = $44.63
|
|
MB = $46.86
|
Most Recent Note - 9/20/2011 5:54:07 PM
Y - Hit a new all-time high today with more than 3 times average volume after news it plans to take over Dublin-based Azur Pharma Ltd in a deal to add a new (N criteria) pain drug and diversify its product portfolio. It was highlighted in yellow in the earlier mid-day report (read here) while rising from a "3-weeks tight" pattern, and its strong finish for a solid gain into new high territory triggered a technical buy signal. Ownership by top-rated funds rose from 117 in Jun '10 to 246 in Jun '11, a reassuring sign concerning the I criteria. See the latest FSU analysis for more details and an annotated weekly graph.
>>> The latest Featured Stock Update with an annotated graph appeared on 9/20/2011. Click here.
View all notes |
Alert me of new notes |
CANSLIM.net Company Profile |
SEC |
Zacks Reports |
StockTalk |
News |
Chart |
Request a new note
C
A N
S L
I M
|
JCOM
-
NASDAQ
J 2 Global Communication
INTERNET - Internet Software and Services
|
$29.93
|
-0.32
-1.06% |
$30.59
|
1,019,050
230.92% of 50 DAV
50 DAV is 441,300
|
$32.67
-8.40%
|
8/8/2011
|
$30.38
|
PP = $29.31
|
|
MB = $30.78
|
Most Recent Note - 9/20/2011 4:35:36 PM
G - Closed near the session low today with light volume behind its 3rd consecutive loss since touching a new 52-week high. Previous highs in the $30-31 area define initial chart support to watch above its closely coinciding 50 and 200 DMA lines.
>>> The latest Featured Stock Update with an annotated graph appeared on 8/29/2011. Click here.
View all notes |
Alert me of new notes |
CANSLIM.net Company Profile |
SEC |
Zacks Reports |
StockTalk |
News |
Chart |
Request a new note
C
A N
S L
I M
|
Symbol/Exchange
Company Name
Industry Group |
PRICE |
CHANGE
(%Change) |
Day High |
Volume
(% DAV)
(% 50 day avg vol) |
52 Wk Hi
% From Hi |
Featured
Date |
Price
Featured |
Pivot Featured |
|
Max Buy |
MA
-
NYSE
Mastercard Inc Cl A
DIVERSIFIED SERVICES - Business/Management Services
|
$340.97
|
-12.81
-3.62% |
$356.48
|
1,418,187
90.39% of 50 DAV
50 DAV is 1,568,900
|
$361.94
-5.79%
|
8/3/2011
|
$324.82
|
PP = $322.38
|
|
MB = $338.50
|
Most Recent Note - 9/21/2011 3:59:51 PM
G - Pulling back on light volume today, retreating from an all-time high hit on the prior session. It is extended from prior chart highs in the $340 area that define initial support above its 50 DMA line.
>>> The latest Featured Stock Update with an annotated graph appeared on 9/12/2011. Click here.
View all notes |
Alert me of new notes |
CANSLIM.net Company Profile |
SEC |
Zacks Reports |
StockTalk |
News |
Chart |
Request a new note
C
A N
S L
I M
|
MG
-
NYSE
Mistras Group Inc
DIVERSIFIED SERVICES - Bulding and Faci;ity Management Services
|
$18.26
|
-0.38
-2.04% |
$18.89
|
139,406
77.19% of 50 DAV
50 DAV is 180,600
|
$20.82
-12.30%
|
8/10/2011
|
$17.89
|
PP = $17.58
|
|
MB = $18.46
|
Most Recent Note - 9/20/2011 3:58:33 PM
G - Down considerably today without heavy volume, slumping toward prior resistance in the $18 area and its 50 DMA line previously noted as important chart support to watch on pullbacks.
>>> The latest Featured Stock Update with an annotated graph appeared on 9/9/2011. Click here.
View all notes |
Alert me of new notes |
CANSLIM.net Company Profile |
SEC |
Zacks Reports |
StockTalk |
News |
Chart |
Request a new note
C
A N
S L
I M
|
MKTX
-
NASDAQ
Marketaxess Holdings Inc
FINANCIAL SERVICES - Investment Brokerage - Nationa
|
$25.81
|
-1.36
-5.01% |
$27.52
|
200,649
71.51% of 50 DAV
50 DAV is 280,600
|
$30.95
-16.60%
|
7/29/2011
|
$25.87
|
PP = $26.35
|
|
MB = $27.67
|
Most Recent Note - 9/21/2011 3:57:54 PM
G - Violated its 50 DMA line today with a loss on light volume, raising concerns. Testing support at prior highs in the $26 area. It gapped down on 9/16/11 following news of a small Secondary Offering of 950,000 shares priced at $28.65.
>>> The latest Featured Stock Update with an annotated graph appeared on 9/2/2011. Click here.
View all notes |
Alert me of new notes |
CANSLIM.net Company Profile |
SEC |
Zacks Reports |
StockTalk |
News |
Chart |
Request a new note
C
A N
S L
I M
|
PCLN
-
NASDAQ
Priceline.Com Inc
INTERNET - Internet Software and Services
|
$531.27
|
-5.97
-1.11% |
$549.96
|
1,137,311
85.25% of 50 DAV
50 DAV is 1,334,100
|
$561.88
-5.45%
|
9/20/2011
|
$539.46
|
PP = $552.25
|
|
MB = $579.86
|
Most Recent Note - 9/20/2011 4:32:49 PM
Y - Perched within close striking distance of its 52-week high. It finished just below the mid-point of the session's range after highlighted in the earlier mid-day report (read here) in yellow with pivot point cited based on its 7/08/11 high plus 10 cents. A volume-driven gain may trigger a technical buy signal. PCLN rebounded after a brief violation of its 200 DMA line during its choppy consolidation since it was dropped from the Featured Stocks list on 8/18/11.
>>> The latest Featured Stock Update with an annotated graph appeared on 8/12/2011. Click here.
View all notes |
Alert me of new notes |
CANSLIM.net Company Profile |
SEC |
Zacks Reports |
StockTalk |
News |
Chart |
Request a new note
C
A N
S L
I M
|
PSMT
-
NASDAQ
Pricesmart Inc
RETAIL - Drug Stores
|
$70.81
|
-1.75
-2.41% |
$74.28
|
366,952
123.01% of 50 DAV
50 DAV is 298,300
|
$75.16
-5.79%
|
8/30/2011
|
$63.01
|
PP = $62.37
|
|
MB = $65.49
|
Most Recent Note - 9/20/2011 4:23:26 PM
G - Today's loss on light volume snapped a streak of 10 consecutive gains backed by above average volume. It is extended from its prior base. Prior highs and its 50 DMA line define support levels to watch on pullbacks.
>>> The latest Featured Stock Update with an annotated graph appeared on 9/14/2011. Click here.
View all notes |
Alert me of new notes |
CANSLIM.net Company Profile |
SEC |
Zacks Reports |
StockTalk |
News |
Chart |
Request a new note
C
A N
S L
I M
|
Symbol/Exchange
Company Name
Industry Group |
PRICE |
CHANGE
(%Change) |
Day High |
Volume
(% DAV)
(% 50 day avg vol) |
52 Wk Hi
% From Hi |
Featured
Date |
Price
Featured |
Pivot Featured |
|
Max Buy |
V
-
NYSE
Visa Inc Cl A
DIVERSIFIED SERVICES - Business/Management Services
|
$91.42
|
-1.42
-1.53% |
$94.13
|
7,017,559
118.93% of 50 DAV
50 DAV is 5,900,700
|
$94.75
-3.51%
|
9/20/2011
|
$93.91
|
PP = $90.93
|
|
MB = $95.48
|
Most Recent Note - 9/21/2011 7:12:54 PM
Y - Pulled back today with volume near average. Its considerable gain for a new all-time high with volume +54% above average helped it break out from an 11-week base and trigger a technical buy signal on the prior session. See the latest FSU analysis for more details and an annotated daily graph.
>>> The latest Featured Stock Update with an annotated graph appeared on 9/21/2011. Click here.
View all notes |
Alert me of new notes |
CANSLIM.net Company Profile |
SEC |
Zacks Reports |
StockTalk |
News |
Chart |
Request a new note
C
A N
S L
I M
|
|
|
|
THESE ARE NOT BUY RECOMMENDATIONS!
Comments contained in the body of this report are technical
opinions only. The material herein has been obtained
from sources believed to be reliable and accurate, however,
its accuracy and completeness cannot be guaranteed.
This site is not an investment advisor, hence it does
not endorse or recommend any securities or other investments.
Any recommendation contained in this report may not
be suitable for all investors and it is not to be deemed
an offer or solicitation on our part with respect to
the purchase or sale of any securities. All trademarks,
service marks and trade names appearing in this report
are the property of their respective owners, and are
likewise used for identification purposes only.
This report is a service available
only to active Paid Premium Members.
You may opt-out of receiving report notifications
at any time. Questions or comments may be submitted
by writing to Premium Membership Services 665 S.E. 10 Street, Suite 201 Deerfield Beach, FL 33441-5634 or by calling 1-800-965-8307
or 954-785-1121.
|
|
|

