***Last / Change / Volume data in this table is the closing quote data***
Symbol/Exchange
Company Name
Industry Group |
PRICE |
CHANGE
(%Change) |
Day High |
Volume
(% DAV)
(% 50 day avg vol) |
52 Wk Hi
% From Hi |
Featured
Date |
Price
Featured |
Pivot Featured |
|
Max Buy |
ABV
-
NYSE
Comp De Bebidas Adr
FOOD and BEVERAGE - Beverages - Brewers
|
$119.85
|
-1.55
-1.28% |
$120.36
|
584,053
96.46% of 50 DAV
50 DAV is 605,500
|
$122.49
-2.16%
|
6/29/2010
|
$104.74
|
PP = $109.33
|
|
MB = $114.80
|
Most Recent Note - 9/17/2010 4:19:00 PM
G - This Brazil-based beverage firm hit another new all-time high today. Extended from a sound base, its prior highs in the $111-112 area define support above its 50 DMA line.
>>> The latest Featured Stock Update with an annotated graph appeared on 8/18/2010. Click here.
View all notes |
Alert me of new notes |
CANSLIM.net Company Profile |
SEC |
Zacks Reports |
StockTalk |
News |
Chart |
Request a new note
C
A N
S L
I M


|
ARUN
-
NASDAQ
Aruba Networks Inc
COMPUTER HARDWARE - Networking andamp; Communication Dev
|
$21.96
|
+1.07
5.12% |
$22.17
|
3,803,730
195.85% of 50 DAV
50 DAV is 1,942,200
|
$21.29
3.15%
|
8/30/2010
|
$18.12
|
PP = $18.51
|
|
MB = $19.44
|
 Most Recent Note - 9/21/2010 12:20:53 PM
G - Hitting yet another new 52-week high today, getting more extended from its latest base. Prior highs near $18 define a chart support level to watch.
>>> The latest Featured Stock Update with an annotated graph appeared on 9/2/2010. Click here.
View all notes |
Alert me of new notes |
CANSLIM.net Company Profile |
SEC |
Zacks Reports |
StockTalk |
News |
Chart |
Request a new note
C
A N
S L
I M
|
BIDU
-
NASDAQ
Baidu Inc Ads
INTERNET - Internet Information Providers
|
$91.19
|
+1.32
1.47% |
$92.31
|
13,457,400
143.77% of 50 DAV
50 DAV is 9,360,100
|
$90.00
1.32%
|
9/17/2010
|
$85.73
|
PP = $88.42
|
|
MB = $92.84
|
Most Recent Note - 9/21/2010 12:32:15 PM
Y - Up again today after volume on the prior session was +40% above average and it rose above its pivot point for a new all-time high from a 6-week consolidation. The technical breakout is noted as a riskier "late stage" base.
>>> The latest Featured Stock Update with an annotated graph appeared on 8/13/2010. Click here.
View all notes |
Alert me of new notes |
CANSLIM.net Company Profile |
SEC |
Zacks Reports |
StockTalk |
News |
Chart |
Request a new note
C
A N
S L
I M
|
CACC
-
NASDAQ
Credit Acceptance Corp
FINANCIAL SERVICES - Credit Services
|
$60.19
|
-2.05
-3.29% |
$62.03
|
39,264
81.29% of 50 DAV
50 DAV is 48,300
|
$63.45
-5.14%
|
7/29/2010
|
$52.04
|
PP = $54.07
|
|
MB = $56.77
|
Most Recent Note - 9/21/2010 4:47:15 PM
G - Loss on light volume today, finishing under its old high closes and slumping back into the previous short (4-week) flat base. An upward trendline defines support above its 50 DMA line and its recent chart low ($56.06).
>>> The latest Featured Stock Update with an annotated graph appeared on 8/2/2010. Click here.
View all notes |
Alert me of new notes |
CANSLIM.net Company Profile |
SEC |
Zacks Reports |
StockTalk |
News |
Chart |
Request a new note
C
A N
S L
I M
|
CMG
-
NYSE
Chipotle Mexican Grill
LEISURE - Restaurants
|
$168.31
|
-1.82
-1.07% |
$171.46
|
457,673
64.75% of 50 DAV
50 DAV is 706,800
|
$170.95
-1.54%
|
9/1/2010
|
$158.31
|
PP = $155.52
|
|
MB = $163.30
|
Most Recent Note - 9/20/2010 5:42:20 PM
G - Gain today with below average volume for a new all-time high. Extended from prior highs in the $155 area that define chart support.
>>> The latest Featured Stock Update with an annotated graph appeared on 9/1/2010. Click here.
View all notes |
Alert me of new notes |
CANSLIM.net Company Profile |
SEC |
Zacks Reports |
StockTalk |
News |
Chart |
Request a new note
C
A N
S L
I M
|
Symbol/Exchange
Company Name
Industry Group |
PRICE |
CHANGE
(%Change) |
Day High |
Volume
(% DAV)
(% 50 day avg vol) |
52 Wk Hi
% From Hi |
Featured
Date |
Price
Featured |
Pivot Featured |
|
Max Buy |
CRM
-
NYSE
Salesforce.Com Inc
INTERNET - Internet Software and Services
|
$121.39
|
-1.75
-1.42% |
$122.91
|
2,334,133
90.11% of 50 DAV
50 DAV is 2,590,400
|
$123.77
-1.92%
|
6/2/2010
|
$88.44
|
PP = $89.60
|
|
MB = $94.08
|
Most Recent Note - 9/20/2010 2:35:58 PM
G - Gain today has it rising from an advanced "3-weeks tight" type pattern to a new all-time high, however volume is not especially heavy behind its considerable gain and a new pivot point is not being cited.
>>> The latest Featured Stock Update with an annotated graph appeared on 8/16/2010. Click here.
View all notes |
Alert me of new notes |
CANSLIM.net Company Profile |
SEC |
Zacks Reports |
StockTalk |
News |
Chart |
Request a new note
C
A N
S L
I M
|
EGO
-
NYSE
Eldorado Gold Corp
METALS and MINING - Gold
|
$18.89
|
-0.31
-1.61% |
$19.04
|
9,743,956
235.73% of 50 DAV
50 DAV is 4,133,600
|
$20.23
-6.62%
|
8/19/2010
|
$18.25
|
PP = $19.17
|
|
MB = $20.13
|
Most Recent Note - 9/21/2010 5:07:48 PM
Y - Down today for a 3rd consecutive a loss with above average volume, encountering heavy distributional pressure. Its close near the session high was an encouraging sign of support after pulling back under its pivot point near prior highs in the $18-19.
>>> The latest Featured Stock Update with an annotated graph appeared on 8/19/2010. Click here.
View all notes |
Alert me of new notes |
CANSLIM.net Company Profile |
SEC |
Zacks Reports |
StockTalk |
News |
Chart |
Request a new note
C
A N
S L
I M
|
FFIV
-
NASDAQ
F 5 Networks Inc
INTERNET - Internet Software and Services
|
$103.38
|
-1.26
-1.20% |
$104.91
|
1,453,396
87.90% of 50 DAV
50 DAV is 1,653,500
|
$105.20
-1.73%
|
6/16/2010
|
$74.50
|
PP = $74.10
|
|
MB = $77.81
|
Most Recent Note - 9/20/2010 2:40:39 PM
G - Today's 4th consecutive gain with below average volume helped it hit another new all-time high. Steep upward trendline connecting July-August lows defines an initial chart support level well above its 50 DMA line.
>>> The latest Featured Stock Update with an annotated graph appeared on 9/13/2010. Click here.
View all notes |
Alert me of new notes |
CANSLIM.net Company Profile |
SEC |
Zacks Reports |
StockTalk |
News |
Chart |
Request a new note
C
A N
S L
I M
|
FOSL
-
NASDAQ
Fossil Inc
CONSUMER DURABLES - Recreational Goods, Other
|
$51.84
|
-0.59
-1.13% |
$52.64
|
1,069,663
143.06% of 50 DAV
50 DAV is 747,700
|
$52.57
-1.38%
|
8/10/2010
|
$45.54
|
PP = $42.69
|
|
MB = $44.82
|
Most Recent Note - 9/20/2010 2:28:10 PM
G - Gain today with below average volume for another new all-time high. Extended from any sound base after a recent streak of gains, its prior high in the $46 area defines support to watch.
>>> The latest Featured Stock Update with an annotated graph appeared on 8/11/2010. Click here.
View all notes |
Alert me of new notes |
CANSLIM.net Company Profile |
SEC |
Zacks Reports |
StockTalk |
News |
Chart |
Request a new note
C
A N
S L
I M
|
GMCR
-
NASDAQ
Green Mtn Coffee Roastrs
FOOD and BEVERAGE - Processed and Packaged Goods
|
$37.00
|
+1.03
2.86% |
$37.32
|
3,474,347
142.83% of 50 DAV
50 DAV is 2,432,500
|
$36.55
1.23%
|
8/17/2010
|
$33.62
|
PP = $33.30
|
|
MB = $34.97
|
Most Recent Note - 9/21/2010 4:57:56 PM
G - Hit yet another new 52-week high today. It is extended from its prior highs in the $33 area that define support to watch.
>>> The latest Featured Stock Update with an annotated graph appeared on 8/17/2010. Click here.
View all notes |
Alert me of new notes |
CANSLIM.net Company Profile |
SEC |
Zacks Reports |
StockTalk |
News |
Chart |
Request a new note
C
A N
S L
I M
|
Symbol/Exchange
Company Name
Industry Group |
PRICE |
CHANGE
(%Change) |
Day High |
Volume
(% DAV)
(% 50 day avg vol) |
52 Wk Hi
% From Hi |
Featured
Date |
Price
Featured |
Pivot Featured |
|
Max Buy |
HS
-
NYSE
Healthspring Inc
HEALTH SERVICES - Health Care Plans
|
$24.27
|
+0.92
3.94% |
$24.64
|
1,178,309
181.39% of 50 DAV
50 DAV is 649,600
|
$23.47
3.41%
|
8/27/2010
|
$19.91
|
PP = $19.75
|
|
MB = $20.74
|
Most Recent Note - 9/21/2010 12:43:07 PM
G - Solid gain today for a new 52-week high, getting very extended from its prior base. Support to watch now is prior chart highs in the $19-20 area.
>>> The latest Featured Stock Update with an annotated graph appeared on 8/27/2010. Click here.
View all notes |
Alert me of new notes |
CANSLIM.net Company Profile |
SEC |
Zacks Reports |
StockTalk |
News |
Chart |
Request a new note
C
A N
S L
I M
|
IGTE
-
NASDAQ
Igate Corp
COMPUTER SOFTWARE and SERVICES - Information Technology Service
|
$19.00
|
-0.17
-0.89% |
$19.42
|
693,965
166.46% of 50 DAV
50 DAV is 416,900
|
$19.45
-2.31%
|
9/8/2010
|
$17.29
|
PP = $18.26
|
|
MB = $19.17
|
Most Recent Note - 9/21/2010 12:47:04 PM
Y - Holding its ground today following 2 consecutive gains with above average volume. It found prompt support at its 50 DMA line and followed through to new highs, reconfirming its prior breakout.
>>> The latest Featured Stock Update with an annotated graph appeared on 9/10/2010. Click here.
View all notes |
Alert me of new notes |
CANSLIM.net Company Profile |
SEC |
Zacks Reports |
StockTalk |
News |
Chart |
Request a new note
C
A N
S L
I M
|
JOBS
-
NASDAQ
Fifty One Job Inc Ads
DIVERSIFIED SERVICES - Staffing and; Outsourcing Service
|
$36.95
|
+1.59
4.50% |
$36.99
|
415,514
367.06% of 50 DAV
50 DAV is 113,200
|
$36.19
2.10%
|
9/16/2010
|
$31.59
|
PP = $30.40
|
|
MB = $31.92
|
Most Recent Note - 9/21/2010 4:52:54 PM
G - Posted another big gain today with heavy volume. Very extended from a sound base, its prior highs in the $30 area define chart support now.
>>> The latest Featured Stock Update with an annotated graph appeared on 9/16/2010. Click here.
View all notes |
Alert me of new notes |
CANSLIM.net Company Profile |
SEC |
Zacks Reports |
StockTalk |
News |
Chart |
Request a new note
C
A N
S L
I M
|
MELI
-
NASDAQ
Mercadolibre Inc
INTERNET - Internet Software and; Services
|
$72.18
|
-0.55
-0.76% |
$73.80
|
620,224
74.24% of 50 DAV
50 DAV is 835,400
|
$74.78
-3.48%
|
5/13/2010
|
$54.21
|
PP = $55.85
|
|
MB = $58.64
|
Most Recent Note - 9/17/2010 10:18:51 AM
G - Gapped down today. In recent weeks it wedged to new high ground with light volume behind gains as it got extended from a sound base. Its 50 DMA line defines important chart support.
>>> The latest Featured Stock Update with an annotated graph appeared on 8/26/2010. Click here.
View all notes |
Alert me of new notes |
CANSLIM.net Company Profile |
SEC |
Zacks Reports |
StockTalk |
News |
Chart |
Request a new note
C
A N
S L
I M
|
MRX
-
NYSE
Medicis Pharmaceut Cl A
DRUGS - Biotechnology
|
$30.24
|
+0.39
1.31% |
$30.29
|
1,763,589
147.59% of 50 DAV
50 DAV is 1,194,900
|
$30.26
-0.07%
|
8/12/2010
|
$26.88
|
PP = $26.71
|
|
MB = $28.05
|
Most Recent Note - 9/20/2010 5:23:56 PM
G - Gain today with near average volume for a new 2010 high close. Prior highs in the $28 area define the initial chart support level to watch.
>>> The latest Featured Stock Update with an annotated graph appeared on 8/12/2010. Click here.
View all notes |
Alert me of new notes |
CANSLIM.net Company Profile |
SEC |
Zacks Reports |
StockTalk |
News |
Chart |
Request a new note
C
A N
S L
I M
|
Symbol/Exchange
Company Name
Industry Group |
PRICE |
CHANGE
(%Change) |
Day High |
Volume
(% DAV)
(% 50 day avg vol) |
52 Wk Hi
% From Hi |
Featured
Date |
Price
Featured |
Pivot Featured |
|
Max Buy |
MWIV
-
NASDAQ
M W I Veterinary Supply
HEALTH SERVICES - Medical Instruments and; Supplies
|
$57.80
|
+0.30
0.52% |
$57.99
|
109,606
150.15% of 50 DAV
50 DAV is 73,000
|
$57.50
0.52%
|
7/29/2010
|
$52.05
|
PP = $52.09
|
|
MB = $54.69
|
Most Recent Note - 9/20/2010 2:26:58 PM
G - Gain today has it quietly rising further above its "max buy" level, poised for a new high close. Its 50 DMA line defines important chart support.
>>> The latest Featured Stock Update with an annotated graph appeared on 9/7/2010. Click here.
View all notes |
Alert me of new notes |
CANSLIM.net Company Profile |
SEC |
Zacks Reports |
StockTalk |
News |
Chart |
Request a new note
C
A N
S L
I M
|
NEM
-
NYSE
Newmont Mining Corp
METALS and MINING - Gold
|
$64.13
|
+0.86
1.36% |
$64.38
|
9,340,418
147.51% of 50 DAV
50 DAV is 6,332,200
|
$64.03
0.16%
|
8/31/2010
|
$61.32
|
PP = $63.48
|
|
MB = $66.65
|
Most Recent Note - 9/20/2010 5:35:08 PM
Y - Gain today with below above average volume for a new high close near its pivot point. No overhead supply remains to hinder its progress. Leadership in the Mining - Gold/Silver/Gems group (L criteria) is a nice reassurance.
>>> The latest Featured Stock Update with an annotated graph appeared on 9/14/2010. Click here.
View all notes |
Alert me of new notes |
CANSLIM.net Company Profile |
SEC |
Zacks Reports |
StockTalk |
News |
Chart |
Request a new note
C
A N
S L
I M
|
NEOG
-
NASDAQ
Neogen Corp
DRUGS - Diagnostic Substances
|
$32.50
|
-0.33
-1.01% |
$32.95
|
151,471
156.16% of 50 DAV
50 DAV is 97,000
|
$32.91
-1.25%
|
9/1/2010
|
$30.79
|
PP = $30.49
|
|
MB = $32.01
|
Most Recent Note - 9/21/2010 5:11:33 PM
G- Perched at its 52-week high, its color code was changed to green after rallying just beyond its "max buy" level. Due to report earnings news on Thursday, September 23rd. Prior highs in the $30 area define initial support to watch.
>>> The latest Featured Stock Update with an annotated graph appeared on 8/20/2010. Click here.
View all notes |
Alert me of new notes |
CANSLIM.net Company Profile |
SEC |
Zacks Reports |
StockTalk |
News |
Chart |
Request a new note
C
A N
S L
I M
|
NFLX
-
NASDAQ
Netflix Inc
SPECIALTY RETAIL - Music and Video Stores
|
$147.20
|
+4.31
3.02% |
$148.60
|
4,635,902
97.29% of 50 DAV
50 DAV is 4,764,900
|
$149.95
-1.83%
|
8/10/2010
|
$124.05
|
PP = $124.00
|
|
MB = $130.20
|
Most Recent Note - 9/21/2010 4:56:49 PM
G - Gain today with average volume for its second best close ever. Prior highs define important support to watch along with an upward trendline that comes into play well above its 50 DMA line.
>>> The latest Featured Stock Update with an annotated graph appeared on 8/10/2010. Click here.
View all notes |
Alert me of new notes |
CANSLIM.net Company Profile |
SEC |
Zacks Reports |
StockTalk |
News |
Chart |
Request a new note
C
A N
S L
I M
|
NTAP
-
NASDAQ
Netapp Inc
COMPUTER HARDWARE - Data Storage Devices
|
$48.20
|
-1.47
-2.96% |
$49.78
|
10,688,937
139.39% of 50 DAV
50 DAV is 7,668,200
|
$49.87
-3.35%
|
9/8/2010
|
$46.98
|
PP = $44.99
|
|
MB = $47.24
|
Most Recent Note - 9/21/2010 4:49:19 PM
G - Loss today with above average volume, a sign of distribution. Extended from a sound base, support to watch is at prior chart highs near its latest pivot point.
>>> The latest Featured Stock Update with an annotated graph appeared on 9/8/2010. Click here.
View all notes |
Alert me of new notes |
CANSLIM.net Company Profile |
SEC |
Zacks Reports |
StockTalk |
News |
Chart |
Request a new note
C
A N
S L
I M
|
Symbol/Exchange
Company Name
Industry Group |
PRICE |
CHANGE
(%Change) |
Day High |
Volume
(% DAV)
(% 50 day avg vol) |
52 Wk Hi
% From Hi |
Featured
Date |
Price
Featured |
Pivot Featured |
|
Max Buy |
ORCL
-
NASDAQ
Oracle Corp
COMPUTER SOFTWARE and SERVICES - Application Software
|
$26.82
|
-0.67
-2.44% |
$27.36
|
82,181,070
253.07% of 50 DAV
50 DAV is 32,474,200
|
$27.63
-2.91%
|
9/20/2010
|
$27.32
|
PP = $26.73
|
|
MB = $28.07
|
Most Recent Note - 9/21/2010 12:59:47 PM
Y - Down today, slumping near its pivot point. A "breakaway gap" on 9/17/10 was backed by 5 times average volume, and it was featured in yellow in the 9/20/10 mid-day report.. It has maintained a strong annual earnings (A criteria) history and sales revenues and earnings increases have shown impressive acceleration in its recent quarterly comparisons. Large supply of 5.03 billion shares outstanding makes it an unlikely sprinter.
>>> The latest Featured Stock Update with an annotated graph appeared on 9/20/2010. Click here.
View all notes |
Alert me of new notes |
CANSLIM.net Company Profile |
SEC |
Zacks Reports |
StockTalk |
News |
Chart |
Request a new note
C
A N
S L
I M
|
PAY
-
NYSE
Verifone Systems Inc
COMPUTER HARDWARE - Transaction Automation Systems
|
$28.78
|
-0.72
-2.44% |
$29.40
|
1,276,543
98.17% of 50 DAV
50 DAV is 1,300,300
|
$29.54
-2.58%
|
8/25/2010
|
$24.30
|
PP = $23.74
|
|
MB = $24.93
|
Most Recent Note - 9/21/2010 4:50:41 PM
G - Pulling back with average volume today. Very extended from a sound base, its prior highs in the $23 area define chart support.
>>> The latest Featured Stock Update with an annotated graph appeared on 8/30/2010. Click here.
View all notes |
Alert me of new notes |
CANSLIM.net Company Profile |
SEC |
Zacks Reports |
StockTalk |
News |
Chart |
Request a new note
C
A N
S L
I M
|
PRGO
-
NASDAQ
Perrigo Co
DRUGS - Drug Related Products
|
$63.54
|
+0.42
0.67% |
$64.26
|
730,496
68.99% of 50 DAV
50 DAV is 1,058,800
|
$65.38
-2.81%
|
9/15/2010
|
$63.73
|
PP = $64.76
|
|
MB = $68.00
|
Most Recent Note - 9/20/2010 5:45:34 PM
Y - Gain today with light volume, closing -3.5% off its 52-week high. Distributional pressure was noted last week after, technically, it did not trigger a proper technical buy signal.
>>> The latest Featured Stock Update with an annotated graph appeared on 9/15/2010. Click here.
View all notes |
Alert me of new notes |
CANSLIM.net Company Profile |
SEC |
Zacks Reports |
StockTalk |
News |
Chart |
Request a new note
C
A N
S L
I M
|
RAX
-
NYSE
Rackspace Hosting Inc
INTERNET - Internet Software and; Services
|
$22.97
|
+0.15
0.66% |
$23.47
|
2,932,209
163.97% of 50 DAV
50 DAV is 1,788,300
|
$23.51
-2.30%
|
9/21/2010
|
$22.84
|
PP = $23.61
|
|
MB = $24.79
|
Most Recent Note - 9/21/2010 1:11:50 PM
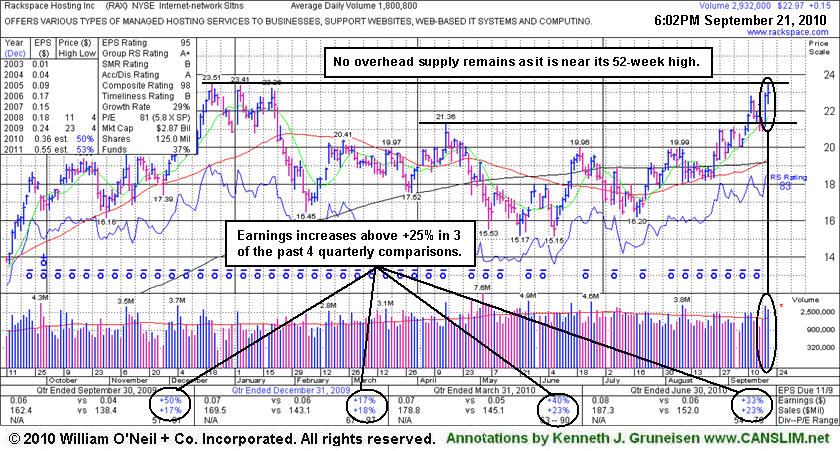
Y - Gain today has it trading pennies from its 52-week high, with no overhead supply remaining to hinder its progress. A solid gain on the prior session reconfirmed a recent technical breakout above prior chart highs. Subsequent gains into new high territory with volume conviction could signal the beginning of a meaningful price advance. This high-ranked Internet-Networking Solutions firm has earned very high ranks, and 3 of the past 4 quarterly earnings comparisons showed better than +25% increases. Its annual earnings history (A criteria) since trading began in 2008 has been good.
>>> The latest Featured Stock Update with an annotated graph appeared on 9/21/2010. Click here.
View all notes |
Alert me of new notes |
CANSLIM.net Company Profile |
SEC |
Zacks Reports |
StockTalk |
News |
Chart |
Request a new note
C
A N
S L
I M
|
ROVI
-
NASDAQ
Rovi Corp
COMPUTER SOFTWARE andamp; SERVICES - Security Software andamp; Services
|
$47.34
|
+0.89
1.92% |
$48.72
|
3,696,332
321.09% of 50 DAV
50 DAV is 1,151,200
|
$47.19
0.32%
|
8/31/2010
|
$43.31
|
PP = $45.06
|
|
MB = $47.31
|
Most Recent Note - 9/21/2010 1:17:23 PM
G - Color code is changed to green as it posts a second consecutive gain with heavy volume for new 52-week highs and trades above its "max buy" level. Strong gains followed news of a multi-year licensing deal with Apple Corp (AAPL), as it found prompt support after a brief 50 DMA violation.
>>> The latest Featured Stock Update with an annotated graph appeared on 8/24/2010. Click here.
View all notes |
Alert me of new notes |
CANSLIM.net Company Profile |
SEC |
Zacks Reports |
StockTalk |
News |
Chart |
Request a new note
C
A N
S L
I M
|
Symbol/Exchange
Company Name
Industry Group |
PRICE |
CHANGE
(%Change) |
Day High |
Volume
(% DAV)
(% 50 day avg vol) |
52 Wk Hi
% From Hi |
Featured
Date |
Price
Featured |
Pivot Featured |
|
Max Buy |
SHOO
-
NASDAQ
Steven Madden Limited
CONSUMER NON-DURABLES - Textile - Apparel Footwear
|
$39.36
|
-0.27
-0.68% |
$39.60
|
226,265
52.24% of 50 DAV
50 DAV is 433,100
|
$40.98
-3.95%
|
9/15/2010
|
$38.94
|
PP = $40.27
|
|
MB = $42.28
|
Most Recent Note - 9/20/2010 5:26:09 PM
Y - Gain today with light volume helped it close 2 cents above its August high close and -3.3% from its 52-week high. New pivot point was cited based on its 7/30/10 high plus ten cents.
>>> The latest Featured Stock Update with an annotated graph appeared on 8/5/2010. Click here.
View all notes |
Alert me of new notes |
CANSLIM.net Company Profile |
SEC |
Zacks Reports |
StockTalk |
News |
Chart |
Request a new note
C
A N
S L
I M
|
SLW
-
NYSE
Silver Wheaton Corp
METALS and; MINING - Silver
|
$25.15
|
+0.06
0.24% |
$25.22
|
10,345,237
218.93% of 50 DAV
50 DAV is 4,725,400
|
$25.56
-1.60%
|
8/25/2010
|
$21.40
|
PP = $21.99
|
|
MB = $23.09
|
Most Recent Note - 9/21/2010 5:02:35 PM
G - Stubbornly holding its ground after recent gains to new all-time highs. Extended from any sound base, its previous highs in the $21 area define chart support to watch.
>>> The latest Featured Stock Update with an annotated graph appeared on 8/25/2010. Click here.
View all notes |
Alert me of new notes |
CANSLIM.net Company Profile |
SEC |
Zacks Reports |
StockTalk |
News |
Chart |
Request a new note
C
A N
S L
I M
|
UA
-
NYSE
Under Armour Inc Cl A
CONSUMER NON-DURABLES - Textile - Apparel Clothing
|
$45.08
|
-0.15
-0.33% |
$45.44
|
751,609
100.01% of 50 DAV
50 DAV is 751,500
|
$45.30
-0.49%
|
9/9/2010
|
$39.99
|
PP = $40.10
|
|
MB = $42.11
|
Most Recent Note - 9/20/2010 5:29:20 PM
G - Extended from its latest sound base pattern, it hit another new 52-week high today with its 14th consecutive gain.
>>> The latest Featured Stock Update with an annotated graph appeared on 9/9/2010. Click here.
View all notes |
Alert me of new notes |
CANSLIM.net Company Profile |
SEC |
Zacks Reports |
StockTalk |
News |
Chart |
Request a new note
C
A N
S L
I M
|
UFPT
-
NASDAQ
U F P Tech Inc
CONSUMER NON-DURABLES - Packaging and Containers
|
$11.72
|
+0.48
4.27% |
$11.80
|
100,783
261.77% of 50 DAV
50 DAV is 38,500
|
$11.59
1.12%
|
9/16/2010
|
$11.20
|
PP = $11.69
|
|
MB = $12.27
|
Most Recent Note - 9/21/2010 1:33:42 PM
Y - Hit a new 52-week high and traded above its pivot point earlier today, posting a 7th consecutive small gain. No resistance remains due to overhead supply, and with only 6.21 million shares outstanding (S criteria) any institutional buying or selling can lead to greater price volatility.
>>> The latest Featured Stock Update with an annotated graph appeared on 9/17/2010. Click here.
View all notes |
Alert me of new notes |
CANSLIM.net Company Profile |
SEC |
Zacks Reports |
StockTalk |
News |
Chart |
Request a new note
C
A N
S L
I M
|
ULTA
-
NASDAQ
Ulta Salon Cosm & Frag
SPECIALTY RETAIL - Specialty Retail, Other
|
$29.11
|
+0.88
3.12% |
$29.47
|
1,023,508
173.18% of 50 DAV
50 DAV is 591,000
|
$29.25
-0.48%
|
9/3/2010
|
$26.36
|
PP = $25.89
|
|
MB = $27.18
|
Most Recent Note - 9/21/2010 1:36:01 PM
G - Hovering near its 52-week high, stubbornly holding its ground since its breakout gains with above average volume. Prior highs in the $26 area define support to watch now.
>>> The latest Featured Stock Update with an annotated graph appeared on 9/3/2010. Click here.
View all notes |
Alert me of new notes |
CANSLIM.net Company Profile |
SEC |
Zacks Reports |
StockTalk |
News |
Chart |
Request a new note
C
A N
S L
I M
|
Symbol/Exchange
Company Name
Industry Group |
PRICE |
CHANGE
(%Change) |
Day High |
Volume
(% DAV)
(% 50 day avg vol) |
52 Wk Hi
% From Hi |
Featured
Date |
Price
Featured |
Pivot Featured |
|
Max Buy |
VIT
-
NYSE
Vanceinfo Tech Inc Ads
COMPUTER SOFTWARE and SERVICES - Business Software and Services
|
$30.60
|
-0.34
-1.10% |
$31.88
|
1,366,358
254.44% of 50 DAV
50 DAV is 537,000
|
$31.42
-2.61%
|
7/8/2010
|
$25.20
|
PP = $26.58
|
|
MB = $27.91
|
Most Recent Note - 9/21/2010 1:38:42 PM
G - At an all-time high today, it is extended from a prior resistance level in the $26 area. Its 50 DMA line defines chart support to watch.
>>> The latest Featured Stock Update with an annotated graph appeared on 8/31/2010. Click here.
View all notes |
Alert me of new notes |
CANSLIM.net Company Profile |
SEC |
Zacks Reports |
StockTalk |
News |
Chart |
Request a new note
C
A N
S L
I M
|
WCRX
-
NASDAQ
Warner Chilcott Plc
DRUGS - Drug Manufacturers - Other
|
$22.96
|
-0.39
-1.67% |
$23.53
|
2,162,058
92.93% of 50 DAV
50 DAV is 2,326,500
|
$23.40
-1.86%
|
8/23/2010
|
$21.04
|
PP = $20.84
|
|
MB = $21.88
|
Most Recent Note - 9/20/2010 5:17:09 PM
G - Gain today with near average volume for yet another new all-time high. Color code was changed to green after getting extended from its prior base. (Featured price, pivot point, and max buy data are adjusted -$8.50 following recent cash dividend.)
>>> The latest Featured Stock Update with an annotated graph appeared on 8/23/2010. Click here.
View all notes |
Alert me of new notes |
CANSLIM.net Company Profile |
SEC |
Zacks Reports |
StockTalk |
News |
Chart |
Request a new note
C
A N
S L
I M
|