You are not logged in.
This means you
CAN ONLY VIEW reports that were published prior to Monday, April 14, 2025.
You
MUST UPGRADE YOUR MEMBERSHIP if you want to see any current reports.
AFTER MARKET UPDATE - MONDAY, SEPTEMBER 21ST, 2009
Previous After Market Report Next After Market Report >>>
|
|
|
|
DOW |
-41.34 |
9,778.86 |
-0.42% |
|
Volume |
1,198,277,750 |
-47% |
|
Volume |
2,463,179,200 |
-24% |
|
NASDAQ |
+5.18 |
2,138.04 |
+0.24% |
|
Advancers |
1,008 |
32% |
|
Advancers |
1,264 |
44% |
|
S&P 500 |
-3.64 |
1,064.66 |
-0.34% |
|
Decliners |
2,006 |
64% |
|
Decliners |
1,461 |
51% |
|
Russell 2000 |
-1.91 |
615.97 |
-0.31% |
|
52 Wk Highs |
152 |
|
|
52 Wk Highs |
92 |
|
|
S&P 600 |
-1.21 |
322.32 |
-0.37% |
|
52 Wk Lows |
0 |
|
|
52 Wk Lows |
5 |
|
|
 |
Major Averages Ended Mixed On Lighter Volume
Adam Sarhan, Contributing Writer,
The major averages closed mixed, but ended near their intra-day highs as the bears failed to send the market lower. As expected, volume totals pulled back across the board after Friday's bigger volume due to quadruple witching (a series of options expirations). Decliners led advancers by a 2-to-1 ratio on the NYSE while, but they led only by a narrow 7-to-6 ratio on the Nasdaq exchange. There were 26 high-ranked companies from the CANSLIM.net Leaders List that made a new 52-week high and appeared on the CANSLIM.net BreakOuts Page, down from 31 issues that appeared on the prior session. New 52-week highs were in the triple digits on both exchanges, while new 52-week lows were in the single digits yet again.
The market opened lower but spent the rest of the session edging higher as the US dollar rallied and investors locked in gains while concern spread that the six month rally has gotten ahead of itself. A stronger dollar sent stocks and many commodities lower, causing crude oil to close below the psychologically important $70 a barrel. Gold lost some ground yet still closed above the psychologically important $1,000 area which was prior resistance that now serves as support. A slew of gold stocks headed lower as traders got nervous as gold approached support. Last week, the S&P 500 advanced +2.5% after retail sales and industrial production came in stronger than expected which signaled the economy continues to improve. So far, the benchmark S&P 500 has rallied over +60% from its 12-year low in early March as the worst of the economic downturn appears to be behind us.
The Conference Board said that its index of US leading economic indicators rose in August for the fifth straight time which capped the longest stretch of gains since 2004. It also echoed the recent batch of stronger than expected economic data which signals that the economic recovery continues. The gauge looks at leading economic indicators (has a projected outlook for the next three to six months) rose +0.6% which matched the Street's forecasts. Elsewhere, the Group of 20 (G20) nations are slated to meet in Pittsburgh this week and continue their ongoing discussion regarding the global recovery and increased financial regulation. President Barack Obama was all over the media on Sunday and said in an interview with CNN that “the jobs picture is not going to improve considerably, and it could even get a little bit worse, over the next couple of months.”
PICTURED: The Nasdaq Composite led its peers today by closing higher as the other major averages closed with modest losses.
Money Management Services: Risk Free- Portfolio Review!
Investors often inquire looking for a money manager who follows a proven set of rules and who has completed the Master's Program, demonstrating a high level of skill at using this powerful investment system. Well, you are in luck! If you qualify to open an account with us you will have not one, but two highly qualified portfolio managers who have completed the Master's Program and follow the rules of this powerful investment system. Learn more about having your account professionally managed using this fact-based investment system by clicking HERE. *Accounts over $250,000 please. ** Serious inquiries only.
|
|
|
 |
Tech Gains Helped Nasdaq Composite Outperform Its Peers
Kenneth J. Gruneisen - Passed the CAN SLIM® Master's Exam
Commodity-linked areas were Monday's worst laggards as the Oil Services Index ($OSX -1.24%), Integrated Oil Index ($XOI -0.76%), and Gold & Silver Index ($XAU -1.20%) lost ground. The Bank Index ($BKX -0.48%) ended with a modest loss, nearly opposite the gain shown by the Broker/Dealer Index ($XBD +0.53%). The Healthcare Index ($HMO +0.88%) and Biotechnology Index ($BTK +0.83%) posted gains, and the tech-heavy Nasdaq Composite Index managed to end the session with a small gain as the Internet Index ($IIX +0.61%) and Networking Index ($NWX +1.08%) helped the tech sector show a positive bias. The Semiconductor Index ($SOX -0.02%) and Retail Index ($RLX +0.07%) were virtually unchanged.
Charts courtesy www.stockcharts.com
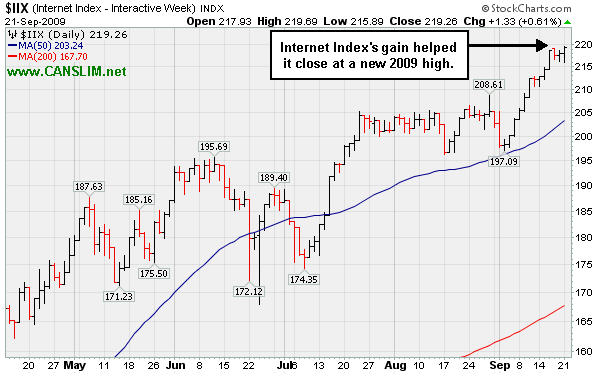
PICTURED: The Internet Index ($IIX +0.61%) posted a gain for a new 2009 high.
| Oil Services |
$OSX |
193.83 |
-2.44 |
-1.24% |
+59.68% |
| Healthcare |
$HMO |
1,267.26 |
+11.03 |
+0.88% |
+31.98% |
| Integrated Oil |
$XOI |
1,040.28 |
-8.00 |
-0.76% |
+6.19% |
| Semiconductor |
$SOX |
326.40 |
-0.08 |
-0.02% |
+53.84% |
| Networking |
$NWX |
238.40 |
+2.55 |
+1.08% |
+65.68% |
| Internet |
$IIX |
219.26 |
+1.33 |
+0.61% |
+63.91% |
| Broker/Dealer |
$XBD |
119.80 |
+0.63 |
+0.53% |
+54.64% |
| Retail |
$RLX |
385.79 |
+0.27 |
+0.07% |
+38.15% |
| Gold & Silver |
$XAU |
166.02 |
-2.01 |
-1.20% |
+34.05% |
| Bank |
$BKX |
47.46 |
-0.23 |
-0.48% |
+7.08% |
| Biotech |
$BTK |
964.97 |
+7.92 |
+0.83% |
+49.11% |
|
|
|
 |
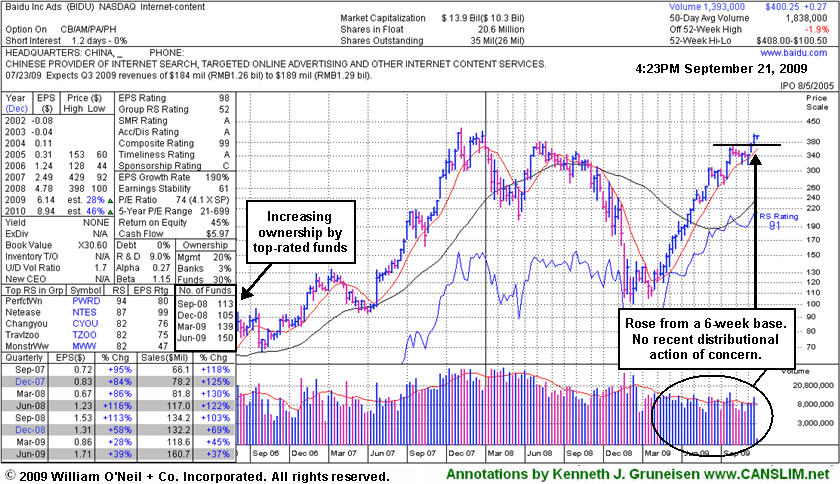
Baidu's Bullish Gains Viewed On Weekly Graph
Kenneth J. Gruneisen - Passed the CAN SLIM® Master's Exam
Baidu.com, Inc. (BIDU +$0.27 or +0.07% to $400.25) is quietly perched near the $400 level after 3 consecutive weekly gains. Its annotated weekly graph below shows no recent distributional action of concern and highlights increasing ownership by top-rated funds (the I criteria). BIDU was setting up on the right side of a near 6-week flat base while rising toward its 52 week high after its latest test of support at its 50-day moving average (DMA) line when it gapped up on 9/08/09 it was featured in yellow in the mid-day report with new pivot point and max buy levels cited (read here). By the time a fresh technical buy signal was triggered by its 9/15/09 gain with heavy enough volume to meet guidelines, its price was getting too extended above its pivot point by more than 5%, making it difficult to impossible for disciplined investors to buy properly within the investment system's guidelines.
Its action was last summarized in this FSU section with an annotated daily graph on 9/08/09 under the headline, "Baidu Near Multi-Year Highs, But Decelerating Growth Is A Concern." In the bottom left portion of the weekly graph below you can see that sales and earnings increases were still above the +25% guideline in recent quarters, but the increases have been generally decelerating, giving cause for concern.
We still stand behind the recent analysis. Others have described the stock's action since 2008 as a big cup-with-handle pattern. However, the pullback or "correction" in the course of a normal cup-with-handle typically is not more than 50%. In this case, its substantial pullback from $380 to $100 is well beyond the normal guideline for a proper cup-with-handle pattern. Of course, the Bear Market contributed to its weakness, yet that pullback of -73% was deeper than the major averages' correction during the same bearish period.
Based on weak technical action BIDU was dropped from the Featured Stocks list on 1/11/08, when it was trading at $329, and it has rebounded very impressively from its January 2009 lows near $100. An annotated graph showed a vivid picture of the stock's weakness then under the headline, "Weakness Hurting Chances For Featured Favorite" (read here). Take a look back at that now! BIDU had rallied +356% since it first featured on Monday, October 30, 2006 in the CANSLIM.net Mid Day Breakouts Report (read here) with a $94.05 pivot point. Along the way it went through a multi-month consolidation under its 50 and 20 DMA lines, then later returned as a noteworthy leader featured in CANSLIM.net reports." Remember that a dropped stock can be featured again in a future CANSLIM.net report if it repairs its technical damage and forms a new pivot point. After its initial appearance, in fact, BIDU was featured again in yellow at $225.58 in the 09/11/07 CANSLIM.net Mid-Day BreakOuts Report as it was hitting new highs from an 8-week base period (read here). It may have looked "expensive" then, yet it subsequently zoomed to $429 by November of that year before beginning a very deep consolidation (coupled with a Bear Market).
|
|
|
Color Codes Explained :
Y - Better candidates highlighted by our
staff of experts.
G - Previously featured
in past reports as yellow but may no longer be buyable under the
guidelines.
***Last / Change / Volume quote data in this table corresponds with the timestamp on the note***
Symbol/Exchange
Company Name
Industry Group |
Last |
Chg. |
Vol
% DAV |
Date Featured |
Price Featured |
Latest Pivot Point
Featured |
Status |
| Latest Max Buy Price |
ARO
- NYSE
Aeropostale Inc
RETAIL - Apparel Stores
|
$44.24
|
+0.19
|
1,501,548
54% DAV
2,787,600
|
8/21/2009
(Date
Featured) |
$39.21
(Price
Featured) |
PP = $38.84 |
G |
| MB = $40.78 |
Most Recent Note - 9/21/2009
G - This high-ranked leader in the Retail - Clothing/shoe group inched to a new all-time high close today with light volume behind its 6th consecutive gain. It is extended from a sound base and not buyable under the investment system guidelines now. Support to watch is at prior highs in the $38 area. It was featured in yellow in the 8/21/09 Mid-Day BreakOuts Report (read here).
>>> The latest Featured Stock Update with an annotated graph appeared on 9/18/2009. click here.
|
|
C
A
S
I |
News |
Chart |
SEC
View all notes Alert
me of new notes
Company
Profile
|
ARST
-
|
$23.21
|
+0.61
|
1,192,768
166% DAV
718,300
|
9/1/2009
(Date
Featured) |
$19.91
(Price
Featured) |
PP = $20.90 |
G |
| MB = $21.95 |
Most Recent Note - 9/21/2009 4:10:32 PM
G - Gain today with higher volume, +70% above average, for a new all-time high. It is extended from its latest base. Prior chart highs in the $20 area are important support to watch on pullbacks.
>>> The latest Featured Stock Update with an annotated graph appeared on 9/17/2009. click here.
|
|
C
A
S
I |
News |
Chart |
SEC
View all notes Alert
me of new notes
Company
Profile
|
BIDU
- NASDAQ
Baidu Inc Ads
INTERNET - Internet Information Providers
|
$400.10
|
+0.12
|
1,364,644
74% DAV
1,838,000
|
9/8/2009
(Date
Featured) |
$351.80
(Price
Featured) |
PP = $368.59 |
G |
| MB = $387.02 |
Most Recent Note - 9/21/2009 5:01:30 PM
G - Gapped down today and then positively reversed. Perched near the $400 level, extended from a sound base, thus not buyable now under the investment system guidelines. BIDU was featured in yellow in the 9/08/09 Mid-Day BreakOuts Report (read here).
>>> The latest Featured Stock Update with an annotated graph appeared on 9/21/2009. click here.
|
|
C
A
S
I |
News |
Chart |
SEC
View all notes Alert
me of new notes
Company
Profile
|
CRM
- NYSE
Salesforce.com Inc
INTERNET - Internet Software & Services
|
$57.08
|
-1.09
|
1,711,788
85% DAV
2,018,900
|
8/16/2009
(Date
Featured) |
$47.12
(Price
Featured) |
PP = $45.59 |
G |
| MB = $47.87 |
Most Recent Note - 9/21/2009 5:02:22 PM
G - Loss today on light volume, yet it is still extended from a sound base, thus not buyable now under the guidelines. Prior highs near $55 are an intial support level to watch on pullbacks. It recently rose from a "3-weeks tight" type pattern following its "breakaway gap" on 8/21/09 with more than 5 times average volume. Detailed analysis and an annotated graph were included when recently featured in the 8/16/09 Stock Bulletin (read here).
>>> The latest Featured Stock Update with an annotated graph appeared on 9/15/2009. click here.
|
|
C
A
S
I |
News |
Chart |
SEC
View all notes Alert
me of new notes
Company
Profile
|
EBIX
- NASDAQ
Ebix Inc
COMPUTER SOFTWARE & SERVICES - Business Software & Services
|
$47.43
|
-2.05
|
298,013
234% DAV
127,500
|
8/28/2009
(Date
Featured) |
$45.86
(Price
Featured) |
PP = $45.35 |
G |
| MB = $47.62 |
Most Recent Note - 9/21/2009 5:03:48 PM
G - Gapped down today with a considerable loss on heavy volume indicative of distributional pressure. Falling toward important support to watch at prior chart highs and its 50 DMA line in the $44-45 area. Recent whipsaw action briefly tested support, like its shakeout in mid-August. It has a small supply of only 6.62 million shares in the float. EBIX rallied as much as +19.76% since featured in yellow in the 8/28/09 Mid-Day BreakOuts Report (read here).
>>> The latest Featured Stock Update with an annotated graph appeared on 9/11/2009. click here.
|
|
C
A
S
I |
News |
Chart |
SEC
View all notes Alert
me of new notes
Company
Profile
|
GMCR
- NASDAQ
Green Mtn Coffee Roastrs
FOOD & BEVERAGE - Processed & Packaged Goods
|
$70.19
|
+1.30
|
1,273,849
86% DAV
1,482,900
|
7/17/2009
(Date
Featured) |
$60.15
(Price
Featured) |
PP = $63.79 |
G |
| MB = $66.98 |
Most Recent Note - 9/21/2009 5:05:12 PM
G - Gain today on below average volume for its second best close ever, overcoming distributional pressure after it completed an additional share offering on 8/07/09. Volume totals have been light as it recently rose back above its 50 DMA line and rallied up through most overhead supply. GMCR traded up more than +168% since appearing with an annotated graph under the headline "It May Soon Be Time To Go Green" when featured in the January 2009 CANSLIM.net News (read here).
>>> The latest Featured Stock Update with an annotated graph appeared on 9/10/2009. click here.
|
|
C
A
S
I |
News |
Chart |
SEC
View all notes Alert
me of new notes
Company
Profile
|
NTES
- NASDAQ
Netease Inc Adr
INTERNET - Internet Information Providers
|
$43.79
|
-1.45
|
2,223,029
108% DAV
2,063,700
|
7/17/2009
(Date
Featured) |
$39.29
(Price
Featured) |
PP = $38.74 |
G |
| MB = $40.68 |
Most Recent Note - 9/21/2009 5:06:57 PM
G - Loss today on higher volume was indicative of more distributional pressure. A solid gap up gain on 9/16/09 with higher volume helped it rally from support at its 50 DMA line and upward trendline. The next support is as prior chart highs in the $38 area. Deterioration below those levels would raise more serious concerns and trigger additional sell signals.
>>> The latest Featured Stock Update with an annotated graph appeared on 9/14/2009. click here.
|
|
C
A
S
I |
News |
Chart |
SEC
View all notes Alert
me of new notes
Company
Profile
|
NVEC
- NASDAQ
N V E Corp
ELECTRONICS - Semiconductor - Specialized
|
$57.85
|
+3.19
|
123,399
139% DAV
89,000
|
8/26/2009
(Date
Featured) |
$55.32
(Price
Featured) |
PP = $57.60 |
G |
| MB = $60.48 |
Most Recent Note - 9/21/2009 5:08:04 PM
G - Rallied up from its 50 DMA line today with a gain on above average volume. Gapped down on 8/17/09 and suffered a considerable loss with nearly 4 times average volume, negating its latest breakout and triggering a technical sell signal. Whenever any stock flashes its biggest point loss on its highest down volume it raises great concerns. On the prior session it touched a new 52-week high and then negatively reversed for a loss on average volume. This high-ranked leader from the Electronics industry group quickly got extended from its latest sound base. As previously noted, "Keep in mind its small supply (the S criteria) of shares outstanding which can contribute to greater than usual volatility. Be mindful of its still rather minuscule sales revenues. These concerns heighten the need for great discipline in trading (buying AND selling)."
>>> The latest Featured Stock Update with an annotated graph appeared on 9/16/2009. click here.
|
|
C
A
S
I |
News |
Chart |
SEC
View all notes Alert
me of new notes
Company
Profile
|
PEGA
- NASDAQ
Pegasystems Inc
COMPUTER SOFTWARE & SERVICES - Business Software & Services
|
$34.05
|
+0.79
|
339,762
90% DAV
377,600
|
9/9/2009
(Date
Featured) |
$31.14
(Price
Featured) |
PP = $33.35 |
Y |
| MB = $35.02 |
Most Recent Note - 9/21/2009 5:09:10 PM
Y - Gain today on near average volume for its best close ever. A pullback under its latest pivot point on 9/17/09 raised concerns after volume-driven gains pegged the high-ranked Computer Software - Financial firm to a new all-time high.
>>> The latest Featured Stock Update with an annotated graph appeared on 9/9/2009. click here.
|
|
C
A
S
I |
News |
Chart |
SEC
View all notes Alert
me of new notes
Company
Profile
|
|
|
|
THESE ARE NOT BUY RECOMMENDATIONS!
Comments contained in the body of this report are technical
opinions only. The material herein has been obtained
from sources believed to be reliable and accurate, however,
its accuracy and completeness cannot be guaranteed.
This site is not an investment advisor, hence it does
not endorse or recommend any securities or other investments.
Any recommendation contained in this report may not
be suitable for all investors and it is not to be deemed
an offer or solicitation on our part with respect to
the purchase or sale of any securities. All trademarks,
service marks and trade names appearing in this report
are the property of their respective owners, and are
likewise used for identification purposes only.
This report is a service available
only to active Paid Premium Members.
You may opt-out of receiving report notifications
at any time. Questions or comments may be submitted
by writing to Premium Membership Services 665 S.E. 10 Street, Suite 201 Deerfield Beach, FL 33441-5634 or by calling 1-800-965-8307
or 954-785-1121.
|
|
|


