You are not logged in.
This means you
CAN ONLY VIEW reports that were published prior to Monday, February 26, 2024.
You
MUST UPGRADE YOUR MEMBERSHIP if you want to see any current reports.
AFTER MARKET UPDATE - FRIDAY, SEPTEMBER 20TH, 2019
Previous After Market Report Next After Market Report >>>
|
|
|
|
DOW |
-159.72 |
26,935.07 |
-0.59% |
|
Volume |
2,754,524,500 |
+238% |
|
Volume |
3,277,032,600 |
+83% |
|
NASDAQ |
-65.21 |
8,117.67 |
-0.80% |
|
Advancers |
1,429 |
52% |
|
Advancers |
1,531 |
49% |
|
S&P 500 |
-14.76 |
2,992.03 |
-0.49% |
|
Decliners |
1,333 |
48% |
|
Decliners |
1,571 |
51% |
|
Russell 2000 |
-1.73 |
1,559.75 |
-0.11% |
|
52 Wk Highs |
89 |
|
|
52 Wk Highs |
59 |
|
|
S&P 600 |
-3.23 |
962.11 |
-0.33% |
|
52 Wk Lows |
13 |
|
|
52 Wk Lows |
50 |
|
|
 |
Major Indices Ended Lower for the Week as Leadership Thinned
Kenneth J. Gruneisen - Passed the CAN SLIM® Master's Exam
The Dow reversed early session gains and fell 159 points, losing 1.1% for the week. The S&P 500 was off 0.5% to cap a 0.5% weekly decline. The Nasdaq Composite shed 0.8%, retreating 0.7% for the week. The volume totals reported were much higher than the prior session on the NYSE and on the Nasdaq exchange, inflated by options expirations. Decliners led advancers by a narrow margin on the Nasdaq exchange while advancers led decliners by about the same margin on the NYSE. Leadership thinned as there were 18 high-ranked companies from the Leaders List hit new 52-week highs and were listed on the BreakOuts Page, versus the total of 46 on the prior session. New 52-week highs totals contracted yet outnumbered new 52-week lows totals on the NYSE and on the Nasdaq exchange. Concerning the M criteria of the fact-based investment system, investors have a green light to make carefully selected new buying efforts. The Featured Stocks Page provides the most timely analysis on high-ranked leaders. Charts used courtesy of www.stockcharts.com
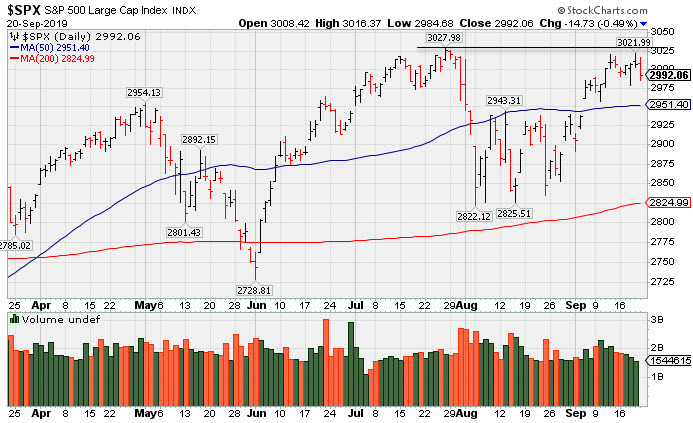
PICTURED: The S&P 500 Index is perched -1.2% off its record high.
Stocks ended lower on Friday as investors assessed the latest updates on the trade front. News that a Chinese trade delegation cancelled their planned visit to the American heartland and returned to China earlier than anticipated weighed on investor sentiment. The in-person deputy level negotiations came ahead of the high-level meetings slated for October. Meanwhile, volatility in equity markets were likely amplified today due to “quadruple witching,” a quarterly phenomenon in which options and futures on indexes and stocks expire on a single day.
Perceived “safe-haven” assets caught a bid, with COMEX gold jumping 1.1% to $1,516.40/ounce. Treasuries strengthened along the curve, with the yield on the benchmark 10-year note slumping eight basis points to 1.71%. In central bank news, Boston Fed President Eric Rosengren, a dissenting voter at the most recent FOMC meeting, suggested the recent monetary stimulus was unwarranted due to a tight labor market.
Eight of 11 S&P 500 sectors finished in negative territory. The Communication Services and Technology stocks led the decliners, with both groups losing more than 1%. Shares of Netflix (NFLX -5.53%) fell following cautious analyst commentary surrounding the streaming giant’s ability to increase subscriptions. Etsy (ETSY +2.27%) rose following an analyst upgrade of the company. In commodities, WTI crude was off 0.1% to $58.09/barrel, but notched its best weekly advance since June.
|
 Kenneth J. Gruneisen started out as a licensed stockbroker in August 1987, a couple of months prior to the historic stock market crash that took the Dow Jones Industrial Average down -22.6% in a single day. He has published daily fact-based fundamental and technical analysis on high-ranked stocks online for two decades. Through FACTBASEDINVESTING.COM, Kenneth provides educational articles, news, market commentary, and other information regarding proven investment systems that work in good times and bad.
Comments contained in the body of this report are technical opinions only and are not necessarily those of Gruneisen Growth Corp. The material herein has been obtained from sources believed to be reliable and accurate, however, its accuracy and completeness cannot be guaranteed. Our firm, employees, and customers may effect transactions, including transactions contrary to any recommendation herein, or have positions in the securities mentioned herein or options with respect thereto. Any recommendation contained in this report may not be suitable for all investors and it is not to be deemed an offer or solicitation on our part with respect to the purchase or sale of any securities. |
|
 |
Gold & Silver and Biotech Indexes Led Group Gainers
Kenneth J. Gruneisen - Passed the CAN SLIM® Master's Exam
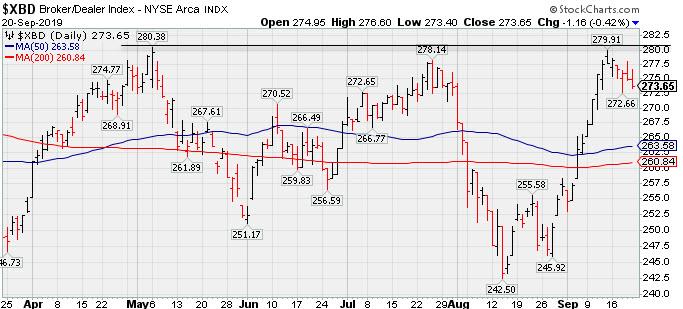
The Bank Index ($BKX -0.68%) and the Broker/Dealer Index ($XBD -0.42%) edged lower and the Retail Index ($RLX -1.29%) suffered a larger loss. The tech sector was led lower by the Semiconductor Index ($SOX -1.83%), meanwhile, the Biotech Index ($BTK +0.45%) and Networking Index ($NWX +0.17%) finished the session slightly higher. The Oil Services Index ($OSX -0.83%) lost ground and the Integrated Oil Index ($XOI +0.18%) eked out a small gain, meanwhile, the Gold & Silver Index ($XAU +1.73%) notched a solid gain.
PICTURED: The Broker/Dealer Index ($XBD -0.42%) has been consolidating after rebounding near the prior highs. Its stance improved with the recent rally above the 50-day and 200-day moving average (DMA) lines also helping the broader market outlook.
| Oil Services |
$OSX |
72.08 |
-0.60 |
-0.83% |
-10.57% |
| Integrated Oil |
$XOI |
1,244.23 |
+2.13 |
+0.17% |
+7.34% |
| Semiconductor |
$SOX |
1,563.00 |
-29.07 |
-1.83% |
+35.30% |
| Networking |
$NWX |
560.65 |
+1.05 |
+0.19% |
+14.73% |
| Broker/Dealer |
$XBD |
273.64 |
-1.17 |
-0.43% |
+15.29% |
| Retail |
$RLX |
2,368.77 |
-31.06 |
-1.29% |
+21.39% |
| Gold & Silver |
$XAU |
94.60 |
+1.61 |
+1.73% |
+33.88% |
| Bank |
$BKX |
100.39 |
-0.68 |
-0.67% |
+17.02% |
| Biotech |
$BTK |
4,475.67 |
+20.41 |
+0.46% |
+6.04% |
|
|
|
 |
Consolidating Above 50-Day Moving Average Line
Kenneth J. Gruneisen - Passed the CAN SLIM® Master's Exam
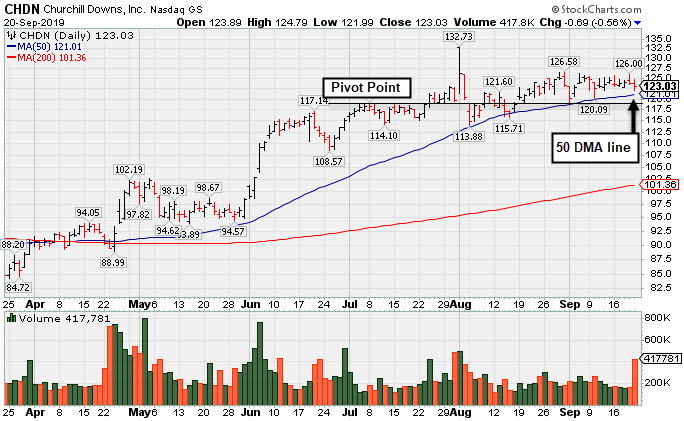
Churchill Downs Inc (CHDN -$0.69 or -0.56% to $123.03) ended slightly lower with heavier volume on Friday. Volume totals had been cooling while consolidating above its 50-day moving average (DMA) line ($121.01). More damaging losses below that important short-term average or undercutting the recent lows would raise greater concerns and trigger technical sell signals.
Recently it reported Jun '19 earnings +10% on +26% sales revenues versus the year ago period, below the +25% minimum earnings guideline (C criteria). That broke a streak of 6 consecutive quarters well above the +25% minimum earnings guideline (C criteria) versus the year ago periods. It still has an earnings Per Share Rating of 95.
The L criteria of the fact-based investment system guides investors toward buying leading stocks that are in leading industry groups. The Leisure - Gaming/Equipment industry group has a Group Relative Strength Rating of C.
It was highlighted in yellow in the 6/05/19 mid-day report (read here). It was last shown in this FSU section on 9/04/19 with an annotated graph under the headline, "Found Support After Making Limited Progress". Annual earnings (A criteria) growth has been strong since a downturn in FY '14.
The number of top-rated funds owning its shares rose from 333 in Jun '17 to 447 in Jun '18, a reassuring sign concerning the I criteria. Its current Up/Down Volume Ratio of 1.4 is an unbiased indication its shares have been under accumulation over the past 50 days. It has a small supply of 35.2 million shares (S criteria) outstanding following a 3:1 split effective 1/28/19, and this small supply can contribute to greater price volatility in the event of institutional buying or selling.
|
|
|
Color Codes Explained :
Y - Better candidates highlighted by our
staff of experts.
G - Previously featured
in past reports as yellow but may no longer be buyable under the
guidelines.
***Last / Change / Volume data in this table is the closing quote data***
Symbol/Exchange
Company Name
Industry Group |
PRICE |
CHANGE
(%Change) |
Day High |
Volume
(% DAV)
(% 50 day avg vol) |
52 Wk Hi
% From Hi |
Featured
Date |
Price
Featured |
Pivot Featured |
|
Max Buy |
 CCBG
-
NASDAQ
CCBG
-
NASDAQ
Capital City Bk Gp
BANKING - Regional - Mid-Atlantic Banks
|
$27.52
|
+1.03
3.89% |
$28.00
|
104,690
475.86% of 50 DAV
50 DAV is 22,000
|
$27.24
1.03%
|
9/13/2019
|
$27.03
|
PP = $27.05
|
|
MB = $28.40
|
 Most Recent Note - 9/20/2019 11:51:51 AM
Y - Remains perched near its 52-week high. Subsequent gains above the pivot point backed by at least +40% above average volume are needed to trigger a technical buy signal.
>>> FEATURED STOCK ARTICLE : Thinly Traded Bank Rallied To Multi-Year Highs - 9/13/2019 |
View all notes |
Set NEW NOTE alert |
Company Profile |
SEC
News |
Chart |
Request a new note
C
A
S
I |
EPAM
-
NYSE
Epam Systems Inc
COMPUTER SOFTWARE and SERVICES - Information Technology Service
|
$185.79
|
+0.55
0.30% |
$187.96
|
316,518
86.01% of 50 DAV
50 DAV is 368,000
|
$201.00
-7.57%
|
5/9/2019
|
$169.25
|
PP = $180.55
|
|
MB = $189.58
|
Most Recent Note - 9/20/2019 5:20:38 PM
G - A rebound above its 50 DMA line ($189.82) is still needed for its outlook to improve. Halted its slide above the prior low ($175.33 on 8/07/19) which defines the next important support level. Reported earnings +27% on +24% sales revenues for the Jun '19 quarter.
>>> FEATURED STOCK ARTICLE : Recent Slump Below 50-Day Average Hurt Outlook - 9/16/2019 |
View all notes |
Set NEW NOTE alert |
Company Profile |
SEC
News |
Chart |
Request a new note
C
A
S
I |
AUDC
-
NASDAQ
Audiocodes Ltd
ELECTRONICS - Scientific and Technical Instrum
|
$20.76
|
-0.04
-0.19% |
$21.15
|
250,780
120.57% of 50 DAV
50 DAV is 208,000
|
$21.66
-4.16%
|
9/13/2019
|
$19.68
|
PP = $19.84
|
|
MB = $20.83
|
Most Recent Note - 9/19/2019 12:45:53 PM
G - Rallied further above its "max buy" level and hit another new all-time high today after 6 consecutive gains marked by volume. Its 50 DMA line ($17.93) defines important support.
>>> FEATURED STOCK ARTICLE : Recent Spurt of Gains for New Highs Marked By Volume - 9/17/2019 |
View all notes |
Set NEW NOTE alert |
Company Profile |
SEC
News |
Chart |
Request a new note
C
A
S
I |
LHCG
-
NASDAQ
L H C Group Inc
HEALTH SERVICES - Home Health Care
|
$117.65
|
-0.41
-0.35% |
$118.69
|
397,907
186.81% of 50 DAV
50 DAV is 213,000
|
$129.37
-9.06%
|
7/1/2019
|
$110.94
|
PP = $122.20
|
|
MB = $128.31
|
Most Recent Note - 9/18/2019 6:01:53 PM
G - A rebound above its 50 DMA line ($121.11) is needed to help its outlook, however it has recently acted as resistance. The recent low ($115.06 9/10/19) defines near-term support above its 200 DMA line ($111.74).
>>> FEATURED STOCK ARTICLE : 50-Day Moving Average Recently Acted as Resistance - 9/12/2019 |
View all notes |
Set NEW NOTE alert |
Company Profile |
SEC
News |
Chart |
Request a new note
C
A
S
I |
CHDN
-
NASDAQ
Churchill Downs Inc
LEISURE - Gaming Activities
|
$123.03
|
-0.69
-0.56% |
$124.79
|
417,781
189.90% of 50 DAV
50 DAV is 220,000
|
$132.73
-7.31%
|
7/22/2019
|
$118.45
|
PP = $118.89
|
|
MB = $124.83
|
Most Recent Note - 9/20/2019 5:19:17 PM
Y - Small loss today came on higher volume. Volume had been cooling while consolidating above its 50 DMA line ($121). Prior lows define the next important support to watch. Jun '19 earnings +10% on +26% sales revenues versus the year ago period were below the +25% minimum earnings guideline (C criteria), noted recently raising fundamental concerns. See the latest FSU analysis for more details and a new annotated graph.
>>> FEATURED STOCK ARTICLE : Consolidating Above 50-Day Moving Average Line - 9/20/2019 |
View all notes |
Set NEW NOTE alert |
Company Profile |
SEC
News |
Chart |
Request a new note
C
A
S
I |
Symbol/Exchange
Company Name
Industry Group |
PRICE |
CHANGE
(%Change) |
Day High |
Volume
(% DAV)
(% 50 day avg vol) |
52 Wk Hi
% From Hi |
Featured
Date |
Price
Featured |
Pivot Featured |
|
Max Buy |
LULU
-
NASDAQ
Lululemon Athletica
MANUFACTURING - Textile Manufacturing
|
$189.30
|
-4.31
-2.23% |
$196.04
|
2,156,897
123.89% of 50 DAV
50 DAV is 1,741,000
|
$204.44
-7.41%
|
9/6/2019
|
$201.25
|
PP = $194.35
|
|
MB = $204.07
|
Most Recent Note - 9/20/2019 5:23:37 PM
Y - Loss today with above average volume undercut the prior high ($194.25) as it slumped back into the prior base raising concerns. Its 50 DMA line ($186.73) defines important near-term support to watch. See the latest FSU analysis for more details and an annotated graph.
>>> FEATURED STOCK ARTICLE : Consolidating Near Prior High Following Latest Breakout - 9/18/2019 |
View all notes |
Set NEW NOTE alert |
Company Profile |
SEC
News |
Chart |
Request a new note
C
A
S
I |
CPRT
-
NASDAQ
Copart Inc
SPECIALTY RETAIL - Auto Dealerships
|
$82.58
|
+0.35
0.43% |
$83.30
|
1,602,577
124.42% of 50 DAV
50 DAV is 1,288,000
|
$83.70
-1.34%
|
9/5/2019
|
$79.13
|
PP = $79.84
|
|
MB = $83.83
|
Most Recent Note - 9/19/2019 5:13:08 PM
Y - Quietly perched near its all-time high. Held its ground after the big volume-driven gain above the pivot point on 9/05/19 clinched a technical buy signal. Fundamentals are strong. See the latest FSU analysis for more details and a new annotated graph.
>>> FEATURED STOCK ARTICLE : Hovering Near All-Time High Following Recent Breakout - 9/19/2019 |
View all notes |
Set NEW NOTE alert |
Company Profile |
SEC
News |
Chart |
Request a new note
C
A
S
I |
BLD
-
NYSE
Topbuild Corp
Bldg-Constr Prds/Misc
|
$95.12
|
-0.47
-0.49% |
$96.11
|
619,137
218.78% of 50 DAV
50 DAV is 283,000
|
$96.63
-1.56%
|
5/17/2019
|
$82.19
|
PP = $87.31
|
|
MB = $91.68
|
Most Recent Note - 9/18/2019 6:04:53 PM
G - Posted a 4th consecutive gain today and hit a new all-time high. Earnings rose +39% on +9% sales revenues for the Jun '19 quarter versus the year ago period. Its 50 DMA line ($87.95) defines important support to watch along with its prior low ($86.53 on 8/28/19).
>>> FEATURED STOCK ARTICLE : Holding Ground Stubbornly in Tight Range Near Record High - 9/10/2019 |
View all notes |
Set NEW NOTE alert |
Company Profile |
SEC
News |
Chart |
Request a new note
C
A
S
I |
PAGS
-
NYSE
Pagseguro Digital Cl A
Finance-CrdtCard/PmtPr
|
$47.49
|
-1.06
-2.18% |
$49.01
|
1,301,101
62.76% of 50 DAV
50 DAV is 2,073,000
|
$53.43
-11.12%
|
6/25/2019
|
$37.69
|
PP = $40.07
|
|
MB = $42.07
|
Most Recent Note - 9/19/2019 5:15:08 PM
G - Posted another gain today on lighter than average volume as it rebounded further above its 50 DMA line ($47.26) helping its outlook to improve. Halted its slide above the prior low ($42.00 on 8/05/19) which defines the next important chart support level. Fundamentals are strong.
>>> FEATURED STOCK ARTICLE : 50-Day Moving Average Violation Triggered Technical Sell Signal - 9/11/2019 |
View all notes |
Set NEW NOTE alert |
Company Profile |
SEC
News |
Chart |
Request a new note
C
A
S
I |
|
|
|
THESE ARE NOT BUY RECOMMENDATIONS!
Comments contained in the body of this report are technical
opinions only. The material herein has been obtained
from sources believed to be reliable and accurate, however,
its accuracy and completeness cannot be guaranteed.
This site is not an investment advisor, hence it does
not endorse or recommend any securities or other investments.
Any recommendation contained in this report may not
be suitable for all investors and it is not to be deemed
an offer or solicitation on our part with respect to
the purchase or sale of any securities. All trademarks,
service marks and trade names appearing in this report
are the property of their respective owners, and are
likewise used for identification purposes only.
This report is a service available
only to active Paid Premium Members.
You may opt-out of receiving report notifications
at any time. Questions or comments may be submitted
by writing to Premium Membership Services 665 S.E. 10 Street, Suite 201 Deerfield Beach, FL 33441-5634 or by calling 1-800-965-8307
or 954-785-1121.
|
|
|