***Last / Change / Volume data in this table is the closing quote data***
Symbol/Exchange
Company Name
Industry Group |
PRICE |
CHANGE
(%Change) |
Day High |
Volume
(% DAV)
(% 50 day avg vol) |
52 Wk Hi
% From Hi |
Featured
Date |
Price
Featured |
Pivot Featured |
|
Max Buy |
AVG
-
NYSE
A V G Technologies N.V.
INTERNET - Internet Software and Services
|
$26.21
|
+0.24
0.92% |
$26.56
|
1,407,896
163.52% of 50 DAV
50 DAV is 861,000
|
$25.99
0.87%
|
9/13/2013
|
$23.06
|
PP = $23.88
|
|
MB = $25.07
|
Most Recent Note - 9/18/2013 12:23:14 PM
G - Color code is changed to green after rallying beyond its "max buy" level. Triggered a technical buy signal on 9/16/13 with 5 times average volume behind its breakout gain above the pivot point. More details and an annotated graph were included on 9/13/13 in the latest FSU analysis under the headline, "Rallying Near Pivot Point With Greater Volume Conviction".
>>> The latest Featured Stock Update with an annotated graph appeared on 9/13/2013. Click here.
View all notes |
Alert me of new notes |
CANSLIM.net Company Profile |
SEC |
Zacks Reports |
StockTalk |
News |
Chart |
Request a new note
C
A N
S L
I M


|
BITA
-
NYSE
Bitauto Hldgs Ltd Ads
INTERNET - Internet Information Providers
|
$15.88
|
+0.32
2.06% |
$15.88
|
345,902
92.36% of 50 DAV
50 DAV is 374,500
|
$18.10
-12.27%
|
8/7/2013
|
$12.01
|
PP = $13.30
|
|
MB = $13.97
|
Most Recent Note - 9/19/2013 7:14:36 PM
G - Rallied for a big gain on average volume today after a streak of 5 consecutive losses as it endured distributional pressure. Its choppy 6-week consolidation above its 50 DMA line and prior highs is not recognized as a sound base pattern.
>>> The latest Featured Stock Update with an annotated graph appeared on 9/3/2013. Click here.
View all notes |
Alert me of new notes |
CANSLIM.net Company Profile |
SEC |
Zacks Reports |
StockTalk |
News |
Chart |
Request a new note
C
A N
S L
I M
|
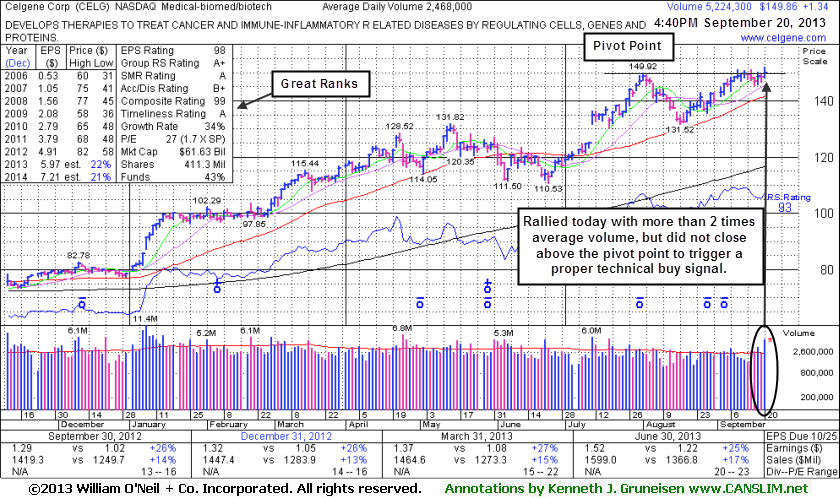
CELG
-
NASDAQ
Celgene Corp
DRUGS - Drug Manufacturers - Major
|
$149.86
|
+1.34
0.90% |
$151.95
|
5,256,133
208.62% of 50 DAV
50 DAV is 2,519,500
|
$151.20
-0.89%
|
9/12/2013
|
$149.50
|
PP = $150.02
|
|
MB = $157.52
|
 Most Recent Note - 9/20/2013 5:41:39 PM
Y - Hit a new 52-week high today with +208% above average volume, but it finished just below the new pivot point recently cited. See the latest FSU analysis for more details and a new annotated graph.
>>> The latest Featured Stock Update with an annotated graph appeared on 9/20/2013. Click here.
View all notes |
Alert me of new notes |
CANSLIM.net Company Profile |
SEC |
Zacks Reports |
StockTalk |
News |
Chart |
Request a new note
C
A N
S L
I M
|
EGBN
-
NASDAQ
Eagle Bancorp Inc
BANKING - Regional - Mid-Atlantic Banks
|
$27.38
|
+0.11
0.40% |
$27.88
|
87,578
124.75% of 50 DAV
50 DAV is 70,200
|
$28.24
-3.05%
|
9/16/2013
|
$27.48
|
PP = $27.77
|
|
MB = $29.16
|
Most Recent Note - 9/16/2013 6:53:19 PM
Y - Finished lower today following a "negative reversal" after hitting a new 52-week high. Highlighted in yellow with a new pivot point based on its 7/25/13 high plus 10 cents. Reported earnings +33% on +15% sales revenues for the Jun '13 quarter. Found support at its 50 DMA line again since noted in the 7/26/13 mid-day report - "This Bank holding company with operations in the Northeast has shown strong sales revenues and earnings increases (C criteria) in recent quarterly comparisons. Annual earnings (A criteria) history included a downturn in FY '07-09 yet improved in recent years." See the latest FSU analysis for more details and a new annotated graph.
>>> The latest Featured Stock Update with an annotated graph appeared on 9/16/2013. Click here.
View all notes |
Alert me of new notes |
CANSLIM.net Company Profile |
SEC |
Zacks Reports |
StockTalk |
News |
Chart |
Request a new note
C
A N
S L
I M
|
FLT
-
NYSE
Fleetcor Technologies
DIVERSIFIED SERVICES - Business/Management Services
|
$110.68
|
-0.05
-0.05% |
$111.64
|
1,429,113
237.39% of 50 DAV
50 DAV is 602,000
|
$112.50
-1.62%
|
8/19/2013
|
$99.01
|
PP = $100.97
|
|
MB = $106.02
|
Most Recent Note - 9/20/2013 5:50:19 PM
G - Perched near all-time highs after completing a Secondary Offering on 9/11/13. FLT has traded up as much as +58% since first featured in yellow in the mid-day report on 3/21/13 (read here).
>>> The latest Featured Stock Update with an annotated graph appeared on 9/6/2013. Click here.
View all notes |
Alert me of new notes |
CANSLIM.net Company Profile |
SEC |
Zacks Reports |
StockTalk |
News |
Chart |
Request a new note
C
A N
S L
I M
|
Symbol/Exchange
Company Name
Industry Group |
PRICE |
CHANGE
(%Change) |
Day High |
Volume
(% DAV)
(% 50 day avg vol) |
52 Wk Hi
% From Hi |
Featured
Date |
Price
Featured |
Pivot Featured |
|
Max Buy |
GNRC
-
NYSE
Generac Hldgs Inc
CONSUMER DURABLES - Electronic Equipment
|
$43.60
|
+1.42
3.37% |
$43.60
|
1,202,470
147.34% of 50 DAV
50 DAV is 816,100
|
$44.30
-1.58%
|
9/12/2013
|
$41.40
|
PP = $43.27
|
|
MB = $45.43
|
Most Recent Note - 9/20/2013 5:52:22 PM
Y - Closed at a new high after rallying above its pivot point today with +47% above average volume triggering a new technical buy signal.
>>> The latest Featured Stock Update with an annotated graph appeared on 8/22/2013. Click here.
View all notes |
Alert me of new notes |
CANSLIM.net Company Profile |
SEC |
Zacks Reports |
StockTalk |
News |
Chart |
Request a new note
C
A N
S L
I M
|
KORS
-
NYSE
Michael Kors Hldgs Ltd
RETAIL - Apparel Stores
|
$75.98
|
-1.51
-1.95% |
$77.29
|
3,431,178
94.75% of 50 DAV
50 DAV is 3,621,300
|
$78.62
-3.36%
|
8/6/2013
|
$69.66
|
PP = $66.28
|
|
MB = $69.59
|
Most Recent Note - 9/17/2013 3:04:29 PM
G - Extended from its prior base and volume totals have been cooling while consolidating near its 52-week high. Its 50 DMA line defines support above prior highs in the $66 area.
>>> The latest Featured Stock Update with an annotated graph appeared on 8/29/2013. Click here.
View all notes |
Alert me of new notes |
CANSLIM.net Company Profile |
SEC |
Zacks Reports |
StockTalk |
News |
Chart |
Request a new note
C
A N
S L
I M
|
LOPE
-
NASDAQ
Grand Canyon Education
DIVERSIFIED SERVICES - Education and; Training Services
|
$39.04
|
-0.56
-1.41% |
$39.84
|
555,954
139.72% of 50 DAV
50 DAV is 397,900
|
$39.99
-2.37%
|
6/19/2013
|
$31.47
|
PP = $34.17
|
|
MB = $35.88
|
Most Recent Note - 9/18/2013 7:39:16 PM
G - Surged to a new all-time high with today's gain backed by above average volume. Fundamental concerns remain while technical action has been reassuring.
>>> The latest Featured Stock Update with an annotated graph appeared on 9/12/2013. Click here.
View all notes |
Alert me of new notes |
CANSLIM.net Company Profile |
SEC |
Zacks Reports |
StockTalk |
News |
Chart |
Request a new note
C
A N
S L
I M
|
MRLN
-
NASDAQ
Marlin Business Services
DIVERSIFIED SERVICES - Rental and Leasing Services
|
$25.82
|
+0.27
1.06% |
$26.00
|
33,031
88.79% of 50 DAV
50 DAV is 37,200
|
$26.96
-4.23%
|
9/9/2013
|
$23.75
|
PP = $24.03
|
|
MB = $25.23
|
Most Recent Note - 9/20/2013 6:00:33 PM
G - Color code is changed to green as it is extended from its prior base. Perched at its 52-week high, stubbornly holding its ground and wedging higher with gains lacking great volume conviction since recently paying a $2.00 per share Special Dividend (latest Pivot Point, Max Buy and Featured Price were adjusted to accordingly).
>>> The latest Featured Stock Update with an annotated graph appeared on 9/9/2013. Click here.
View all notes |
Alert me of new notes |
CANSLIM.net Company Profile |
SEC |
Zacks Reports |
StockTalk |
News |
Chart |
Request a new note
C
A N
S L
I M
|
PCLN
-
NASDAQ
Priceline.Com Inc
INTERNET - Internet Software and Services
|
$1,003.01
|
+2.39
0.24% |
$1,007.15
|
568,230
91.34% of 50 DAV
50 DAV is 622,100
|
$1,003.31
-0.03%
|
9/13/2013
|
$966.82
|
PP = $995.08
|
|
MB = $1,044.83
|
Most Recent Note - 9/19/2013 7:11:16 PM
Y - Inched higher on below average volume today, wedging above its new pivot point cited based on its 8/09/13 high plus 10 cents. Subsequent volume-driven gains may clinch a proper new (or add-on) technical buy signal. See the latest FSU analysis for more details and a new annotated graph.
>>> The latest Featured Stock Update with an annotated graph appeared on 9/19/2013. Click here.
View all notes |
Alert me of new notes |
CANSLIM.net Company Profile |
SEC |
Zacks Reports |
StockTalk |
News |
Chart |
Request a new note
C
A N
S L
I M
|
Symbol/Exchange
Company Name
Industry Group |
PRICE |
CHANGE
(%Change) |
Day High |
Volume
(% DAV)
(% 50 day avg vol) |
52 Wk Hi
% From Hi |
Featured
Date |
Price
Featured |
Pivot Featured |
|
Max Buy |
PRAA
-
NASDAQ
Portfolio Recovery Assoc
DIVERSIFIED SERVICES - Business/Management Services
|
$59.09
|
-0.43
-0.72% |
$59.57
|
378,503
72.79% of 50 DAV
50 DAV is 520,000
|
$59.94
-1.42%
|
7/31/2013
|
$51.43
|
PP = $54.72
|
|
MB = $57.46
|
Most Recent Note - 9/17/2013 3:19:21 PM
G - Extended from its prior base and hovering very near its 52-week high for the past week with volume totals cooling. Found support above its 50 DMA line during the latest consolidation.
>>> The latest Featured Stock Update with an annotated graph appeared on 8/28/2013. Click here.
View all notes |
Alert me of new notes |
CANSLIM.net Company Profile |
SEC |
Zacks Reports |
StockTalk |
News |
Chart |
Request a new note
C
A N
S L
I M
|
PRLB
-
NYSE
Proto Labs Inc
MANUFACTURING - Small Tools and Accessories
|
$78.28
|
+0.45
0.58% |
$78.28
|
649,187
164.39% of 50 DAV
50 DAV is 394,900
|
$77.93
0.45%
|
7/29/2013
|
$64.86
|
PP = $67.50
|
|
MB = $70.88
|
Most Recent Note - 9/19/2013 7:19:20 PM
G - Hit a new 52-week high with today's 4th consecutive gain with near average volume. Support to watch is at prior highs and above its 50 DMA line coinciding in the $67 area.
>>> The latest Featured Stock Update with an annotated graph appeared on 8/27/2013. Click here.
View all notes |
Alert me of new notes |
CANSLIM.net Company Profile |
SEC |
Zacks Reports |
StockTalk |
News |
Chart |
Request a new note
C
A N
S L
I M
|
QCOR
-
NASDAQ
Questcor Pharmaceuticals
DRUGS - Biotechnology
|
$55.33
|
-5.35
-8.82% |
$61.78
|
7,409,708
441.53% of 50 DAV
50 DAV is 1,678,200
|
$74.76
-25.99%
|
7/31/2013
|
$66.46
|
PP = $59.01
|
|
MB = $61.96
|
Most Recent Note - 9/20/2013 3:07:00 PM
Down considerably today on heavier volume after a damaging violation of its 50 DMA line on the prior session triggered a technical sell signal. It will be dropped from the Featured Stocks list tonight due to technical deterioration. Only a prompt rebound above the 50 DMA line may help its outlook improve. Members were recently cautioned - "A breach of the prior low ($60.31 on 9/11/13) may trigger a more worrisome technical sell signal."
>>> The latest Featured Stock Update with an annotated graph appeared on 8/26/2013. Click here.
View all notes |
Alert me of new notes |
CANSLIM.net Company Profile |
SEC |
Zacks Reports |
StockTalk |
News |
Chart |
Request a new note
C
A N
S L
I M
|
SFUN
-
NYSE
Soufun Hldgs Ltd Ads A
INTERNET - Internet Information Providers
|
$47.62
|
-1.13
-2.32% |
$50.19
|
1,295,016
139.91% of 50 DAV
50 DAV is 925,600
|
$53.77
-11.44%
|
7/16/2013
|
$29.54
|
PP = $27.90
|
|
MB = $29.30
|
Most Recent Note - 9/18/2013 12:45:14 PM
G - Rebounding toward its prior high with above average volume behind today's considerable gain. Recently noted - "It is still very extended from any sound base. Recent highs near $42 define initial support to watch on pullbacks."
>>> The latest Featured Stock Update with an annotated graph appeared on 8/30/2013. Click here.
View all notes |
Alert me of new notes |
CANSLIM.net Company Profile |
SEC |
Zacks Reports |
StockTalk |
News |
Chart |
Request a new note
C
A N
S L
I M
|
SSNC
-
NASDAQ
S S & C Technologies
COMPUTER SOFTWARE and SERVICES - Application Software
|
$39.39
|
+0.71
1.84% |
$39.46
|
872,911
200.30% of 50 DAV
50 DAV is 435,800
|
$39.94
-1.38%
|
9/5/2013
|
$36.01
|
PP = $38.90
|
|
MB = $40.85
|
Most Recent Note - 9/20/2013 6:12:47 PM
Y - Posted a solid gain today with above average volume, finishing back above the pivot point cited based on its 8/02/13 high plus 10 cents. Recently announced a Secondary Offering while perched at all-time highs.
>>> The latest Featured Stock Update with an annotated graph appeared on 9/5/2013. Click here.
View all notes |
Alert me of new notes |
CANSLIM.net Company Profile |
SEC |
Zacks Reports |
StockTalk |
News |
Chart |
Request a new note
C
A N
S L
I M
|
Symbol/Exchange
Company Name
Industry Group |
PRICE |
CHANGE
(%Change) |
Day High |
Volume
(% DAV)
(% 50 day avg vol) |
52 Wk Hi
% From Hi |
Featured
Date |
Price
Featured |
Pivot Featured |
|
Max Buy |
SSYS
-
NASDAQ
Stratasys Ltd
COMPUTER HARDWARE - Computer Peripherals
|
$99.49
|
+0.34
0.34% |
$101.14
|
1,171,840
109.75% of 50 DAV
50 DAV is 1,067,700
|
$113.49
-12.33%
|
7/8/2013
|
$91.44
|
PP = $95.00
|
|
MB = $99.75
|
Most Recent Note - 9/17/2013 3:34:35 PM
Y - Rebounding near its 50 DMA line after completing a new Public Offering on 9/13/13 perched near all-time highs.
>>> The latest Featured Stock Update with an annotated graph appeared on 9/10/2013. Click here.
View all notes |
Alert me of new notes |
CANSLIM.net Company Profile |
SEC |
Zacks Reports |
StockTalk |
News |
Chart |
Request a new note
C
A N
S L
I M
|
STMP
-
NASDAQ
Stamps.Com Inc
INTERNET - Internet Software and Services
|
$44.52
|
-0.33
-0.74% |
$44.91
|
88,321
68.73% of 50 DAV
50 DAV is 128,500
|
$46.47
-4.20%
|
7/31/2013
|
$40.00
|
PP = $42.98
|
|
MB = $45.13
|
Most Recent Note - 9/17/2013 3:39:21 PM
Y - Poised for a best-ever close with today's small gain on light volume. Recently found encouraging support at its 50 DMA line.
>>> The latest Featured Stock Update with an annotated graph appeared on 8/23/2013. Click here.
View all notes |
Alert me of new notes |
CANSLIM.net Company Profile |
SEC |
Zacks Reports |
StockTalk |
News |
Chart |
Request a new note
C
A N
S L
I M
|
TBBK
-
NASDAQ
Bancorp Inc
BANKING - Regional - Mid-Atlantic Banks
|
$18.23
|
+0.45
2.53% |
$18.33
|
184,754
109.13% of 50 DAV
50 DAV is 169,300
|
$18.38
-0.82%
|
9/4/2013
|
$16.26
|
PP = $16.79
|
|
MB = $17.63
|
Most Recent Note - 9/20/2013 6:02:09 PM
G - Rallied for a new high close with near average volume today. Prior highs define important near-term support to watch near $16 on pullbacks. Rallied +12% higher since highlighted on 9/04/13 under the headline, "Forming Sound Set-Up While "M" Correction Remains Overriding Concern".
>>> The latest Featured Stock Update with an annotated graph appeared on 9/4/2013. Click here.
View all notes |
Alert me of new notes |
CANSLIM.net Company Profile |
SEC |
Zacks Reports |
StockTalk |
News |
Chart |
Request a new note
C
A N
S L
I M
|
TNGO
-
NASDAQ
Tangoe Inc
COMPUTER SOFTWARE and SERVICES - Technical and System Software
|
$23.46
|
-0.08
-0.34% |
$23.75
|
604,878
117.41% of 50 DAV
50 DAV is 515,200
|
$23.72
-1.10%
|
9/12/2013
|
$21.30
|
PP = $23.15
|
|
MB = $24.31
|
Most Recent Note - 9/17/2013 6:43:01 PM
Y - Today's gain lacked sufficient volume conviction while wedging above its pivot point cited based on its May 2012 high plus 10 cents. See the latest FSU analysis for more details and a new annotated daily graph.
>>> The latest Featured Stock Update with an annotated graph appeared on 9/17/2013. Click here.
View all notes |
Alert me of new notes |
CANSLIM.net Company Profile |
SEC |
Zacks Reports |
StockTalk |
News |
Chart |
Request a new note
C
A N
S L
I M
|
VRX
-
NYSE
Valeant Pharmaceuticals
DRUGS - Drug Manufacturers - Other
|
$104.41
|
-1.71
-1.61% |
$106.85
|
1,446,810
121.89% of 50 DAV
50 DAV is 1,187,000
|
$106.98
-2.40%
|
9/11/2013
|
$100.26
|
PP = $105.50
|
|
MB = $110.78
|
Most Recent Note - 9/19/2013 7:17:42 PM
Y- Rose above its pivot point and hit a new 52-week high with today's 4th consecutive gain backed by +37% above average volume, just below the minimum volume threshold (+40% above average) needed to trigger a proper technical buy signal. Recent insider buying while trading near its highs has been noted as an encouraging sign.
>>> The latest Featured Stock Update with an annotated graph appeared on 9/11/2013. Click here.
View all notes |
Alert me of new notes |
CANSLIM.net Company Profile |
SEC |
Zacks Reports |
StockTalk |
News |
Chart |
Request a new note
C
A N
S L
I M
|
Symbol/Exchange
Company Name
Industry Group |
PRICE |
CHANGE
(%Change) |
Day High |
Volume
(% DAV)
(% 50 day avg vol) |
52 Wk Hi
% From Hi |
Featured
Date |
Price
Featured |
Pivot Featured |
|
Max Buy |
YNDX
-
NASDAQ
Yandex N V Class A
INTERNET - Internet Information Providers
|
$36.59
|
-1.34
-3.53% |
$38.10
|
3,055,403
124.24% of 50 DAV
50 DAV is 2,459,200
|
$37.97
-3.63%
|
9/5/2013
|
$34.24
|
PP = $34.79
|
|
MB = $36.53
|
Most Recent Note - 9/20/2013 5:47:23 PM
G - Color code is changed to green. Reversed from new 52-week and all-time highs today, finishing near its "max buy" level. Prior highs in the $34 area define near-term support.
>>> The latest Featured Stock Update with an annotated graph appeared on 9/18/2013. Click here.
View all notes |
Alert me of new notes |
CANSLIM.net Company Profile |
SEC |
Zacks Reports |
StockTalk |
News |
Chart |
Request a new note
C
A N
S L
I M
|