You are not logged in.
This means you
CAN ONLY VIEW reports that were published prior to Monday, February 26, 2024.
You
MUST UPGRADE YOUR MEMBERSHIP if you want to see any current reports.
AFTER MARKET UPDATE - TUESDAY, SEPTEMBER 17TH, 2019
Previous After Market Report Next After Market Report >>>
|
|
|
|
DOW |
+33.98 |
27,110.80 |
+0.13% |
|
Volume |
836,800,380 |
-8% |
|
Volume |
1,845,909,740 |
+0% |
|
NASDAQ |
+32.48 |
8,186.02 |
+0.40% |
|
Advancers |
1,545 |
53% |
|
Advancers |
1,363 |
44% |
|
S&P 500 |
+7.74 |
3,005.70 |
+0.26% |
|
Decliners |
1,342 |
46% |
|
Decliners |
1,701 |
55% |
|
Russell 2000 |
-6.31 |
1,578.29 |
-0.40% |
|
52 Wk Highs |
58 |
|
|
52 Wk Highs |
63 |
|
|
S&P 600 |
-2.59 |
976.60 |
-0.26% |
|
52 Wk Lows |
7 |
|
|
52 Wk Lows |
27 |
|
|
 |
Indices Posted Small Gains on Mixed Session
Kenneth J. Gruneisen - Passed the CAN SLIM® Master's Exam
The Dow added 33 points, while the S&P 500 gained 0.3%. The Nasdaq Composite was up 0.4%. The volume totals reported were mixed, lighter than the prior session total on the NYSE and slightly higher on the Nasdaq exchange. Advancers led decliners by an 8-7 margin on the NYSE while decliners led advancers by 8-7 on the Nasdaq exchange. Leadership thinned as there were 19 high-ranked companies from the Leaders List hit new 52-week highs and were listed on the BreakOuts Page, versus the total of 27 on the prior session. New 52-week highs totals still outnumbered new 52-week lows totals on the NYSE and on the Nasdaq exchange. Concerning the M criteria of the fact-based investment system, investors have a green light to make carefully selected new buying efforts. The Featured Stocks Page provides the most timely analysis on high-ranked leaders. Charts used courtesy of www.stockcharts.com
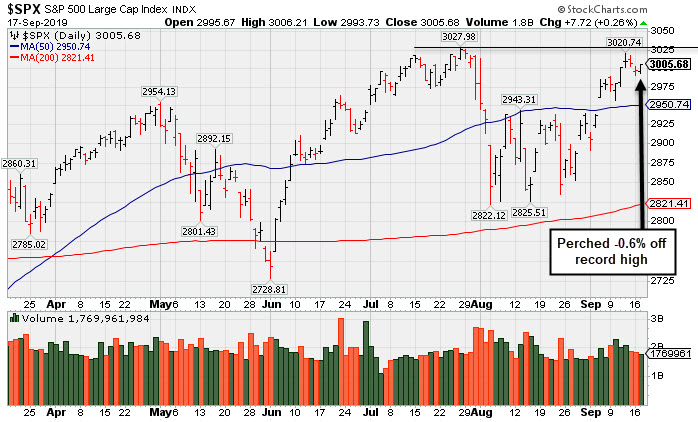
PICTURED: The S&P 500 Index is perched -0.6% off its record high.
Stocks finished higher Tuesday as investors digested geopolitical updates and awaited the conclusion of the Federal Reserve’s policy meeting Wednesday. WTI crude fell 5.7% to $59.34/barrel on news Saudi Arabia’s oil supply will be fully restored by the end of the month with 50% of the country’s oil output lost over the weekend already reinstated. On Saturday, attacks on Saudi Arabia’s crude production facilities shut off roughly 5% of the world’s oil supply, sparking concern over the impact to economic growth. WTI crude spiked 14.8% Monday, its largest jump since 2008.
Elsewhere, the Federal Reserve Bank of New York injected $53 billion into the banking system to help stabilize the repo market, which had seen a sharp uptick in rates due several factors, including a quarterly corporate tax deadline and settlement for certain major Treasury auctions. Treasuries advanced with the yield on the 10-year note down three basis points to 1.81%.
Ten of 11 S&P 500 sectors closed in positive territory, with the Energy group the sole decliner amid a reversal in oil prices. In corporate news, Kraft Heinz (KHC -4.25%) fell after its second largest shareholder sold more than 25 million shares. Home Depot (HD -0.34%) finished slightly lower following an analyst downgrade.
On the data front, industrial production rose 0.6% in August, topping expectations and the prior 0.1% dip. Separately, the NAHB Housing Market Index revealed homebuilder sentiment increased in September to the highest level this year.
|
 Kenneth J. Gruneisen started out as a licensed stockbroker in August 1987, a couple of months prior to the historic stock market crash that took the Dow Jones Industrial Average down -22.6% in a single day. He has published daily fact-based fundamental and technical analysis on high-ranked stocks online for two decades. Through FACTBASEDINVESTING.COM, Kenneth provides educational articles, news, market commentary, and other information regarding proven investment systems that work in good times and bad.
Comments contained in the body of this report are technical opinions only and are not necessarily those of Gruneisen Growth Corp. The material herein has been obtained from sources believed to be reliable and accurate, however, its accuracy and completeness cannot be guaranteed. Our firm, employees, and customers may effect transactions, including transactions contrary to any recommendation herein, or have positions in the securities mentioned herein or options with respect thereto. Any recommendation contained in this report may not be suitable for all investors and it is not to be deemed an offer or solicitation on our part with respect to the purchase or sale of any securities. |
|
 |
Retail, Gold & Silver, and Semiconductor Indexes Rose
Kenneth J. Gruneisen - Passed the CAN SLIM® Master's Exam
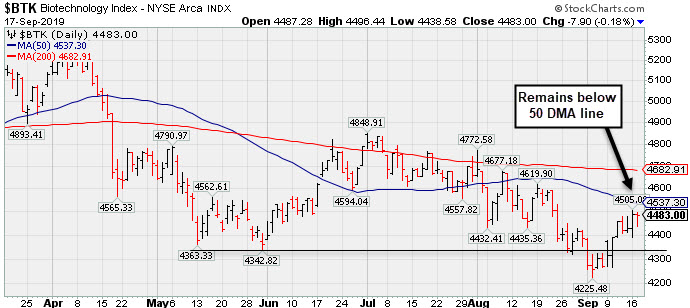
The Bank Index ($BKX -0.76%) and the Broker/Dealer Index ($XBD -0.55%) both lost ground while the Retail Index ($RLX +0.56%) posted a modest gain. The tech sector was mixed as the Networking Index ($NWX -1.00%) and Biotech Index ($BTK -0.18%) fell and the Semiconductor Index ($SOX +0.33%) finished slightly higher. Energy-linked groups were standout decliners as the Oil Services Index ($OSX -5.04%) and Integrated Oil Index ($XOI -1.72%) both fell, meanwhile the Gold & Silver Index ($XAU +2.65%) posted a solid gain.
PICTURED: The Biotech Index ($BTK -0.18%) has rebounded from its 2019 low but remains below its 50-day moving average line.
| Oil Services |
$OSX |
74.25 |
-3.94 |
-5.04% |
-7.88% |
| Integrated Oil |
$XOI |
1,252.08 |
-21.92 |
-1.72% |
+8.02% |
| Semiconductor |
$SOX |
1,599.74 |
+5.25 |
+0.33% |
+38.49% |
| Networking |
$NWX |
566.92 |
-5.70 |
-1.00% |
+16.01% |
| Broker/Dealer |
$XBD |
276.60 |
-1.54 |
-0.55% |
+16.54% |
| Retail |
$RLX |
2,407.80 |
+13.39 |
+0.56% |
+23.39% |
| Gold & Silver |
$XAU |
93.02 |
+2.41 |
+2.66% |
+31.64% |
| Bank |
$BKX |
101.03 |
-0.77 |
-0.76% |
+17.76% |
| Biotech |
$BTK |
4,483.00 |
-7.90 |
-0.18% |
+6.21% |
|
|
|
 |
Recent Spurt of Gains for New Highs Marked By Volume
Kenneth J. Gruneisen - Passed the CAN SLIM® Master's Exam
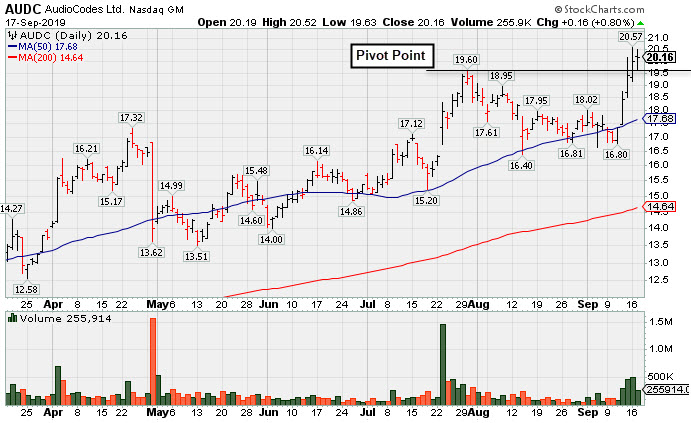
Audiocodes Ltd (AUDC +$0.16 of +0.80% to $20.16) is perched at its all-time high after 5 consecutive gains. Its gain above the pivot point backed by at least +40% above average volume triggered a new (or add-on) technical buy signal. It found prompt support near its 50-day moving average (DMA line ($17.75). The recent low ($16.51 on 8/14/19) defines important support where more damaging losses would raise concerns and trigger technical sell signals.
Bullish action came after it reported earnings +57% on +14% sales revenues for the Jun '19 quarter, continuing its strong earnings track record for a 10th consecutive quarterly comparison above the +25% minimum guideline (C criteria). Annual earnings growth has been strong and it has a 99 Earnings Per Share Rating.
AUDC was highlighted in yellow with new pivot point cited based on its 4/24/19 high plus 10 cents in the 7/15/19 mid-day report (read here). This Israel-based designer of advanced voice-over-IP products shown in this FSU section on 8/30/19 with an annotated graph under the headline, "Volume Cooling While Consolidating Above Support Levels".
The number of top-rated funds owning its shares rose from 33 in Mar '18 to 73 in Jun '19, a reassuring sign concerning the I criteria. Its current Up/Down Volume Ratio of 1.6 is an unbiased indication its shares have been under accumulation over the past 50 days. It has a Timeliness Rating of A and Sponsorship Rating of A. The small supply of 22.8 million shares (S criteria) in the public float can contribute to greater price volatility in the event of institutional buying or selling.
Charts courtesy of www.stockcharts.com
 |
|
|
Color Codes Explained :
Y - Better candidates highlighted by our
staff of experts.
G - Previously featured
in past reports as yellow but may no longer be buyable under the
guidelines.
***Last / Change / Volume data in this table is the closing quote data***
Symbol/Exchange
Company Name
Industry Group |
PRICE |
CHANGE
(%Change) |
Day High |
Volume
(% DAV)
(% 50 day avg vol) |
52 Wk Hi
% From Hi |
Featured
Date |
Price
Featured |
Pivot Featured |
|
Max Buy |
 CCBG
-
NASDAQ
CCBG
-
NASDAQ
Capital City Bk Gp
BANKING - Regional - Mid-Atlantic Banks
|
$26.49
|
-0.41
-1.52% |
$26.92
|
33,393
166.97% of 50 DAV
50 DAV is 20,000
|
$27.24
-2.75%
|
9/13/2019
|
$27.03
|
PP = $27.05
|
|
MB = $28.40
|
 Most Recent Note - 9/17/2019 5:50:09 PM
Y - Perched near its 52-week high. Subsequent volume-driven gains above the pivot point may trigger a technical buy signal.
>>> FEATURED STOCK ARTICLE : Thinly Traded Bank Rallied To Multi-Year Highs - 9/13/2019 |
View all notes |
Set NEW NOTE alert |
Company Profile |
SEC
News |
Chart |
Request a new note
C
A
S
I |
EPAM
-
NYSE
Epam Systems Inc
COMPUTER SOFTWARE and SERVICES - Information Technology Service
|
$183.26
|
+2.31
1.28% |
$183.64
|
197,287
49.08% of 50 DAV
50 DAV is 402,000
|
$201.00
-8.83%
|
5/9/2019
|
$169.25
|
PP = $180.55
|
|
MB = $189.58
|
Most Recent Note - 9/16/2019 5:56:58 PM
G - Halted its slide above the prior low ($175.33 on 8/07/19) which defines the next important support level. A rebound above its 50 DMA line ($190) is needed for its outlook to improve. Reported earnings +27% on +24% sales revenues for the Jun '19 quarter. See the latest FSU analysis for more details and a new annotated graph.
>>> FEATURED STOCK ARTICLE : Recent Slump Below 50-Day Average Hurt Outlook - 9/16/2019 |
View all notes |
Set NEW NOTE alert |
Company Profile |
SEC
News |
Chart |
Request a new note
C
A
S
I |
AUDC
-
NASDAQ
Audiocodes Ltd
ELECTRONICS - Scientific and Technical Instrum
|
$20.16
|
+0.16
0.80% |
$20.52
|
255,910
130.57% of 50 DAV
50 DAV is 196,000
|
$20.57
-1.99%
|
9/13/2019
|
$19.68
|
PP = $19.84
|
|
MB = $20.83
|
Most Recent Note - 9/17/2019 5:35:11 PM
Y - Perched at its all-time high after 5 consecutive gains marked by volume. Its gain above the pivot point triggered a new (or add-on) technical buy signal. Found prompt support near its 50 DMA line ($17.74). The recent low ($16.51 on 8/14/19) defines important support where more damaging losses would raise concerns and trigger technical sell signals. Reported earnings +57% on +14% sales revenues for the Jun '19 quarter, continuing its strong earnings track record. See the latest FSU analysis for more details and a new annotated graph.
>>> FEATURED STOCK ARTICLE : Recent Spurt of Gains for New Highs Marked By Volume - 9/17/2019 |
View all notes |
Set NEW NOTE alert |
Company Profile |
SEC
News |
Chart |
Request a new note
C
A
S
I |
LHCG
-
NASDAQ
L H C Group Inc
HEALTH SERVICES - Home Health Care
|
$119.40
|
+0.99
0.84% |
$121.00
|
263,002
121.76% of 50 DAV
50 DAV is 216,000
|
$129.37
-7.71%
|
7/1/2019
|
$110.94
|
PP = $122.20
|
|
MB = $128.31
|
Most Recent Note - 9/12/2019 5:25:50 PM
G - Halted its slide after losses this week undercutting the prior low ($116.67 on 8/13/19) triggering a worrisome technical sell signal. Still sputtering below its 50 DMA line ($121.37) which has acted as resistance. See the latest FSU analysis for more details and a new annotated graph.
>>> FEATURED STOCK ARTICLE : 50-Day Moving Average Recently Acted as Resistance - 9/12/2019 |
View all notes |
Set NEW NOTE alert |
Company Profile |
SEC
News |
Chart |
Request a new note
C
A
S
I |
CHDN
-
NASDAQ
Churchill Downs Inc
LEISURE - Gaming Activities
|
$123.72
|
+0.22
0.18% |
$124.65
|
163,137
73.49% of 50 DAV
50 DAV is 222,000
|
$132.73
-6.79%
|
7/22/2019
|
$118.45
|
PP = $118.89
|
|
MB = $124.83
|
Most Recent Note - 9/16/2019 5:53:56 PM
Y - Volume has been cooling while consolidating above its 50 DMA line ($120.45). Below that important short-term average, the prior low ($113.88 on 8/05/19) defines the next support level. Jun '19 earnings +10% on +26% sales revenues versus the year ago period were below the +25% minimum earnings guideline (C criteria), noted recently raising fundamental concerns.
>>> FEATURED STOCK ARTICLE : Found Support After Making Limited Progress - 9/4/2019 |
View all notes |
Set NEW NOTE alert |
Company Profile |
SEC
News |
Chart |
Request a new note
C
A
S
I |
Symbol/Exchange
Company Name
Industry Group |
PRICE |
CHANGE
(%Change) |
Day High |
Volume
(% DAV)
(% 50 day avg vol) |
52 Wk Hi
% From Hi |
Featured
Date |
Price
Featured |
Pivot Featured |
|
Max Buy |
LULU
-
NASDAQ
Lululemon Athletica
MANUFACTURING - Textile Manufacturing
|
$195.47
|
+1.77
0.91% |
$197.33
|
1,201,858
67.71% of 50 DAV
50 DAV is 1,775,000
|
$204.44
-4.39%
|
9/6/2019
|
$201.25
|
PP = $194.35
|
|
MB = $204.07
|
Most Recent Note - 9/13/2019 5:19:40 PM
Y - Quietly hovering near its all-time high following volume driven gains. Reported earnings +35% on +22% sales revenues for the Jul '19 quarter. Prior high ($194.25) defines initial support to watch above its 50 DMA line ($188.84).
>>> FEATURED STOCK ARTICLE : Sank Below 50-Day Average Toward Prior Lows With High Volume - 9/3/2019 |
View all notes |
Set NEW NOTE alert |
Company Profile |
SEC
News |
Chart |
Request a new note
C
A
S
I |
CPRT
-
NASDAQ
Copart Inc
SPECIALTY RETAIL - Auto Dealerships
|
$83.44
|
+1.26
1.53% |
$83.70
|
1,215,089
95.23% of 50 DAV
50 DAV is 1,276,000
|
$83.55
-0.13%
|
9/5/2019
|
$79.13
|
PP = $79.84
|
|
MB = $83.83
|
Most Recent Note - 9/16/2019 5:55:46 PM
Y - Perched near its all-time high after today's 3rd consecutive volume-driven gain. Held its ground after the big volume-driven gain above the pivot point on 9/05/19 clinched a technical buy signal. Fundamentals are strong.
>>> FEATURED STOCK ARTICLE : Heavy Volume Behind Breakout Gain After Earnings Report - 9/5/2019 |
View all notes |
Set NEW NOTE alert |
Company Profile |
SEC
News |
Chart |
Request a new note
C
A
S
I |
BLD
-
NYSE
Topbuild Corp
Bldg-Constr Prds/Misc
|
$93.74
|
+0.21
0.22% |
$95.35
|
301,186
105.68% of 50 DAV
50 DAV is 285,000
|
$96.01
-2.36%
|
5/17/2019
|
$82.19
|
PP = $87.31
|
|
MB = $91.68
|
Most Recent Note - 9/16/2019 5:53:10 PM
G - Perched near its all-time high. holding its ground following a negative reversal on 9/12/19. Earnings rose +39% on +9% sales revenues for the Jun '19 quarter versus the year ago period. Prior highs in the $86 area and its 50 DMA line ($87.44) coincide defining important support to watch on pullbacks.
>>> FEATURED STOCK ARTICLE : Holding Ground Stubbornly in Tight Range Near Record High - 9/10/2019 |
View all notes |
Set NEW NOTE alert |
Company Profile |
SEC
News |
Chart |
Request a new note
C
A
S
I |
PAGS
-
NYSE
Pagseguro Digital Cl A
Finance-CrdtCard/PmtPr
|
$47.76
|
+1.88
4.10% |
$48.33
|
1,327,676
60.93% of 50 DAV
50 DAV is 2,179,000
|
$53.43
-10.61%
|
6/25/2019
|
$37.69
|
PP = $40.07
|
|
MB = $42.07
|
Most Recent Note - 9/17/2019 5:45:04 PM
G - Posted another big gain today on lighter than average volume as it rebounded and closed above its 50 DMA line ($47.02) helping its outlook to improve. Big losses last week triggered a technical sell signal, but it halted its slide above the prior low ($42.00 on 8/05/19) which defines the next important chart support level. Fundamentals are strong.
>>> FEATURED STOCK ARTICLE : 50-Day Moving Average Violation Triggered Technical Sell Signal - 9/11/2019 |
View all notes |
Set NEW NOTE alert |
Company Profile |
SEC
News |
Chart |
Request a new note
C
A
S
I |
|
|
|
THESE ARE NOT BUY RECOMMENDATIONS!
Comments contained in the body of this report are technical
opinions only. The material herein has been obtained
from sources believed to be reliable and accurate, however,
its accuracy and completeness cannot be guaranteed.
This site is not an investment advisor, hence it does
not endorse or recommend any securities or other investments.
Any recommendation contained in this report may not
be suitable for all investors and it is not to be deemed
an offer or solicitation on our part with respect to
the purchase or sale of any securities. All trademarks,
service marks and trade names appearing in this report
are the property of their respective owners, and are
likewise used for identification purposes only.
This report is a service available
only to active Paid Premium Members.
You may opt-out of receiving report notifications
at any time. Questions or comments may be submitted
by writing to Premium Membership Services 665 S.E. 10 Street, Suite 201 Deerfield Beach, FL 33441-5634 or by calling 1-800-965-8307
or 954-785-1121.
|
|
|