You are not logged in.
This means you
CAN ONLY VIEW reports that were published prior to Monday, April 14, 2025.
You
MUST UPGRADE YOUR MEMBERSHIP if you want to see any current reports.
AFTER MARKET UPDATE - MONDAY, SEPTEMBER 15TH, 2014
Previous After Market Report Next After Market Report >>>
|
|
|
|
DOW |
+43.63 |
17,031.14 |
+0.26% |
|
Volume |
577,134,600 |
-15% |
|
Volume |
1,803,588,560 |
+11% |
|
NASDAQ |
-48.70 |
4,518.90 |
-1.07% |
|
Advancers |
1,038 |
33% |
|
Advancers |
644 |
21% |
|
S&P 500 |
-1.41 |
1,984.13 |
-0.07% |
|
Decliners |
2,033 |
64% |
|
Decliners |
2,284 |
76% |
|
Russell 2000 |
-14.09 |
1,146.52 |
-1.21% |
|
52 Wk Highs |
27 |
|
|
52 Wk Highs |
30 |
|
|
S&P 600 |
-6.61 |
657.95 |
-0.99% |
|
52 Wk Lows |
79 |
|
|
52 Wk Lows |
92 |
|
|
 |
Major Averages Ended Mixed After Rebound from Session Lows
Kenneth J. Gruneisen - Passed the CAN SLIM® Master's Exam
The major averages ended Monday's session mixed. Volume totals were reported mixed, lighter than the prior session total on the NYSE and higher on the Nasdaq exchange. Breadth was negative as decliners led advancers by a 2-1 margin on the NYSE and by more than 3-1 on the NASDAQ exchange. Leadership waned as there were 15 high-ranked companies from the CANSLIM.net Leaders List that made new 52-week highs and appeared on the CANSLIM.net BreakOuts Page, down from the prior session total of 29 stocks. New 52-week lows outnumbered new 52-week highs on the Nasdaq exchange and on the NYSE. There were gains for only 2 of the 13 high-ranked companies currently included on the Featured Stocks Page. The broader market (M criteria) has encountered distributional pressure while leadership (stocks hitting new 52-week highs) has waned. Remember that disciplined investors buy stocks with superior fundamentals only after they have triggered a proper technical buy signal.
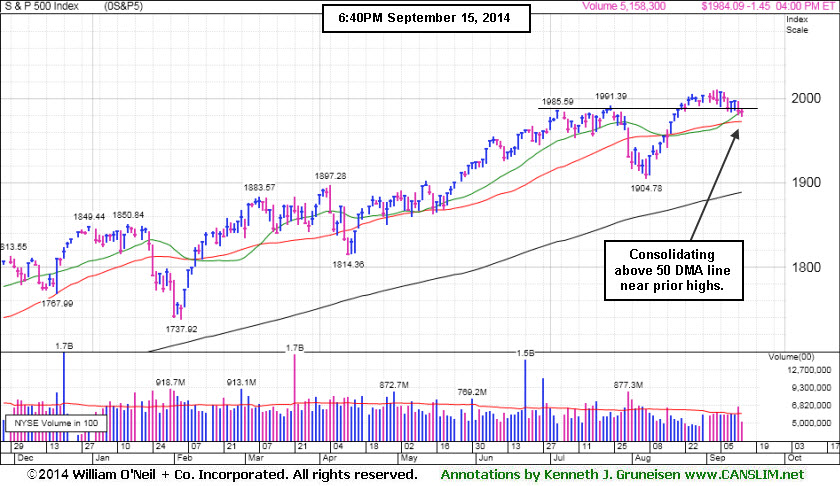
PICTURED: The S&P 500 declined less than 2 points to 1,984. The benchmark index is consolidating above its 50-day moving average (DMA) line near prior highs.
The Dow gained 43 points to 17,031, meanwhile the NASDAQ fell 48 points to 4,518. The major averages finished off their session lows but losses in technology weighed on the market. Facebook (FB -3.8%) slumped. Microsoft (MSFT -1.1%) sank following news that it agreed to acquire Mojang, the maker of the popular game Minecraft.
This week's all-important FOMC meeting kept investors cautious. The Fed is expected to announce another $10 billion cut to its monthly bond purchases and investors will look to the statement on Wednesday for any indications as to when the central bank may begin raising interest rates.
On the economic front, the latest data was mixed. A gauge on New York area manufacturing unexpectedly rose to the best level since October 2009 while a separate report showed industrial production fell in August for the first time in seven months.
Overall, six of the 10 S&P 500 sectors finished higher. Energy was the best performing group as WTI crude rebounded from Friday's decline and Chevron (CVX +1.4%) was among gainers. Defensive issues also gained ground as consumer staples and telecom advanced. Altria (MO +2.6%) rose and AT&T (T +0.4%) edged higher.
Treasuries advanced. The 10-year note gained 6/32 to yield 2.59%.
The CANSLIM.net Featured Stocks Page shows the most action-worthy candidates and their latest notes and a Headline Link directs members to the latest detailed analysis with data-packed graphs annotated by a Certified expert along with links to additional resources. The Premium Member Homepage includes "dynamic archives" to all prior pay reports published
|
 Kenneth J. Gruneisen started out as a licensed stockbroker in August 1987, a couple of months prior to the historic stock market crash that took the Dow Jones Industrial Average down -22.6% in a single day. He has published daily fact-based fundamental and technical analysis on high-ranked stocks online for two decades. Through FACTBASEDINVESTING.COM, Kenneth provides educational articles, news, market commentary, and other information regarding proven investment systems that work in good times and bad.
Comments contained in the body of this report are technical opinions only and are not necessarily those of Gruneisen Growth Corp. The material herein has been obtained from sources believed to be reliable and accurate, however, its accuracy and completeness cannot be guaranteed. Our firm, employees, and customers may effect transactions, including transactions contrary to any recommendation herein, or have positions in the securities mentioned herein or options with respect thereto. Any recommendation contained in this report may not be suitable for all investors and it is not to be deemed an offer or solicitation on our part with respect to the purchase or sale of any securities. |
|
 |
Tech and Retail Weakness Again Weighed on Major Indices
Kenneth J. Gruneisen - Passed the CAN SLIM® Master's Exam
The tech sector had a negative bias as the Biotechnology Index ($BTK -1.57%), Networking Index ($NWX -1.28%), and Semiconductor Index ($SOX -1.20%) suffered unanimous losses. The Retail Index ($RLX -0.69%) created negative pressure on the major averages and the Broker/Dealer Index ($XBD -0.54%) also fell, meanwhile the Bank Index ($BKX -0.08%) edged lower and the Gold & Silver Index ($XAU +0.03%) finished flat. Energy-related shares had a positive bias as the Oil Services Index ($OSX +0.13%) and Integrated Oil Index ($XOI +0.78%) rose.
Charts courtesy www.stockcharts.com
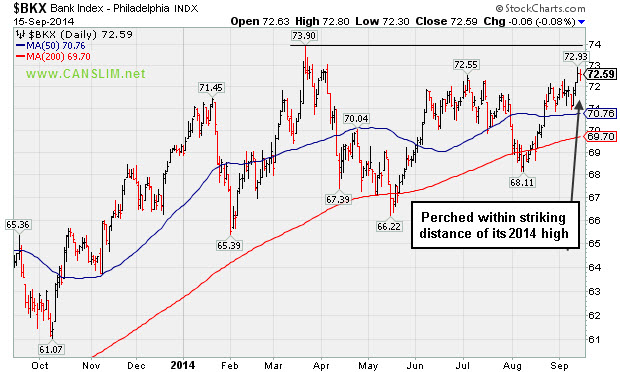
PICTURED: The Bank Index ($BKX -0.08%) is perched within striking distance of its 2014 high. It is a reassuring "leading indicator" to see healthy action in financial shares.
| Oil Services |
$OSX |
280.68 |
+0.36 |
+0.13% |
-0.12% |
| Integrated Oil |
$XOI |
1,614.60 |
+12.51 |
+0.78% |
+7.41% |
| Semiconductor |
$SOX |
632.24 |
-7.65 |
-1.20% |
+18.17% |
| Networking |
$NWX |
334.54 |
-4.35 |
-1.28% |
+3.27% |
| Broker/Dealer |
$XBD |
172.77 |
-0.94 |
-0.54% |
+7.60% |
| Retail |
$RLX |
934.43 |
-6.53 |
-0.69% |
-0.57% |
| Gold & Silver |
$XAU |
91.69 |
+0.03 |
+0.03% |
+8.96% |
| Bank |
$BKX |
72.59 |
-0.06 |
-0.08% |
+4.81% |
| Biotech |
$BTK |
3,033.36 |
-48.33 |
-1.57% |
+30.16% |
|
|
|
 |
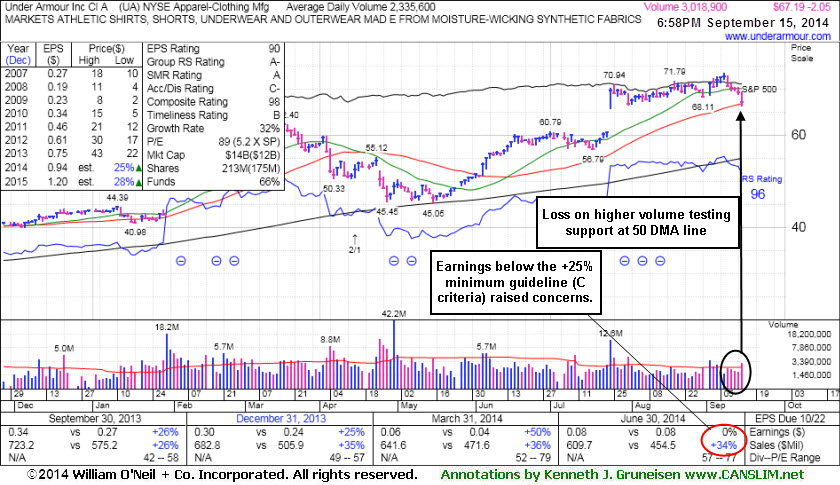
Higher Volume Behind Loss Testing 50-Day Moving Average
Kenneth J. Gruneisen - Passed the CAN SLIM® Master's Exam
Under Armour Inc (UA -$2.05 or -0.54% to $67.19) slumped to its 50-day moving average (DMA) line ($66.73) with higher volume behind today's 5th consecutive loss. Keep in mind that, while retreating from its 52-week high, fundamental concerns were raised by earnings reported +0% on +34% sales revenues for the Jun '14 quarter, below the +25% minimum earnings guideline (C criteria). The fact-based investment system's rule prompts selling if any stock falls more than -7% from the purchase price. If market conditions deteriorate it could be extra motivation to limit losses in fundamentally faltering stocks even before a loss might reach the -7% threshold.
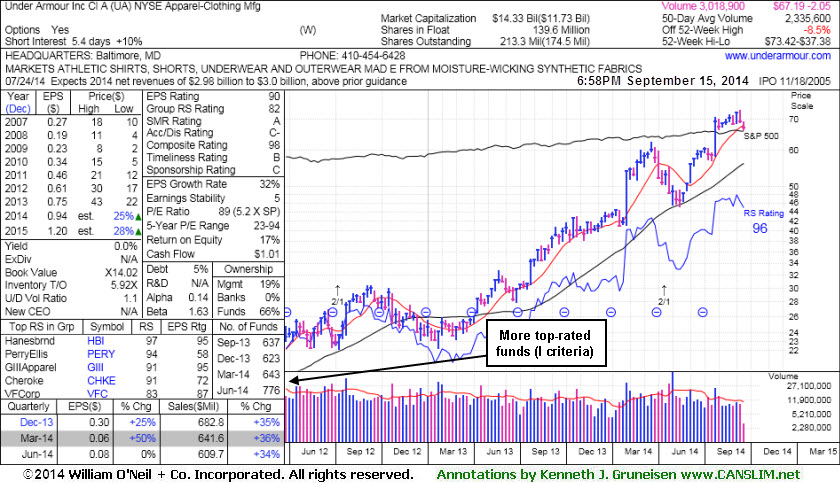
UA was last shown in this FSU section on 8/26/14 with annotated graphs under the headline, "Holding Ground Near All-Time Highs Despite Fundamental Concerns". A small bit of resistance remains due to overhead supply and it may find support near its 50 DMA line. However, some concerns are raised by the fact that it made only limited headway following a considerable "breakaway gap" on 7/24/14 with more than 4 times average volume. The high-ranked Apparel firm was highlighted in yellow with pivot point based on its 7/01/14 high in the 7/10/14 mid-day report (read here). Its annual earnings (A criteria) history has been strong. The number of top-rated funds owning its shares rose from 637 in Dec '13 to 776 in Jun '14, a reassuring trend concerning the I criteria.
|
|
|
Color Codes Explained :
Y - Better candidates highlighted by our
staff of experts.
G - Previously featured
in past reports as yellow but may no longer be buyable under the
guidelines.
***Last / Change / Volume data in this table is the closing quote data***
Symbol/Exchange
Company Name
Industry Group |
PRICE |
CHANGE
(%Change) |
Day High |
Volume
(% DAV)
(% 50 day avg vol) |
52 Wk Hi
% From Hi |
Featured
Date |
Price
Featured |
Pivot Featured |
|
Max Buy |
ACT
-
NYSE
Actavis plc
Medical-Generic Drugs
|
$234.84
|
+0.46
0.20% |
$235.80
|
1,609,459
76.06% of 50 DAV
50 DAV is 2,116,000
|
$239.15
-1.80%
|
6/20/2014
|
$216.53
|
PP = $230.87
|
|
MB = $242.41
|
Most Recent Note - 9/12/2014 11:57:54 AM
Y - Hitting a new 52-week high today with volume running at an above average pace. Gains above a stock's pivot point must be backed by a minimum of +40% above average volume to trigger a technical buy signal.
>>> FEATURED STOCK ARTICLE : Quietly Perched Within Striking Distance of 52-Week High - 8/28/2014
View all notes |
Set NEW NOTE alert |
CANSLIM.net Company Profile |
SEC
News |
Chart |
Request a new note
C
A N
S L
I M


|
AFSI
-
NASDAQ
Amtrust Financial Svcs
INSURANCE - Property and; Casualty Insurance
|
$41.49
|
-0.55
-1.31% |
$42.95
|
610,153
122.92% of 50 DAV
50 DAV is 496,400
|
$47.10
-11.91%
|
5/21/2014
|
$44.85
|
PP = $44.85
|
|
MB = $47.09
|
 Most Recent Note - 9/15/2014 7:28:49 PM
Churned higher volume and finished near the session low with a loss, a sign of more distributional pressure. Relative Strength Rating slumped to 71, below the 80+ minimum guideline for buy candidates. It will be dropped from the Featured Stocks list tonight.
>>> FEATURED STOCK ARTICLE : Distributional Action; Sub Par Relative Strength Remains Concern - 9/8/2014
View all notes |
Set NEW NOTE alert |
CANSLIM.net Company Profile |
SEC
News |
Chart |
Request a new note
C
A N
S L
I M
|
BITA
-
NYSE
Bitauto Hldgs Ltd Ads
Internet-Content
|
$81.60
|
-2.57
-3.05% |
$86.39
|
2,167,343
130.88% of 50 DAV
50 DAV is 1,656,000
|
$98.28
-16.97%
|
6/26/2014
|
$46.20
|
PP = $47.03
|
|
MB = $49.38
|
Most Recent Note - 9/15/2014 7:37:12 PM
G - Erased early gains and suffered another loss with above average volume. Recently enduring distributional pressure while fundamentals remain strong. Noted repeatedly with caution - "Has the look of a 'climax run' with volume-driven gains getting very extended from its prior base."
>>> FEATURED STOCK ARTICLE : Finished Near Session Low - Noted With Look of "Climax Run" - 8/27/2014
View all notes |
Set NEW NOTE alert |
CANSLIM.net Company Profile |
SEC
News |
Chart |
Request a new note
C
A N
S L
I M
|
EQM
-
NYSE
E Q T Midstream Partners
ENERGY - Oil and Gas Pipelines
|
$88.63
|
-2.17
-2.39% |
$90.34
|
215,696
125.40% of 50 DAV
50 DAV is 172,000
|
$102.51
-13.54%
|
12/12/2013
|
$53.17
|
PP = $56.51
|
|
MB = $59.34
|
Most Recent Note - 9/12/2014 6:05:53 PM
G - Violated its 50 DMA line raising concerns with a loss today on higher volume indicative of distributional pressure. Reported earnings +37% on +21% sales revenues for the Jun '14 quarter, an improvement after 2 sub par quarterly earnings comparisons.
>>> FEATURED STOCK ARTICLE : Forming New Base But Fundamental Flaws Remain a Concern - 9/3/2014
View all notes |
Set NEW NOTE alert |
CANSLIM.net Company Profile |
SEC
News |
Chart |
Request a new note
C
A N
S L
I M
|
FB
-
NASDAQ
Facebook Inc Cl A
INTERNET
|
$74.58
|
-2.90
-3.74% |
$77.25
|
49,545,591
136.59% of 50 DAV
50 DAV is 36,273,000
|
$78.36
-4.82%
|
9/9/2014
|
$76.67
|
PP = $76.84
|
|
MB = $80.68
|
Most Recent Note - 9/15/2014 3:31:32 PM
Y - Down considerably with heavy volume behind today's loss, action indicative of distributional pressure. Prior notes cautioned members "Recent gains lacked great volume conviction while gains above a stock's pivot point must have at least +40% above averages volume to trigger a proper new (or add-on) technical buy signal. See the latest FSU analysis for more details and annotated graphs. Prior highs in the $72 area define initial support along with its 50 DMA line."
>>> FEATURED STOCK ARTICLE : Wedging Gains Not Indicative of Institutional Conviction - 9/9/2014
View all notes |
Set NEW NOTE alert |
CANSLIM.net Company Profile |
SEC
News |
Chart |
Request a new note
C
A N
S L
I M
|
Symbol/Exchange
Company Name
Industry Group |
PRICE |
CHANGE
(%Change) |
Day High |
Volume
(% DAV)
(% 50 day avg vol) |
52 Wk Hi
% From Hi |
Featured
Date |
Price
Featured |
Pivot Featured |
|
Max Buy |
NXPI
-
NASDAQ
Nxp Semiconductors N V
ELECTRONICS - Semiconductor - Broad Line
|
$68.56
|
-1.42
-2.03% |
$70.58
|
2,854,740
88.60% of 50 DAV
50 DAV is 3,222,000
|
$73.09
-6.20%
|
8/29/2014
|
$68.50
|
PP = $67.89
|
|
MB = $71.28
|
Most Recent Note - 9/15/2014 7:32:57 PM
Y - Ended near the session low with today's 2nd consecutive loss on below average volume. Perched -6.2% off its 52-week high. It remains above its pivot point and below its "max buy" level. No overhead supply remains to act as resistance. Prior highs in the $67 area define initial support to watch on pullbacks.
>>> FEATURED STOCK ARTICLE : Gap Up For New High With Volume Triggered Technical Buy Signal - 8/29/2014
View all notes |
Set NEW NOTE alert |
CANSLIM.net Company Profile |
SEC
News |
Chart |
Request a new note
C
A N
S L
I M
|
PANW
-
NYSE
Palo Alto Networks
Computer Sftwr-Security
|
$97.47
|
-2.51
-2.51% |
$99.77
|
2,603,178
161.79% of 50 DAV
50 DAV is 1,609,000
|
$102.45
-4.86%
|
7/30/2014
|
$84.21
|
PP = $85.88
|
|
MB = $90.17
|
Most Recent Note - 9/15/2014 12:47:25 PM
G - Perched near its 52-week high following considerable volume-driven gains last week while getting extended from any sound base. No resistance remains due to overhead supply. Prior highs in the $87 area define initial support to watch above its 50 DMA line. Reported earnings +57% on +59% sales revenues for the Jul '14 quarter, continuing its strong earnings history satisfying the C criteria. Its Earnings Per Share (EPS) Rating is right at the 80+ minimum guideline for buy candidates.
>>> FEATURED STOCK ARTICLE : Pulling Back Following New Technical Breakout - 9/4/2014
View all notes |
Set NEW NOTE alert |
CANSLIM.net Company Profile |
SEC
News |
Chart |
Request a new note
C
A N
S L
I M
|
STRT
-
NASDAQ
Strattec Security Corp
AUTOMOTIVE - Auto Parts
|
$83.95
|
-1.31
-1.54% |
$85.60
|
20,701
98.58% of 50 DAV
50 DAV is 21,000
|
$89.87
-6.59%
|
8/22/2014
|
$71.47
|
PP = $73.97
|
|
MB = $77.67
|
Most Recent Note - 9/15/2014 7:34:25 PM
G - Perched -6.6% off its 52-week high, consolidating after getting extended from its prior base. Prior highs in the $74-77 area define initial support to watch on pullbacks.
>>> FEATURED STOCK ARTICLE : Extended From Prior Highs and Previously Noted Base - 9/10/2014
View all notes |
Set NEW NOTE alert |
CANSLIM.net Company Profile |
SEC
News |
Chart |
Request a new note
C
A N
S L
I M
|
TARO
-
NYSE
Taro Pharmaceutical Inds
DRUGS - Drug Manufacturers - Other
|
$151.34
|
-3.44
-2.22% |
$155.08
|
63,746
74.12% of 50 DAV
50 DAV is 86,000
|
$165.30
-8.45%
|
7/30/2014
|
$144.24
|
PP = $149.99
|
|
MB = $157.49
|
Most Recent Note - 9/15/2014 7:35:16 PM
G - Consolidating near its 50 DMA line and -8.4% off its 52-week high. Recently enduring distributional pressure and noted with caution - "Extended from any sound base. Recently reported earnings for the Jun '14 quarter below the +25% minimum earnings guideline (C criteria) raising fundamental concerns."
>>> FEATURED STOCK ARTICLE : Churning Action Indicative of Distributional Pressure - 9/2/2014
View all notes |
Set NEW NOTE alert |
CANSLIM.net Company Profile |
SEC
News |
Chart |
Request a new note
C
A N
S L
I M
|
TRN
-
NYSE
Trinity Industries Inc
TRANSPORTATION - Railroads
|
$46.72
|
-0.67
-1.41% |
$47.44
|
2,023,954
84.09% of 50 DAV
50 DAV is 2,407,000
|
$50.43
-7.36%
|
4/30/2014
|
$37.79
|
PP = $38.03
|
|
MB = $39.93
|
Most Recent Note - 9/12/2014 6:07:07 PM
G - Pulling back since a "negative reversal" at its 52-week high on 9/03/14. It has not formed a sound base. Prior highs near $46-47 define near-term support above its 50 DMA line. See the latest FSU analysis for more details and new annotated graphs.
>>> FEATURED STOCK ARTICLE : Consolidating Above 50-Day Moving Average Line - 9/12/2014
View all notes |
Set NEW NOTE alert |
CANSLIM.net Company Profile |
SEC
News |
Chart |
Request a new note
C
A N
S L
I M
|
Symbol/Exchange
Company Name
Industry Group |
PRICE |
CHANGE
(%Change) |
Day High |
Volume
(% DAV)
(% 50 day avg vol) |
52 Wk Hi
% From Hi |
Featured
Date |
Price
Featured |
Pivot Featured |
|
Max Buy |
UA
-
NYSE
Under Armour Inc Cl A
CONSUMER NON-DURABLES - Textile - Apparel Clothing
|
$67.19
|
-2.05
-2.96% |
$69.39
|
3,019,035
129.29% of 50 DAV
50 DAV is 2,335,000
|
$73.42
-8.49%
|
7/10/2014
|
$58.50
|
PP = $60.79
|
|
MB = $63.83
|
Most Recent Note - 9/15/2014 7:25:46 PM
G - Testing support at its 50 DMA line ($66.73) with higher volume behind today's 5th consecutive loss while retreating from its 52-week high. Fundamental concerns were raised by earnings reported +0% on +34% sales revenues for the Jun '14 quarter, below the +25% minimum earnings guideline (C criteria). See the latest FSU analysis for more details and new annotated graphs.
>>> FEATURED STOCK ARTICLE : Higher Volume Behind Loss Testing 50-Day Moving Average - 9/15/2014
View all notes |
Set NEW NOTE alert |
CANSLIM.net Company Profile |
SEC
News |
Chart |
Request a new note
C
A N
S L
I M
|
WLK
-
NYSE
Westlake Chemical Corp
CHEMICALS - Specialty Chemicals
|
$93.36
|
+0.13
0.14% |
$93.36
|
373,531
73.97% of 50 DAV
50 DAV is 505,000
|
$98.44
-5.16%
|
4/29/2014
|
$72.79
|
PP = $69.31
|
|
MB = $72.78
|
Most Recent Note - 9/11/2014 6:28:28 PM
G - Consolidating above prior highs in the $92 area defining support above its 50 DMA line. Subsequent violations would raise greater concerns and trigger technical sell signals. Technical strength has continued despite recent fundamental concerns. See the latest FSU analysis for more details and new annotated graphs.
>>> FEATURED STOCK ARTICLE : Consolidating Above Near-Term Support Levels - 9/11/2014
View all notes |
Set NEW NOTE alert |
CANSLIM.net Company Profile |
SEC
News |
Chart |
Request a new note
C
A N
S L
I M
|
YY
-
NASDAQ
YY Inc Ads
INTERNET - Internet Service Providers
|
$80.74
|
-7.83
-8.84% |
$89.00
|
3,067,321
209.23% of 50 DAV
50 DAV is 1,466,000
|
$96.39
-16.24%
|
8/19/2014
|
$85.81
|
PP = $91.03
|
|
MB = $95.58
|
Most Recent Note - 9/15/2014 3:29:31 PM
G - Slumping below its 50 DMA line and raising concerns with above average volume behind today's 5th consecutive loss. Disciplined investors always limit losses by selling any stock that falls more than -7% from their purchase price.
>>> FEATURED STOCK ARTICLE : Perched at High After Triggering Technical Buy Signal - 9/5/2014
View all notes |
Set NEW NOTE alert |
CANSLIM.net Company Profile |
SEC
News |
Chart |
Request a new note
C
A N
S L
I M
|
|
|
|
THESE ARE NOT BUY RECOMMENDATIONS!
Comments contained in the body of this report are technical
opinions only. The material herein has been obtained
from sources believed to be reliable and accurate, however,
its accuracy and completeness cannot be guaranteed.
This site is not an investment advisor, hence it does
not endorse or recommend any securities or other investments.
Any recommendation contained in this report may not
be suitable for all investors and it is not to be deemed
an offer or solicitation on our part with respect to
the purchase or sale of any securities. All trademarks,
service marks and trade names appearing in this report
are the property of their respective owners, and are
likewise used for identification purposes only.
This report is a service available
only to active Paid Premium Members.
You may opt-out of receiving report notifications
at any time. Questions or comments may be submitted
by writing to Premium Membership Services 665 S.E. 10 Street, Suite 201 Deerfield Beach, FL 33441-5634 or by calling 1-800-965-8307
or 954-785-1121.
|
|
|