You are not logged in.
This means you
CAN ONLY VIEW reports that were published prior to Friday, March 7, 2025.
You
MUST UPGRADE YOUR MEMBERSHIP if you want to see any current reports.
AFTER MARKET UPDATE - FRIDAY, SEPTEMBER 12TH, 2014
Previous After Market Report Next After Market Report >>>
|
|
|
|
DOW |
-61.49 |
16,987.51 |
-0.36% |
|
Volume |
678,167,180 |
+15% |
|
Volume |
1,624,196,380 |
+3% |
|
NASDAQ |
-24.21 |
4,567.60 |
-0.53% |
|
Advancers |
643 |
20% |
|
Advancers |
893 |
30% |
|
S&P 500 |
-11.91 |
1,985.54 |
-0.60% |
|
Decliners |
2,472 |
77% |
|
Decliners |
1,938 |
66% |
|
Russell 2000 |
-11.74 |
1,160.61 |
-1.00% |
|
52 Wk Highs |
41 |
|
|
52 Wk Highs |
60 |
|
|
S&P 600 |
-6.84 |
664.56 |
-1.02% |
|
52 Wk Lows |
62 |
|
|
52 Wk Lows |
43 |
|
|
 |
Major Averages Pulled Back Breaking Weekly Winning Streak
Kenneth J. Gruneisen - Passed the CAN SLIM® Master's Exam
With Friday's decline, the major averages snapped their five week winning streak. For the week, the Dow lost -0.9%, the S&P 500 fell -1.1% and the NASDAQ was down -0.3%. Volume totals were reported lighter than the prior session total on the NYSE and on the Nasdaq exchange. Breadth was negative as decliners led advancers by a 4-1 margin on the NYSE and by 2-1 on the NASDAQ exchange. There were 29 high-ranked companies from the CANSLIM.net Leaders List that made new 52-week highs and appeared on the CANSLIM.net BreakOuts Page, down a notch from the prior session total of 30 stocks. New 52-week highs outnumbered new 52-week lows on the Nasdaq exchange while new lows outnumbered new highs on the NYSE. There were gains for only 2 of the 13 high-ranked companies currently included on the Featured Stocks Page. The broader market (M criteria) has encountered distributional pressure while leadership (stocks hitting new 52-week highs) has waned. Remember that disciplined investors buy stocks with superior fundamentals only after they have triggered a proper technical buy signal.
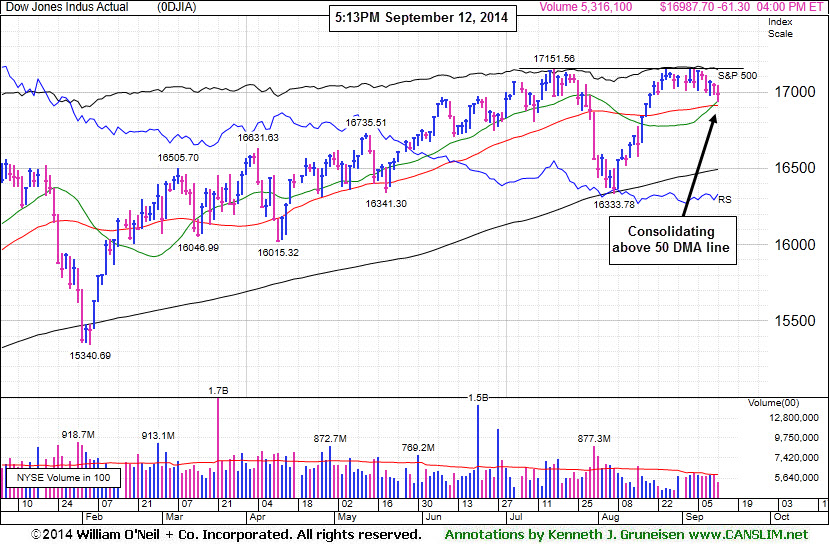
PICTURED: The Dow Jones Industrial Average is consolidating above its 50-day moving average (DMA) line.
Stocks finished lower on Friday. The Dow fell 61 points to 16987. The S&P 500 lost 12 points to 1,985. The NASDAQ Composite dropped 24 points to 4,567.
The major averages declined as encouraging consumer reports added to speculation the Fed may raise interest rates sooner than projected. Before the open, retail sales rose +0.6% in August. A separate release revealed sentiment improved more than expected this month.
Energy stocks also weighed on market action as crude oil extended its weekly retreat. Shares of Exxon (XOM -1.3%) contributed the most to the sector's decline. Utilities and telecom also underperformed on the session as NextEra Energy (NEE -2.1%) and Verizon (VZ -1.2%) were lower. Ulta Salon (ULTA +17.9%) was a notable gainer, rallying as the beauty supply retailer's earnings topped consensus estimates. Alliance Data Systems (ADS +2%) rose after announcing it would buy internet advertiser Conversant (CNVR +30.29%) for $2.3 billion.
Treasuries fell amid the speculation over Fed tightening. Benchmark 10-year notes declined 16/32 to yield 2.61%. In commodity trading, WTI crude oil slid -0.6% to $92.24/bbl on the NYMEX. COMEX gold was down -0.7% to $1,229.80/oz.
The CANSLIM.net Featured Stocks Page shows the most action-worthy candidates and their latest notes and a Headline Link directs members to the latest detailed analysis with data-packed graphs annotated by a Certified expert along with links to additional resources. The Premium Member Homepage includes "dynamic archives" to all prior pay reports published.
|
 Kenneth J. Gruneisen started out as a licensed stockbroker in August 1987, a couple of months prior to the historic stock market crash that took the Dow Jones Industrial Average down -22.6% in a single day. He has published daily fact-based fundamental and technical analysis on high-ranked stocks online for two decades. Through FACTBASEDINVESTING.COM, Kenneth provides educational articles, news, market commentary, and other information regarding proven investment systems that work in good times and bad.
Comments contained in the body of this report are technical opinions only and are not necessarily those of Gruneisen Growth Corp. The material herein has been obtained from sources believed to be reliable and accurate, however, its accuracy and completeness cannot be guaranteed. Our firm, employees, and customers may effect transactions, including transactions contrary to any recommendation herein, or have positions in the securities mentioned herein or options with respect thereto. Any recommendation contained in this report may not be suitable for all investors and it is not to be deemed an offer or solicitation on our part with respect to the purchase or sale of any securities. |
|
 |
Financial, Tech and Commodity-Linked Groups Fell
Kenneth J. Gruneisen - Passed the CAN SLIM® Master's Exam
On Friday the Bank ($BKX +0.64%) and the Broker/Dealer ($XBD +0.57%) indexes posted modest gains which were a positive influence on the major averages. The tech sector saw unanimous losses from the Semiconductor ($SOX -1.27%), Networking ($NWX -1.17%), and Biotech ($BTK -1.01%). Commodity-linked groups had a negative bias as the Oil Services ($OSX -2.02%), Integrated Oil ($XOI -1.41%), and the Gold & Silver ($XAU -1.44%) indexes each lost ground.
Charts courtesy www.stockcharts.com
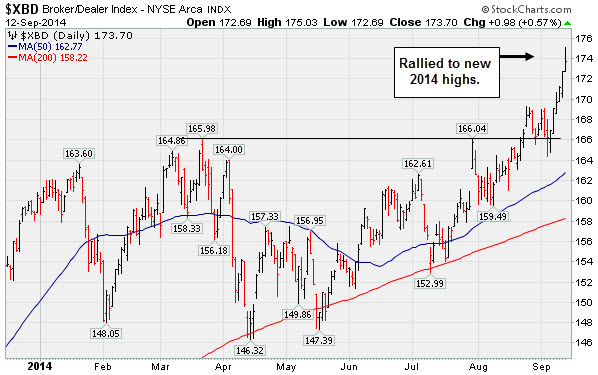
PICTURED: The Broker/Dealer ($XBD +0.57%) posted a gain on Friday extending its winning streak to 6 consecutive gains into new high territory.
| Oil Services |
$OSX |
280.32 |
-5.78 |
-2.02% |
-0.25% |
| Integrated Oil |
$XOI |
1,602.09 |
-22.89 |
-1.41% |
+6.58% |
| Semiconductor |
$SOX |
639.89 |
-8.25 |
-1.27% |
+19.60% |
| Networking |
$NWX |
338.88 |
-4.02 |
-1.17% |
+4.61% |
| Broker/Dealer |
$XBD |
173.70 |
+0.98 |
+0.57% |
+8.19% |
| Retail |
$RLX |
940.96 |
-1.28 |
-0.14% |
+0.12% |
| Gold & Silver |
$XAU |
91.66 |
-1.34 |
-1.44% |
+8.92% |
| Bank |
$BKX |
72.65 |
+0.46 |
+0.64% |
+4.89% |
| Biotech |
$BTK |
3,081.70 |
-31.49 |
-1.01% |
+32.24% |
|
|
|
 |
Consolidating Above 50-Day Moving Average Line
Kenneth J. Gruneisen - Passed the CAN SLIM® Master's Exam
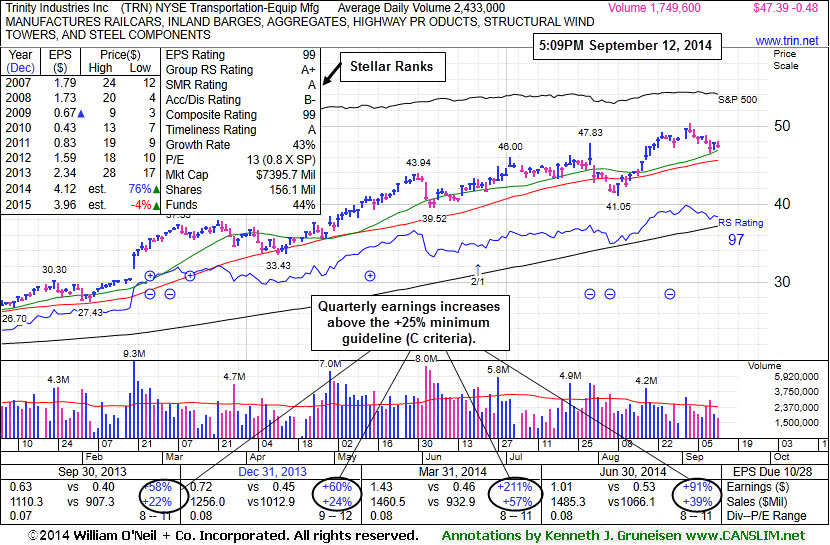
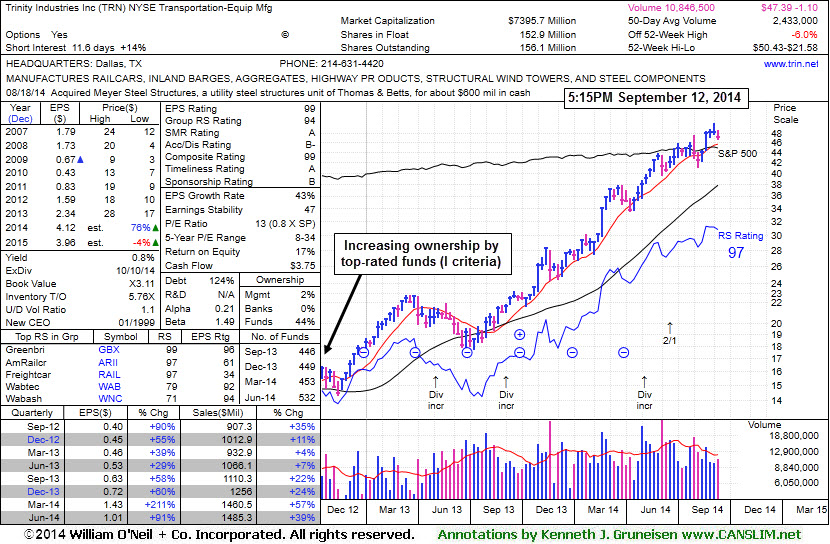
Trinity Industries Inc (TRN -$0.48 or -1.0% to $47.39) has been pulling back since a "negative reversal" at its 52-week high on 9/03/14. It has not formed a sound base. Prior highs near $46-47 define near-term support above its 50-day moving average (DMA) line. Subsequent deterioration below that important short-term average would raise concerns and trigger technical sell signals.
The high-ranked Transportation - Equipment Manufacturing firm was last shown in this FSU section on 8/25/14 with annotated graphs under the headline, "Rallying Into New High Territory Without Forming New Base". It reported earnings +91% on +39% sales revenues for the Jun '14 quarter, continuing its streak of strong quarterly earnings increases above the +25% minimum earnings guideline (C criteria). Annual earnings (A criteria) have improved following a downturn in FY '08-10.
TRN traded up as much as +33.4% since first highlighted in yellow in the 4/30/14 mid-day report report (read here). Disciplined investors avoid chasing stocks extended more than +5% above prior highs and they always limit losses by selling any stock that falls more than -7% from their purchase price.
The number of top-rated funds owning its shares rose from 455 in Sep '13 to 532 in Jun '14, a reassuring sign concerning the I criteria. Its supply of shares outstanding (S criteria) was doubled as a 2:1 split was effective as of 6/20/14.
|
|
|
Color Codes Explained :
Y - Better candidates highlighted by our
staff of experts.
G - Previously featured
in past reports as yellow but may no longer be buyable under the
guidelines.
***Last / Change / Volume data in this table is the closing quote data***
Symbol/Exchange
Company Name
Industry Group |
PRICE |
CHANGE
(%Change) |
Day High |
Volume
(% DAV)
(% 50 day avg vol) |
52 Wk Hi
% From Hi |
Featured
Date |
Price
Featured |
Pivot Featured |
|
Max Buy |
ACT
-
NYSE
Actavis plc
Medical-Generic Drugs
|
$234.38
|
+1.64
0.70% |
$239.15
|
2,611,032
122.81% of 50 DAV
50 DAV is 2,126,000
|
$234.00
0.16%
|
6/20/2014
|
$216.53
|
PP = $230.87
|
|
MB = $242.41
|
 Most Recent Note - 9/12/2014 11:57:54 AM
Y - Hitting a new 52-week high today with volume running at an above average pace. Gains above a stock's pivot point must be backed by a minimum of +40% above average volume to trigger a technical buy signal.
>>> FEATURED STOCK ARTICLE : Quietly Perched Within Striking Distance of 52-Week High - 8/28/2014
View all notes |
Set NEW NOTE alert |
CANSLIM.net Company Profile |
SEC
News |
Chart |
Request a new note
C
A N
S L
I M


|
AFSI
-
NASDAQ
Amtrust Financial Svcs
INSURANCE - Property and; Casualty Insurance
|
$42.04
|
-0.19
-0.45% |
$42.35
|
280,605
114.53% of 50 DAV
50 DAV is 245,000
|
$47.10
-10.74%
|
5/21/2014
|
$44.85
|
PP = $44.85
|
|
MB = $47.09
|
Most Recent Note - 9/8/2014 6:24:37 PM
G - Churned above average volume without making price progress recently, a sign of distributional pressure. Relative Strength Rating is currently 72, below the 80+ minimum guideline for buy candidates. See the latest FSU analysis for more details and new annotated graphs.
>>> FEATURED STOCK ARTICLE : Distributional Action; Sub Par Relative Strength Remains Concern - 9/8/2014
View all notes |
Set NEW NOTE alert |
CANSLIM.net Company Profile |
SEC
News |
Chart |
Request a new note
C
A N
S L
I M
|
BITA
-
NYSE
Bitauto Hldgs Ltd Ads
Internet-Content
|
$84.17
|
+1.74
2.11% |
$85.75
|
2,232,566
137.39% of 50 DAV
50 DAV is 1,625,000
|
$98.28
-14.36%
|
6/26/2014
|
$46.20
|
PP = $47.03
|
|
MB = $49.38
|
Most Recent Note - 9/11/2014 6:26:45 PM
G - Finished near the session high today but suffered another loss with heavy volume, enduring distributional pressure. Fundamentals remain strong. Noted repeatedly with caution - "Has the look of a 'climax run' with volume-driven gains getting very extended from its prior base."
>>> FEATURED STOCK ARTICLE : Finished Near Session Low - Noted With Look of "Climax Run" - 8/27/2014
View all notes |
Set NEW NOTE alert |
CANSLIM.net Company Profile |
SEC
News |
Chart |
Request a new note
C
A N
S L
I M
|
EQM
-
NYSE
E Q T Midstream Partners
ENERGY - Oil and Gas Pipelines
|
$90.80
|
-3.59
-3.80% |
$94.65
|
225,598
132.70% of 50 DAV
50 DAV is 170,000
|
$102.51
-11.42%
|
12/12/2013
|
$53.17
|
PP = $56.51
|
|
MB = $59.34
|
Most Recent Note - 9/12/2014 6:05:53 PM
G - Violated its 50 DMA line raising concerns with a loss today on higher volume indicative of distributional pressure. Reported earnings +37% on +21% sales revenues for the Jun '14 quarter, an improvement after 2 sub par quarterly earnings comparisons.
>>> FEATURED STOCK ARTICLE : Forming New Base But Fundamental Flaws Remain a Concern - 9/3/2014
View all notes |
Set NEW NOTE alert |
CANSLIM.net Company Profile |
SEC
News |
Chart |
Request a new note
C
A N
S L
I M
|
FB
-
NASDAQ
Facebook Inc Cl A
INTERNET
|
$77.48
|
-0.44
-0.56% |
$78.30
|
26,655,668
72.88% of 50 DAV
50 DAV is 36,576,000
|
$78.36
-1.12%
|
9/9/2014
|
$76.67
|
PP = $76.84
|
|
MB = $80.68
|
Most Recent Note - 9/10/2014 4:49:18 PM
Y - Posted a small gain today on light volume. Color code was changed to yellow with new pivot point cited based on its 7/24/14 high plus 10 cents. Recent gains lacked great volume conviction while gains above a stock's pivot point must have at least +40% above averages volume to trigger a proper new (or add-on) technical buy signal. See the latest FSU analysis for more details and annotated graphs. Prior highs in the $72 area define initial support along with its 50 DMA line.
>>> FEATURED STOCK ARTICLE : Wedging Gains Not Indicative of Institutional Conviction - 9/9/2014
View all notes |
Set NEW NOTE alert |
CANSLIM.net Company Profile |
SEC
News |
Chart |
Request a new note
C
A N
S L
I M
|
Symbol/Exchange
Company Name
Industry Group |
PRICE |
CHANGE
(%Change) |
Day High |
Volume
(% DAV)
(% 50 day avg vol) |
52 Wk Hi
% From Hi |
Featured
Date |
Price
Featured |
Pivot Featured |
|
Max Buy |
NXPI
-
NASDAQ
Nxp Semiconductors N V
ELECTRONICS - Semiconductor - Broad Line
|
$69.98
|
-1.36
-1.91% |
$71.50
|
2,335,109
72.61% of 50 DAV
50 DAV is 3,216,000
|
$73.09
-4.26%
|
8/29/2014
|
$68.50
|
PP = $67.89
|
|
MB = $71.28
|
Most Recent Note - 9/9/2014 12:17:26 PM
Y - Pulling back today following a streak of 8 consecutive gains for new 52-week highs. It remains below its "max buy" level. No overhead supply remains to act as resistance. Prior highs in the $67 area define initial support to watch on pullbacks.
>>> FEATURED STOCK ARTICLE : Gap Up For New High With Volume Triggered Technical Buy Signal - 8/29/2014
View all notes |
Set NEW NOTE alert |
CANSLIM.net Company Profile |
SEC
News |
Chart |
Request a new note
C
A N
S L
I M
|
PANW
-
NYSE
Palo Alto Networks
Computer Sftwr-Security
|
$99.98
|
-0.51
-0.51% |
$100.85
|
2,583,161
162.77% of 50 DAV
50 DAV is 1,587,000
|
$102.45
-2.41%
|
7/30/2014
|
$84.21
|
PP = $85.88
|
|
MB = $90.17
|
Most Recent Note - 9/11/2014 12:27:44 PM
G - Hitting another new 52-week high today with heavy volume behind gains while getting extended from any sound base. No resistance remains due to overhead supply. Prior highs in the $87 area define initial support to watch above its 50 DMA line. Reported earnings +43% on +59% sales revenues for the Jul '14 quarter, continuing its strong earnings history satisfying the C criteria, however its Earnings Per Share (EPS) Rating has slumped below the 80+ minimum guideline for buy candidates.
>>> FEATURED STOCK ARTICLE : Pulling Back Following New Technical Breakout - 9/4/2014
View all notes |
Set NEW NOTE alert |
CANSLIM.net Company Profile |
SEC
News |
Chart |
Request a new note
C
A N
S L
I M
|
STRT
-
NASDAQ
Strattec Security Corp
AUTOMOTIVE - Auto Parts
|
$85.26
|
-1.61
-1.85% |
$87.47
|
39,296
187.12% of 50 DAV
50 DAV is 21,000
|
$89.87
-5.13%
|
8/22/2014
|
$71.47
|
PP = $73.97
|
|
MB = $77.67
|
Most Recent Note - 9/10/2014 4:40:39 PM
G - Perched at its 52-week high, extended from its prior base. Prior highs in the $74-77 area define initial support to watch on pullbacks. See the latest FSU analysis for more details and new annotated graphs.
>>> FEATURED STOCK ARTICLE : Extended From Prior Highs and Previously Noted Base - 9/10/2014
View all notes |
Set NEW NOTE alert |
CANSLIM.net Company Profile |
SEC
News |
Chart |
Request a new note
C
A N
S L
I M
|
TARO
-
NYSE
Taro Pharmaceutical Inds
DRUGS - Drug Manufacturers - Other
|
$154.78
|
-1.71
-1.09% |
$156.52
|
98,842
114.93% of 50 DAV
50 DAV is 86,000
|
$165.30
-6.36%
|
7/30/2014
|
$144.24
|
PP = $149.99
|
|
MB = $157.49
|
Most Recent Note - 9/10/2014 12:56:21 PM
G - Consolidating above its 50 DMA line and only -5.1% off its 52-week high. Recently enduring distributional pressure and noted with caution - "Extended from any sound base. Recently reported earnings for the Jun '14 quarter below the +25% minimum earnings guideline (C criteria) raising fundamental concerns."
>>> FEATURED STOCK ARTICLE : Churning Action Indicative of Distributional Pressure - 9/2/2014
View all notes |
Set NEW NOTE alert |
CANSLIM.net Company Profile |
SEC
News |
Chart |
Request a new note
C
A N
S L
I M
|
TRN
-
NYSE
Trinity Industries Inc
TRANSPORTATION - Railroads
|
$47.39
|
-0.48
-1.00% |
$48.12
|
1,749,699
71.92% of 50 DAV
50 DAV is 2,433,000
|
$50.43
-6.03%
|
4/30/2014
|
$37.79
|
PP = $38.03
|
|
MB = $39.93
|
Most Recent Note - 9/12/2014 6:07:07 PM
G - Pulling back since a "negative reversal" at its 52-week high on 9/03/14. It has not formed a sound base. Prior highs near $46-47 define near-term support above its 50 DMA line. See the latest FSU analysis for more details and new annotated graphs.
>>> FEATURED STOCK ARTICLE : Consolidating Above 50-Day Moving Average Line - 9/12/2014
View all notes |
Set NEW NOTE alert |
CANSLIM.net Company Profile |
SEC
News |
Chart |
Request a new note
C
A N
S L
I M
|
Symbol/Exchange
Company Name
Industry Group |
PRICE |
CHANGE
(%Change) |
Day High |
Volume
(% DAV)
(% 50 day avg vol) |
52 Wk Hi
% From Hi |
Featured
Date |
Price
Featured |
Pivot Featured |
|
Max Buy |
UA
-
NYSE
Under Armour Inc Cl A
CONSUMER NON-DURABLES - Textile - Apparel Clothing
|
$69.24
|
-0.68
-0.97% |
$70.41
|
1,801,787
77.16% of 50 DAV
50 DAV is 2,335,000
|
$73.42
-5.69%
|
7/10/2014
|
$58.50
|
PP = $60.79
|
|
MB = $63.83
|
Most Recent Note - 9/9/2014 7:08:21 PM
G - Finished near the session low today with a loss on higher volume indicative of distributional pressure. No resistance remains due to overhead supply. Fundamental concerns were raised by earnings reported +0% on +34% sales revenues for the Jun '14 quarter, below the +25% minimum earnings guideline (C criteria), yet the company raised its guidance.
>>> FEATURED STOCK ARTICLE : Holding Ground Near All-Time Highs Despite Fundamental Concerns - 8/26/2014
View all notes |
Set NEW NOTE alert |
CANSLIM.net Company Profile |
SEC
News |
Chart |
Request a new note
C
A N
S L
I M
|
WLK
-
NYSE
Westlake Chemical Corp
CHEMICALS - Specialty Chemicals
|
$93.23
|
-1.62
-1.71% |
$94.82
|
410,680
80.84% of 50 DAV
50 DAV is 508,000
|
$98.44
-5.29%
|
4/29/2014
|
$72.79
|
PP = $69.31
|
|
MB = $72.78
|
Most Recent Note - 9/11/2014 6:28:28 PM
G - Consolidating above prior highs in the $92 area defining support above its 50 DMA line. Subsequent violations would raise greater concerns and trigger technical sell signals. Technical strength has continued despite recent fundamental concerns. See the latest FSU analysis for more details and new annotated graphs.
>>> FEATURED STOCK ARTICLE : Consolidating Above Near-Term Support Levels - 9/11/2014
View all notes |
Set NEW NOTE alert |
CANSLIM.net Company Profile |
SEC
News |
Chart |
Request a new note
C
A N
S L
I M
|
YY
-
NASDAQ
YY Inc Ads
INTERNET - Internet Service Providers
|
$88.57
|
-1.42
-1.58% |
$91.20
|
1,267,896
86.60% of 50 DAV
50 DAV is 1,464,000
|
$96.39
-8.11%
|
8/19/2014
|
$85.81
|
PP = $91.03
|
|
MB = $95.58
|
Most Recent Note - 9/8/2014 6:27:29 PM
G - Hit another new 52-week high with today's volume-driven gain and rallied beyond its "max buy" level. Getting extended from its prior base, its color code is changed to green. Prior highs near $90 define near-term support to watch on pullbacks.
>>> FEATURED STOCK ARTICLE : Perched at High After Triggering Technical Buy Signal - 9/5/2014
View all notes |
Set NEW NOTE alert |
CANSLIM.net Company Profile |
SEC
News |
Chart |
Request a new note
C
A N
S L
I M
|
|
|
|
THESE ARE NOT BUY RECOMMENDATIONS!
Comments contained in the body of this report are technical
opinions only. The material herein has been obtained
from sources believed to be reliable and accurate, however,
its accuracy and completeness cannot be guaranteed.
This site is not an investment advisor, hence it does
not endorse or recommend any securities or other investments.
Any recommendation contained in this report may not
be suitable for all investors and it is not to be deemed
an offer or solicitation on our part with respect to
the purchase or sale of any securities. All trademarks,
service marks and trade names appearing in this report
are the property of their respective owners, and are
likewise used for identification purposes only.
This report is a service available
only to active Paid Premium Members.
You may opt-out of receiving report notifications
at any time. Questions or comments may be submitted
by writing to Premium Membership Services 665 S.E. 10 Street, Suite 201 Deerfield Beach, FL 33441-5634 or by calling 1-800-965-8307
or 954-785-1121.
|
|
|

