***Last / Change / Volume data in this table is the closing quote data***
Symbol/Exchange
Company Name
Industry Group |
PRICE |
CHANGE
(%Change) |
Day High |
Volume
(% DAV)
(% 50 day avg vol) |
52 Wk Hi
% From Hi |
Featured
Date |
Price
Featured |
Pivot Featured |
|
Max Buy |
ABV
-
NYSE
Comp De Bebidas Adr
FOOD and BEVERAGE - Beverages - Brewers
|
$120.15
|
+1.20
1.01% |
$120.31
|
485,459
78.45% of 50 DAV
50 DAV is 618,800
|
$119.52
0.53%
|
6/29/2010
|
$104.74
|
PP = $109.33
|
|
MB = $114.80
|
Most Recent Note - 9/14/2010 2:29:44 PM
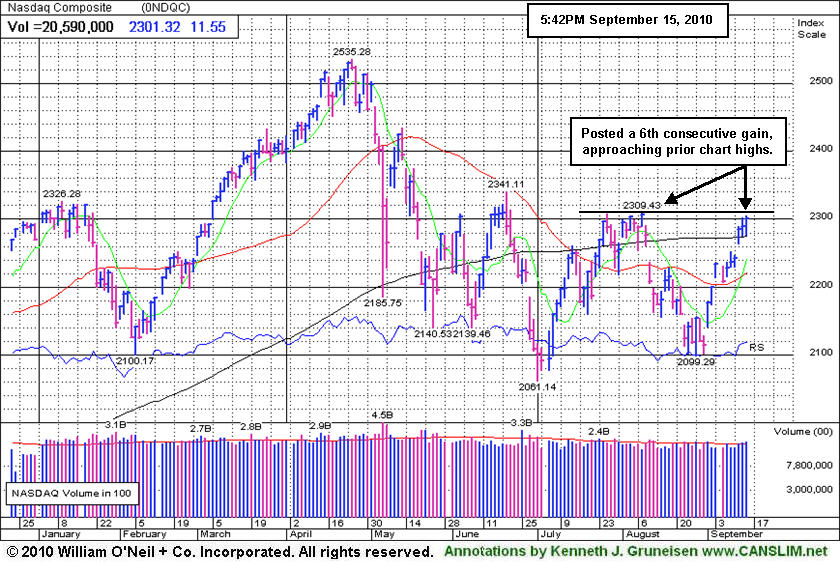
G - This Brazil-based beverage firm has rallied to another new all-time high today with its 6th consecutive gain on near average or light volume. Prior highs in the $111-112 area define support above its 50 DMA line.
>>> The latest Featured Stock Update with an annotated graph appeared on 8/18/2010. Click here.
View all notes |
Alert me of new notes |
CANSLIM.net Company Profile |
SEC |
Zacks Reports |
StockTalk |
News |
Chart |
Request a new note
C
A N
S L
I M


|
ARUN
-
NASDAQ
Aruba Networks Inc
COMPUTER HARDWARE - Networking andamp; Communication Dev
|
$20.47
|
+0.47
2.35% |
$20.69
|
2,476,068
133.81% of 50 DAV
50 DAV is 1,850,400
|
$20.49
-0.10%
|
8/30/2010
|
$18.12
|
PP = $18.51
|
|
MB = $19.44
|
 Most Recent Note - 9/15/2010 5:13:04 PM
G - Hit yet another new 52-week high today with above average volume behind its gain. Extended from its latest base, its prior highs near $18 define a chart support level to watch.
>>> The latest Featured Stock Update with an annotated graph appeared on 9/2/2010. Click here.
View all notes |
Alert me of new notes |
CANSLIM.net Company Profile |
SEC |
Zacks Reports |
StockTalk |
News |
Chart |
Request a new note
C
A N
S L
I M
|
BIDU
-
NASDAQ
Baidu Inc Ads
INTERNET - Internet Information Providers
|
$86.30
|
-0.03
-0.03% |
$86.86
|
4,928,496
50.74% of 50 DAV
50 DAV is 9,712,300
|
$88.32
-2.29%
|
7/14/2010
|
$75.03
|
PP = $78.59
|
|
MB = $82.52
|
Most Recent Note - 9/13/2010 5:20:05 PM
Y - Gapped up today for a gain with near average volume. Its recent rally from its 10-week average may be considered a secondary buy point. However, it may be considered "late-stage" and riskier than fresh technical breakouts.
>>> The latest Featured Stock Update with an annotated graph appeared on 8/13/2010. Click here.
View all notes |
Alert me of new notes |
CANSLIM.net Company Profile |
SEC |
Zacks Reports |
StockTalk |
News |
Chart |
Request a new note
C
A N
S L
I M
|
CACC
-
NASDAQ
Credit Acceptance Corp
FINANCIAL SERVICES - Credit Services
|
$63.39
|
+2.90
4.79% |
$63.45
|
70,807
149.07% of 50 DAV
50 DAV is 47,500
|
$61.41
3.22%
|
7/29/2010
|
$52.04
|
PP = $54.07
|
|
MB = $56.77
|
Most Recent Note - 9/15/2010 12:45:22 PM
G - Considerable gain today for a new 52-week high with volume running at an above average pace. It has rallied from a short (4-week) flat base, however the minimum length for a valid flat base is 5 weeks, so its $61.41 high of 8/18/10 was not cited as the basis for a new pivot point.
>>> The latest Featured Stock Update with an annotated graph appeared on 8/2/2010. Click here.
View all notes |
Alert me of new notes |
CANSLIM.net Company Profile |
SEC |
Zacks Reports |
StockTalk |
News |
Chart |
Request a new note
C
A N
S L
I M
|
CMG
-
NYSE
Chipotle Mexican Grill
LEISURE - Restaurants
|
$169.66
|
+1.14
0.68% |
$169.80
|
471,477
66.89% of 50 DAV
50 DAV is 704,900
|
$170.00
-0.20%
|
9/1/2010
|
$158.31
|
PP = $155.52
|
|
MB = $163.30
|
Most Recent Note - 9/15/2010 5:35:21 PM
G - Posted a 4th consecutive gain today with below average volume, getting more extended from prior chart highs.
>>> The latest Featured Stock Update with an annotated graph appeared on 9/1/2010. Click here.
View all notes |
Alert me of new notes |
CANSLIM.net Company Profile |
SEC |
Zacks Reports |
StockTalk |
News |
Chart |
Request a new note
C
A N
S L
I M
|
Symbol/Exchange
Company Name
Industry Group |
PRICE |
CHANGE
(%Change) |
Day High |
Volume
(% DAV)
(% 50 day avg vol) |
52 Wk Hi
% From Hi |
Featured
Date |
Price
Featured |
Pivot Featured |
|
Max Buy |
CRM
-
NYSE
Salesforce.Com Inc
INTERNET - Internet Software and Services
|
$116.81
|
-0.97
-0.82% |
$117.75
|
2,323,615
89.79% of 50 DAV
50 DAV is 2,587,700
|
$122.00
-4.25%
|
6/2/2010
|
$88.44
|
PP = $89.60
|
|
MB = $94.08
|
Most Recent Note - 9/15/2010 5:36:39 PM
G - Hovering near its all-time high, extended from a sound base, not currently buyable under the investment system guidelines.
>>> The latest Featured Stock Update with an annotated graph appeared on 8/16/2010. Click here.
View all notes |
Alert me of new notes |
CANSLIM.net Company Profile |
SEC |
Zacks Reports |
StockTalk |
News |
Chart |
Request a new note
C
A N
S L
I M
|
EGO
-
NYSE
Eldorado Gold Corp
METALS and MINING - Gold
|
$19.84
|
-0.01
-0.05% |
$20.23
|
5,280,574
132.16% of 50 DAV
50 DAV is 3,995,600
|
$20.15
-1.54%
|
8/19/2010
|
$18.25
|
PP = $19.17
|
|
MB = $20.13
|
Most Recent Note - 9/15/2010 12:58:44 PM
Y - Hit a new 52-week high today, approaching its "max buy" level. Gapped up 9/14/10 for a solid gain with above average volume, reconfirming prior buy signals amid widespread strength and leadership in the group.
>>> The latest Featured Stock Update with an annotated graph appeared on 8/19/2010. Click here.
View all notes |
Alert me of new notes |
CANSLIM.net Company Profile |
SEC |
Zacks Reports |
StockTalk |
News |
Chart |
Request a new note
C
A N
S L
I M
|
FFIV
-
NASDAQ
F 5 Networks Inc
INTERNET - Internet Software and Services
|
$99.14
|
+0.48
0.49% |
$99.73
|
1,324,081
79.32% of 50 DAV
50 DAV is 1,669,200
|
$100.17
-1.03%
|
6/16/2010
|
$74.50
|
PP = $74.10
|
|
MB = $77.81
|
Most Recent Note - 9/13/2010 3:47:38 PM
G - Considerable gain after gapping up today, hitting a new all-time high. Upward trendline connecting July-August lows defines an initial chart support level well above its 50 DMA line.
>>> The latest Featured Stock Update with an annotated graph appeared on 9/13/2010. Click here.
View all notes |
Alert me of new notes |
CANSLIM.net Company Profile |
SEC |
Zacks Reports |
StockTalk |
News |
Chart |
Request a new note
C
A N
S L
I M
|
FOSL
-
NASDAQ
Fossil Inc
CONSUMER DURABLES - Recreational Goods, Other
|
$51.83
|
+0.34
0.66% |
$51.99
|
415,468
55.03% of 50 DAV
50 DAV is 755,000
|
$51.95
-0.23%
|
8/10/2010
|
$45.54
|
PP = $42.69
|
|
MB = $44.82
|
Most Recent Note - 9/14/2010 3:57:02 PM
G - Gain today with average volume for another new all-time high. Extended from any sound base after a recent streak of gains, its prior high in the $46 area defines support to watch.
>>> The latest Featured Stock Update with an annotated graph appeared on 8/11/2010. Click here.
View all notes |
Alert me of new notes |
CANSLIM.net Company Profile |
SEC |
Zacks Reports |
StockTalk |
News |
Chart |
Request a new note
C
A N
S L
I M
|
GMCR
-
NASDAQ
Green Mtn Coffee Roastrs
FOOD and BEVERAGE - Processed and Packaged Goods
|
$35.57
|
+0.98
2.83% |
$35.94
|
2,557,018
108.50% of 50 DAV
50 DAV is 2,356,700
|
$35.94
-1.03%
|
8/17/2010
|
$33.62
|
PP = $33.30
|
|
MB = $34.97
|
Most Recent Note - 9/15/2010 11:35:59 AM
G - At its 52-week high after brief trading under its "max buy" level on the prior session and earlier today. Prior highs in the $33 area define support to watch.
>>> The latest Featured Stock Update with an annotated graph appeared on 8/17/2010. Click here.
View all notes |
Alert me of new notes |
CANSLIM.net Company Profile |
SEC |
Zacks Reports |
StockTalk |
News |
Chart |
Request a new note
C
A N
S L
I M
|
Symbol/Exchange
Company Name
Industry Group |
PRICE |
CHANGE
(%Change) |
Day High |
Volume
(% DAV)
(% 50 day avg vol) |
52 Wk Hi
% From Hi |
Featured
Date |
Price
Featured |
Pivot Featured |
|
Max Buy |
HS
-
NYSE
Healthspring Inc
HEALTH SERVICES - Health Care Plans
|
$22.80
|
-0.07
-0.31% |
$22.88
|
643,009
103.48% of 50 DAV
50 DAV is 621,400
|
$23.47
-2.85%
|
8/27/2010
|
$19.91
|
PP = $19.75
|
|
MB = $20.74
|
Most Recent Note - 9/14/2010 5:22:22 PM
G - Holding its ground near its 52-week high and all-time high. Extended from its prior base, support to watch now is prior chart highs in the $19-20 area.
>>> The latest Featured Stock Update with an annotated graph appeared on 8/27/2010. Click here.
View all notes |
Alert me of new notes |
CANSLIM.net Company Profile |
SEC |
Zacks Reports |
StockTalk |
News |
Chart |
Request a new note
C
A N
S L
I M
|
IGTE
-
NASDAQ
Igate Corp
COMPUTER SOFTWARE and SERVICES - Information Technology Service
|
$18.15
|
-0.34
-1.84% |
$18.60
|
382,019
99.38% of 50 DAV
50 DAV is 384,400
|
$18.80
-3.46%
|
9/8/2010
|
$17.29
|
PP = $18.26
|
|
MB = $19.17
|
Most Recent Note - 9/15/2010 5:40:24 PM
Y - Pulled back today for a second consecutive small loss on near average volume, closing near its old chart high that defines an initial support level now. Technically, its gain above its pivot point and strong close on 9/13/10 with +90% above average volume triggered a buy signal.
>>> The latest Featured Stock Update with an annotated graph appeared on 9/10/2010. Click here.
View all notes |
Alert me of new notes |
CANSLIM.net Company Profile |
SEC |
Zacks Reports |
StockTalk |
News |
Chart |
Request a new note
C
A N
S L
I M
|
MELI
-
NASDAQ
Mercadolibre Inc
INTERNET - Internet Software and; Services
|
$74.35
|
+0.58
0.79% |
$74.77
|
361,542
42.21% of 50 DAV
50 DAV is 856,600
|
$74.78
-0.58%
|
5/13/2010
|
$54.21
|
PP = $55.85
|
|
MB = $58.64
|
Most Recent Note - 9/13/2010 5:08:44 PM
G - Gain today on average volume for another new high, getting more extended from a sound base. Prior highs in the $62 area and its 50 DMA line define chart support.
>>> The latest Featured Stock Update with an annotated graph appeared on 8/26/2010. Click here.
View all notes |
Alert me of new notes |
CANSLIM.net Company Profile |
SEC |
Zacks Reports |
StockTalk |
News |
Chart |
Request a new note
C
A N
S L
I M
|
MRX
-
NYSE
Medicis Pharmaceut Cl A
DRUGS - Biotechnology
|
$29.15
|
+0.07
0.24% |
$29.36
|
589,039
48.81% of 50 DAV
50 DAV is 1,206,900
|
$30.00
-2.83%
|
8/12/2010
|
$26.88
|
PP = $26.71
|
|
MB = $28.05
|
Most Recent Note - 9/14/2010 2:57:40 PM
G - Rising near its 52-week high with today's gain. Recently consolidating above prior highs in the $28 area that define an initial chart support level to watch.
>>> The latest Featured Stock Update with an annotated graph appeared on 8/12/2010. Click here.
View all notes |
Alert me of new notes |
CANSLIM.net Company Profile |
SEC |
Zacks Reports |
StockTalk |
News |
Chart |
Request a new note
C
A N
S L
I M
|
MWIV
-
NASDAQ
M W I Veterinary Supply
HEALTH SERVICES - Medical Instruments and; Supplies
|
$55.15
|
-0.82
-1.47% |
$56.01
|
36,399
49.06% of 50 DAV
50 DAV is 74,200
|
$57.34
-3.82%
|
7/29/2010
|
$52.05
|
PP = $52.09
|
|
MB = $54.69
|
Most Recent Note - 9/14/2010 3:54:42 PM
G - Today's gain without great volume conviction has it trading above its "max buy" level and the color code is changed to green. Its 50 DMA line defines important chart support.
>>> The latest Featured Stock Update with an annotated graph appeared on 9/7/2010. Click here.
View all notes |
Alert me of new notes |
CANSLIM.net Company Profile |
SEC |
Zacks Reports |
StockTalk |
News |
Chart |
Request a new note
C
A N
S L
I M
|
Symbol/Exchange
Company Name
Industry Group |
PRICE |
CHANGE
(%Change) |
Day High |
Volume
(% DAV)
(% 50 day avg vol) |
52 Wk Hi
% From Hi |
Featured
Date |
Price
Featured |
Pivot Featured |
|
Max Buy |
NEM
-
NYSE
Newmont Mining Corp
METALS and MINING - Gold
|
$62.90
|
+0.05
0.08% |
$63.30
|
6,725,476
105.81% of 50 DAV
50 DAV is 6,355,900
|
$64.03
-1.76%
|
8/31/2010
|
$61.32
|
PP = $63.48
|
|
MB = $66.65
|
Most Recent Note - 9/14/2010 1:13:37 PM
Y - Gapped up today, rallying with above average volume for a considerable gain above its pivot point. It hit a new 52-week high, and no overhead supply remains to hinder its progress. Leadership in the Mining - Gold/Silver/Gems group (L criteria) is a nice reassurance.
>>> The latest Featured Stock Update with an annotated graph appeared on 9/14/2010. Click here.
View all notes |
Alert me of new notes |
CANSLIM.net Company Profile |
SEC |
Zacks Reports |
StockTalk |
News |
Chart |
Request a new note
C
A N
S L
I M
|
NEOG
-
NASDAQ
Neogen Corp
DRUGS - Diagnostic Substances
|
$31.38
|
-0.34
-1.07% |
$31.84
|
60,926
65.02% of 50 DAV
50 DAV is 93,700
|
$32.42
-3.21%
|
9/1/2010
|
$30.79
|
PP = $30.49
|
|
MB = $32.01
|
Most Recent Note - 9/13/2010 5:13:17 PM
Y- Gain today with light volume for its second best close ever. Technically, its 9/01/10 gain above the new pivot point cited triggered a buy signal after an orderly 5-week base-on-base pattern.
>>> The latest Featured Stock Update with an annotated graph appeared on 8/20/2010. Click here.
View all notes |
Alert me of new notes |
CANSLIM.net Company Profile |
SEC |
Zacks Reports |
StockTalk |
News |
Chart |
Request a new note
C
A N
S L
I M
|
NFLX
-
NASDAQ
Netflix Inc
SPECIALTY RETAIL - Music and Video Stores
|
$143.12
|
-3.53
-2.41% |
$146.59
|
3,445,118
72.94% of 50 DAV
50 DAV is 4,723,500
|
$149.95
-4.55%
|
8/10/2010
|
$124.05
|
PP = $124.00
|
|
MB = $130.20
|
Most Recent Note - 9/15/2010 5:08:59 PM
G - Quietly consolidating from its all-time high with volume totals cooling for the past week. No resistance remains to hinder its progress.
>>> The latest Featured Stock Update with an annotated graph appeared on 8/10/2010. Click here.
View all notes |
Alert me of new notes |
CANSLIM.net Company Profile |
SEC |
Zacks Reports |
StockTalk |
News |
Chart |
Request a new note
C
A N
S L
I M
|
NTAP
-
NASDAQ
Netapp Inc
COMPUTER HARDWARE - Data Storage Devices
|
$49.30
|
+1.18
2.45% |
$49.56
|
13,374,210
181.37% of 50 DAV
50 DAV is 7,373,900
|
$49.08
0.45%
|
9/8/2010
|
$46.98
|
PP = $44.99
|
|
MB = $47.24
|
Most Recent Note - 9/15/2010 1:23:52 PM
G - Hit another new 52-week high today, getting more extended from a sound base. Support to watch is at prior chart highs near its latest pivot point.
>>> The latest Featured Stock Update with an annotated graph appeared on 9/8/2010. Click here.
View all notes |
Alert me of new notes |
CANSLIM.net Company Profile |
SEC |
Zacks Reports |
StockTalk |
News |
Chart |
Request a new note
C
A N
S L
I M
|
PAY
-
NYSE
Verifone Systems Inc
COMPUTER HARDWARE - Transaction Automation Systems
|
$27.61
|
-0.10
-0.36% |
$27.66
|
1,166,535
93.80% of 50 DAV
50 DAV is 1,243,600
|
$28.00
-1.39%
|
8/25/2010
|
$24.30
|
PP = $23.74
|
|
MB = $24.93
|
Most Recent Note - 9/13/2010 5:15:21 PM
G - Gapped up today a posted a gain with above average volume for a new 52-week high, getting more extended from a sound base.
>>> The latest Featured Stock Update with an annotated graph appeared on 8/30/2010. Click here.
View all notes |
Alert me of new notes |
CANSLIM.net Company Profile |
SEC |
Zacks Reports |
StockTalk |
News |
Chart |
Request a new note
C
A N
S L
I M
|
Symbol/Exchange
Company Name
Industry Group |
PRICE |
CHANGE
(%Change) |
Day High |
Volume
(% DAV)
(% 50 day avg vol) |
52 Wk Hi
% From Hi |
Featured
Date |
Price
Featured |
Pivot Featured |
|
Max Buy |
PRGO
-
NASDAQ
Perrigo Co
DRUGS - Drug Related Products
|
$64.43
|
+2.27
3.65% |
$64.61
|
1,617,252
153.40% of 50 DAV
50 DAV is 1,054,300
|
$64.66
-0.36%
|
9/15/2010
|
$63.73
|
PP = $64.76
|
|
MB = $68.00
|
Most Recent Note - 9/15/2010 6:41:51 PM
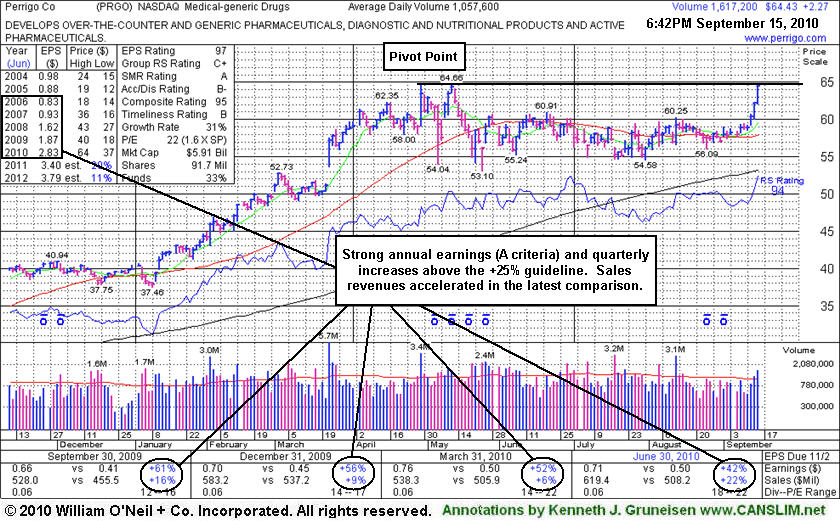
Y - Rallied near its 52 week high and finished at a new high close today. After an orderly 5-month base, its color code was changed to yellow, while confirming gains with above average volume and a close above the pivot point cited would trigger a technical buy signal. No overhead supply remains to act as resistance. The high-ranked Medical - Generic Drugs firm's sales revenues showed a +22% increase (acceleration) in the latest quarter. It has shown very strong quarterly earnings increases and has a good annual earnings (A criteria) history.
>>> The latest Featured Stock Update with an annotated graph appeared on 9/15/2010. Click here.
View all notes |
Alert me of new notes |
CANSLIM.net Company Profile |
SEC |
Zacks Reports |
StockTalk |
News |
Chart |
Request a new note
C
A N
S L
I M
|
ROVI
-
NASDAQ
Rovi Corp
COMPUTER SOFTWARE andamp; SERVICES - Security Software andamp; Services
|
$44.07
|
-0.18
-0.41% |
$44.20
|
1,433,108
123.44% of 50 DAV
50 DAV is 1,161,000
|
$45.80
-3.78%
|
8/31/2010
|
$43.31
|
PP = $45.06
|
|
MB = $47.31
|
Most Recent Note - 9/14/2010 1:15:51 PM
Y - Technically, it has not broken out from the recently noted base-on-base type pattern. It touched another new 52-week high today. Its 50 DMA line defines near-term support.
>>> The latest Featured Stock Update with an annotated graph appeared on 8/24/2010. Click here.
View all notes |
Alert me of new notes |
CANSLIM.net Company Profile |
SEC |
Zacks Reports |
StockTalk |
News |
Chart |
Request a new note
C
A N
S L
I M
|
SHOO
-
NASDAQ
Steven Madden Limited
CONSUMER NON-DURABLES - Textile - Apparel Footwear
|
$38.61
|
+0.59
1.55% |
$38.99
|
313,971
74.31% of 50 DAV
50 DAV is 422,500
|
$40.98
-5.78%
|
9/15/2010
|
$38.94
|
PP = $40.27
|
|
MB = $42.28
|
Most Recent Note - 9/15/2010 11:42:29 AM
Y - Rallying today within close striking range of its August high and its 52-week high. New pivot point is cited today based on its 7/30/10 high plus ten cents.
>>> The latest Featured Stock Update with an annotated graph appeared on 8/5/2010. Click here.
View all notes |
Alert me of new notes |
CANSLIM.net Company Profile |
SEC |
Zacks Reports |
StockTalk |
News |
Chart |
Request a new note
C
A N
S L
I M
|
SLW
-
NYSE
Silver Wheaton Corp
METALS and; MINING - Silver
|
$24.82
|
+0.08
0.32% |
$25.05
|
5,273,154
114.17% of 50 DAV
50 DAV is 4,618,600
|
$25.35
-2.09%
|
8/25/2010
|
$21.40
|
PP = $21.99
|
|
MB = $23.09
|
Most Recent Note - 9/15/2010 1:50:09 PM
G - Holding its ground at all-time highs, extended from any sound base. The previous highs in the $21 area are now a support level to watch.
>>> The latest Featured Stock Update with an annotated graph appeared on 8/25/2010. Click here.
View all notes |
Alert me of new notes |
CANSLIM.net Company Profile |
SEC |
Zacks Reports |
StockTalk |
News |
Chart |
Request a new note
C
A N
S L
I M
|
UA
-
NYSE
Under Armour Inc Cl A
CONSUMER NON-DURABLES - Textile - Apparel Clothing
|
$42.56
|
+0.35
0.83% |
$44.14
|
1,319,423
190.37% of 50 DAV
50 DAV is 693,100
|
$42.58
-0.05%
|
9/9/2010
|
$39.99
|
PP = $40.10
|
|
MB = $42.11
|
Most Recent Note - 9/15/2010 1:52:20 PM
G - Considerable gain today for another new 52-week high, on track for its 11th consecutive gain. Its color code was changed to green after getting extended from its prior chart highs. Its 9/14/10 gain with +242% of its average daily volume clinched a technical buy signal.
>>> The latest Featured Stock Update with an annotated graph appeared on 9/9/2010. Click here.
View all notes |
Alert me of new notes |
CANSLIM.net Company Profile |
SEC |
Zacks Reports |
StockTalk |
News |
Chart |
Request a new note
C
A N
S L
I M
|
Symbol/Exchange
Company Name
Industry Group |
PRICE |
CHANGE
(%Change) |
Day High |
Volume
(% DAV)
(% 50 day avg vol) |
52 Wk Hi
% From Hi |
Featured
Date |
Price
Featured |
Pivot Featured |
|
Max Buy |
ULTA
-
NASDAQ
Ulta Salon Cosm & Frag
SPECIALTY RETAIL - Specialty Retail, Other
|
$28.01
|
-0.58
-2.03% |
$28.56
|
445,217
73.91% of 50 DAV
50 DAV is 602,400
|
$29.25
-4.24%
|
9/3/2010
|
$26.36
|
PP = $25.89
|
|
MB = $27.18
|
Most Recent Note - 9/15/2010 5:10:53 PM
G - Pulled back on lighter volume today after considerable gains for new 52-week highs with above average volume. Its color code was changed to green after getting extended from its latest base.
>>> The latest Featured Stock Update with an annotated graph appeared on 9/3/2010. Click here.
View all notes |
Alert me of new notes |
CANSLIM.net Company Profile |
SEC |
Zacks Reports |
StockTalk |
News |
Chart |
Request a new note
C
A N
S L
I M
|
VIT
-
NYSE
Vanceinfo Tech Inc Ads
COMPUTER SOFTWARE and SERVICES - Business Software and Services
|
$29.21
|
+0.08
0.27% |
$29.21
|
541,695
100.00% of 50 DAV
50 DAV is 541,700
|
$30.50
-4.23%
|
7/8/2010
|
$25.20
|
PP = $26.58
|
|
MB = $27.91
|
Most Recent Note - 9/13/2010 5:24:17 PM
G - Pulling back with higher volume today and closed near the session low, enduring mild distributional pressure.
>>> The latest Featured Stock Update with an annotated graph appeared on 8/31/2010. Click here.
View all notes |
Alert me of new notes |
CANSLIM.net Company Profile |
SEC |
Zacks Reports |
StockTalk |
News |
Chart |
Request a new note
C
A N
S L
I M
|
WCRX
-
NASDAQ
Warner Chilcott Plc
DRUGS - Drug Manufacturers - Other
|
$22.28
|
+0.34
1.55% |
$22.34
|
1,348,759
57.87% of 50 DAV
50 DAV is 2,330,800
|
$22.19
0.41%
|
8/23/2010
|
$29.54
|
PP = $29.34
|
|
MB = $30.81
|
Most Recent Note - 9/15/2010 5:31:47 PM
Y - Volume was light today as it rallied to a new all-time high. (Price data will be adjusted downward to account for the recent special $8.50 cash dividend dividend impacting its share price as of 9/09/10 trading, so the "max buy" level $30.81 -$8.50 equals $22.31, pennies from today's close.
>>> The latest Featured Stock Update with an annotated graph appeared on 8/23/2010. Click here.
View all notes |
Alert me of new notes |
CANSLIM.net Company Profile |
SEC |
Zacks Reports |
StockTalk |
News |
Chart |
Request a new note
C
A N
S L
I M
|