You are not logged in.
This means you
CAN ONLY VIEW reports that were published prior to Monday, February 26, 2024.
You
MUST UPGRADE YOUR MEMBERSHIP if you want to see any current reports.
AFTER MARKET UPDATE - FRIDAY, SEPTEMBER 13TH, 2019
Previous After Market Report Next After Market Report >>>
|
|
|
|
DOW |
+37.07 |
27,219.52 |
+0.14% |
|
Volume |
818,751,740 |
-4% |
|
Volume |
1,965,768,605 |
-10% |
|
NASDAQ |
-17.76 |
8,176.71 |
-0.22% |
|
Advancers |
1,246 |
45% |
|
Advancers |
1,688 |
55% |
|
S&P 500 |
-2.18 |
3,007.39 |
-0.07% |
|
Decliners |
1,533 |
55% |
|
Decliners |
1,363 |
45% |
|
Russell 2000 |
+3.07 |
1,578.14 |
+0.20% |
|
52 Wk Highs |
88 |
|
|
52 Wk Highs |
102 |
|
|
S&P 600 |
+1.52 |
975.95 |
+0.16% |
|
52 Wk Lows |
9 |
|
|
52 Wk Lows |
24 |
|
|
 |
Indices Finished Mixed Friday But Higher for the Week
Kenneth J. Gruneisen - Passed the CAN SLIM® Master's Exam
The Dow added 37 points, marking its eighth straight advance and ending the week 1.6% higher. The S&P 500 dipped 0.1%, despite gaining 1% this week. The Nasdaq Composite lost 2% amid weakness in Tech shares, but managed to advance 0.9% on the week. Friday's volume totals reported were lighter than the prior session totals on the NYSE and on the Nasdaq exchange. Advancers led decliners by an 8-7 margin on the Nasdaq exchange, but decliners outnumbered advancers by an 8-7 margin on the NYSE. Leadership remained healthy as there were 50 high-ranked companies from the Leaders List hit new 52-week highs and were listed on the BreakOuts Page, versus the total of 52 on the prior session. New 52-week highs totals outnumbered new 52-week lows totals on the NYSE and on the Nasdaq exchange. Concerning the M criteria of the fact-based investment system, investors have a green light to make carefully selected new buying efforts. The Featured Stocks Page provides the most timely analysis on high-ranked leaders. Charts used courtesy of www.stockcharts.com
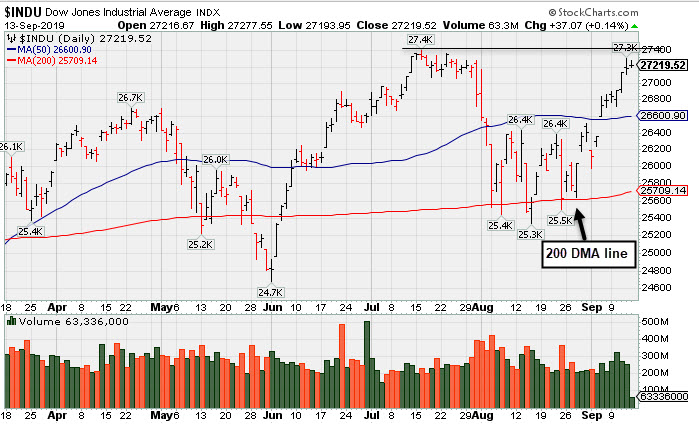
PICTURED: The Dow Jones Industrial Average is perched only -0.7% off its record high. It found support near its 200-day moving average (DMA) line during the recent consolidation.
Stock U.S. equities were mixed Friday as investors weighed trade developments and economic data releases. A report from China revealed Beijing officials will exempt U.S. agricultural products from the latest round of tariffs. The move was in response to President Trump’s decision to delay an increase in duties on Chinese goods by two weeks. The White House also indicated a willingness to accept a short term trade deal as the two countries continue to sort through “structural issues” that are impeding a broader pact at this time.
On the data front, retail sales climbed 0.4% in August, topping expectations of 0.2%. A preliminary gauge of consumer sentiment from the University of Michigan came in at 92.0, above consensus estimates of 90.8. Treasuries weakened with the yield on the benchmark 10-year note jumping 12 basis point to 1.90%. In commodities, WTI crude ticked down 0.4% to $54.85/barrel.
Seven of 11 S&P 500 sectors finished lower with Consumer Staples and Technology shares leading decliners. Broadcom (AVGO -3.41%) fell after the semiconductor offered uneasy guidance on future chip demand. Apple (AAPL -1.94%) fell following an analyst price target decrease. Elsewhere, PG&E (PCG +10.69%) rose after reaching an $11 billion dollar settlement to resolve 85% of insurance claims that resulted from wildfires.
|
 Kenneth J. Gruneisen started out as a licensed stockbroker in August 1987, a couple of months prior to the historic stock market crash that took the Dow Jones Industrial Average down -22.6% in a single day. He has published daily fact-based fundamental and technical analysis on high-ranked stocks online for two decades. Through FACTBASEDINVESTING.COM, Kenneth provides educational articles, news, market commentary, and other information regarding proven investment systems that work in good times and bad.
Comments contained in the body of this report are technical opinions only and are not necessarily those of Gruneisen Growth Corp. The material herein has been obtained from sources believed to be reliable and accurate, however, its accuracy and completeness cannot be guaranteed. Our firm, employees, and customers may effect transactions, including transactions contrary to any recommendation herein, or have positions in the securities mentioned herein or options with respect thereto. Any recommendation contained in this report may not be suitable for all investors and it is not to be deemed an offer or solicitation on our part with respect to the purchase or sale of any securities. |
|
 |
Bank Index and Energy-Linked Groups Led Gainers
Kenneth J. Gruneisen - Passed the CAN SLIM® Master's Exam
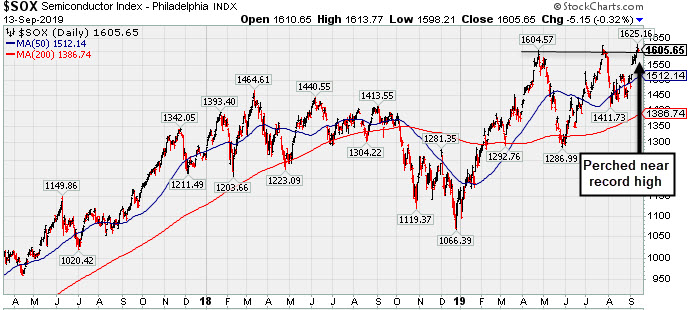
The Bank Index ($BKX +1.19%) posted another solid gain while the Broker/Dealer Index ($XBD +0.10%) and the Retail Index ($RLX -0.03%) both were little changed on Friday. The tech sector had a negative bias as the Networking Index ($NWX -1.27%) outpaced the Semiconductor Index ($SOX -0.32%) to the downside while the Biotech Index ($BTK +0.22%) posted a small gain. Commodity-linked groups were mixed as the Oil Services Index ($OSX +1.17%) and Integrated Oil Index ($XOI +0.47%) rose but the Gold & Silver Index ($XAU -1.75%) lost ground.
PICTURED: The Semiconductor Index ($SOX -0.32%) is perched near its record high.
| Oil Services |
$OSX |
71.89 |
+0.83 |
+1.17% |
-10.81% |
| Integrated Oil |
$XOI |
1,227.13 |
+5.72 |
+0.47% |
+5.87% |
| Semiconductor |
$SOX |
1,605.65 |
-5.14 |
-0.32% |
+39.00% |
| Networking |
$NWX |
567.74 |
-7.33 |
-1.27% |
+16.18% |
| Broker/Dealer |
$XBD |
277.73 |
+0.27 |
+0.10% |
+17.02% |
| Retail |
$RLX |
2,428.18 |
-0.85 |
-0.03% |
+24.43% |
| Gold & Silver |
$XAU |
89.49 |
-1.59 |
-1.75% |
+26.65% |
| Bank |
$BKX |
101.94 |
+1.20 |
+1.19% |
+18.83% |
| Biotech |
$BTK |
4,431.01 |
+9.54 |
+0.22% |
+4.98% |
|
|
|
 |
Thinly Traded Bank Rallied To Multi-Year Highs
Kenneth J. Gruneisen - Passed the CAN SLIM® Master's Exam
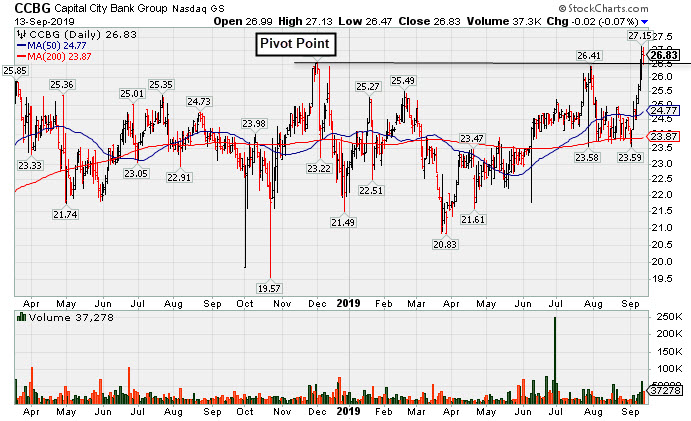
Capital City Bk Gp (CCBG -0.02 or -0.07% to $26.83 ) was highlighted in yellow with pivot point cited based on its 12/03/18 high plus 10 cents in the earlier mid-day report (read here). This thinly traded Bank is perched at a new multi-year high after a streak of volume-driven gains this week. Subsequent confirming gains above the pivot point backed by at least +40% above average volume are needed to trigger a convincing technical buy signal.
Earnings increases in the 3 latest quarterly comparisons through Jun '19 were above the +25% minimum guideline (C criteria) as its sales revenues growth rate was in the 12-13% range in the Dec '18, Mar and Jun '19 quarters versus the year ago periods. It has a Timeliness Rating of A, but a Sponsorship Rating of D
Its small supply of only 16.7 million shares outstanding (S criteria) can contribute to greater price volatility in the event of institutional buying or selling. The number of top-rated funds owning its shares rose from 159 on Sep '18 to 187 in Jun '19, a reassuring sign concerning the I criteria. Its current Up/Down Volume Ratio of 2.1 is an unbiased indication its shares have been under accumulation over the past 50 days. |
|
|
Color Codes Explained :
Y - Better candidates highlighted by our
staff of experts.
G - Previously featured
in past reports as yellow but may no longer be buyable under the
guidelines.
***Last / Change / Volume data in this table is the closing quote data***
Symbol/Exchange
Company Name
Industry Group |
PRICE |
CHANGE
(%Change) |
Day High |
Volume
(% DAV)
(% 50 day avg vol) |
52 Wk Hi
% From Hi |
Featured
Date |
Price
Featured |
Pivot Featured |
|
Max Buy |
 CCBG
-
NASDAQ
CCBG
-
NASDAQ
Capital City Bk Gp
BANKING - Regional - Mid-Atlantic Banks
|
$26.83
|
-0.02
-0.07% |
$27.13
|
37,276
196.19% of 50 DAV
50 DAV is 19,000
|
$27.15
-1.18%
|
9/13/2019
|
$27.03
|
PP = $27.05
|
|
MB = $28.40
|
 Most Recent Note - 9/13/2019 5:13:43 PM
Y - Sputtered today after highlighted in yellow with pivot point cited based on its 12/03/18 high plus 10 cents. Reported solidly improved earnings as its sales revenues growth rate was in the 12-13% range in the Dec '18, Mar and Jun '19 quarters versus the year ago periods. This thinly traded Bank is perched at a new multi-year high after a streak of volume-driven gains this week. See the latest FSU analysis for more details and a new annotated graph.
>>> FEATURED STOCK ARTICLE : Thinly Traded Bank Rallied To Multi-Year Highs - 9/13/2019 |
View all notes |
Set NEW NOTE alert |
Company Profile |
SEC
News |
Chart |
Request a new note
C
A
S
I |
EPAM
-
NYSE
Epam Systems Inc
COMPUTER SOFTWARE and SERVICES - Information Technology Service
|
$178.92
|
-5.25
-2.85% |
$184.81
|
335,627
83.28% of 50 DAV
50 DAV is 403,000
|
$201.00
-10.99%
|
5/9/2019
|
$169.25
|
PP = $180.55
|
|
MB = $189.58
|
Most Recent Note - 9/11/2019 6:12:11 PM
G - Halted its slide above the prior low ($175.33 on 8/07/19) which defines the next important support level. Rebounded toward its 50 DMA line with today's volume-driven gain. A rebound above its 50 DMA line ($189.87) is needed for its outlook to improve. Reported earnings +27% on +24% sales revenues for the Jun '19 quarter.
>>> FEATURED STOCK ARTICLE : Volume Light During Brief Consolidation Above 50-Day Average - 8/29/2019 |
View all notes |
Set NEW NOTE alert |
Company Profile |
SEC
News |
Chart |
Request a new note
C
A
S
I |
AUDC
-
NASDAQ
Audiocodes Ltd
ELECTRONICS - Scientific and Technical Instrum
|
$19.39
|
+0.95
5.12% |
$20.18
|
462,768
258.53% of 50 DAV
50 DAV is 179,000
|
$19.74
-1.80%
|
9/13/2019
|
$19.68
|
PP = $19.84
|
|
MB = $20.83
|
Most Recent Note - 9/13/2019 5:17:49 PM
Y - Encountered distributional pressure as it rallied straight-up-from-the-bottom of a short 6-week base to touch a new 52-week high today. Highlighted in yellow with new pivot point cited based on its 7/30/19 high plus 10 cents. Subsequent gains and a close above the pivot point backed by at least +40% above average volume are needed to trigger a convincing new (or add-on) technical buy signal. Found prompt support near its 50 DMA line ($17.58). The recent low ($16.51 on 8/14/19) defines important support where more damaging losses would raise concerns and trigger technical sell signals. Reported earnings +57% on +14% sales revenues for the Jun '19 quarter, continuing its strong earnings track record.
>>> FEATURED STOCK ARTICLE : Volume Cooling While Consolidating Above Support Levels - 8/30/2019 |
View all notes |
Set NEW NOTE alert |
Company Profile |
SEC
News |
Chart |
Request a new note
C
A
S
I |
LHCG
-
NASDAQ
L H C Group Inc
HEALTH SERVICES - Home Health Care
|
$117.61
|
-0.82
-0.69% |
$120.86
|
169,756
78.96% of 50 DAV
50 DAV is 215,000
|
$129.37
-9.09%
|
7/1/2019
|
$110.94
|
PP = $122.20
|
|
MB = $128.31
|
Most Recent Note - 9/12/2019 5:25:50 PM
G - Halted its slide after losses this week undercutting the prior low ($116.67 on 8/13/19) triggering a worrisome technical sell signal. Still sputtering below its 50 DMA line ($121.37) which has acted as resistance. See the latest FSU analysis for more details and a new annotated graph.
>>> FEATURED STOCK ARTICLE : 50-Day Moving Average Recently Acted as Resistance - 9/12/2019 |
View all notes |
Set NEW NOTE alert |
Company Profile |
SEC
News |
Chart |
Request a new note
C
A
S
I |
CHDN
-
NASDAQ
Churchill Downs Inc
LEISURE - Gaming Activities
|
$124.49
|
+0.93
0.75% |
$125.36
|
163,500
74.32% of 50 DAV
50 DAV is 220,000
|
$132.73
-6.21%
|
7/22/2019
|
$118.45
|
PP = $118.89
|
|
MB = $124.83
|
Most Recent Note - 9/10/2019 11:00:18 AM
Y - Consolidating above its 50 DMA line ($120). Below that important short-term average, the prior low ($113.88 on 8/05/19) defines the next support level. Jun '19 earnings +10% on +26% sales revenues versus the year ago period were below the +25% minimum earnings guideline (C criteria), noted recently raising fundamental concerns.
>>> FEATURED STOCK ARTICLE : Found Support After Making Limited Progress - 9/4/2019 |
View all notes |
Set NEW NOTE alert |
Company Profile |
SEC
News |
Chart |
Request a new note
C
A
S
I |
Symbol/Exchange
Company Name
Industry Group |
PRICE |
CHANGE
(%Change) |
Day High |
Volume
(% DAV)
(% 50 day avg vol) |
52 Wk Hi
% From Hi |
Featured
Date |
Price
Featured |
Pivot Featured |
|
Max Buy |
LULU
-
NASDAQ
Lululemon Athletica
MANUFACTURING - Textile Manufacturing
|
$195.18
|
-3.55
-1.79% |
$199.42
|
1,475,950
83.25% of 50 DAV
50 DAV is 1,773,000
|
$204.44
-4.53%
|
9/6/2019
|
$201.25
|
PP = $194.35
|
|
MB = $204.07
|
Most Recent Note - 9/13/2019 5:19:40 PM
Y - Quietly hovering near its all-time high following volume driven gains. Reported earnings +35% on +22% sales revenues for the Jul '19 quarter. Prior high ($194.25) defines initial support to watch above its 50 DMA line ($188.84).
>>> FEATURED STOCK ARTICLE : Sank Below 50-Day Average Toward Prior Lows With High Volume - 9/3/2019 |
View all notes |
Set NEW NOTE alert |
Company Profile |
SEC
News |
Chart |
Request a new note
C
A
S
I |
CPRT
-
NASDAQ
Copart Inc
SPECIALTY RETAIL - Auto Dealerships
|
$81.81
|
+0.93
1.15% |
$82.01
|
1,719,822
139.48% of 50 DAV
50 DAV is 1,233,000
|
$83.55
-2.08%
|
9/5/2019
|
$79.13
|
PP = $79.84
|
|
MB = $83.83
|
Most Recent Note - 9/10/2019 5:44:13 PM
Y - Pulled back with lighter (near average) volume today following 4 consecutive volume-driven gains. The big volume-driven gain above the pivot point on 9/05/19 clinched a technical buy signal. Fundamentals are strong.
>>> FEATURED STOCK ARTICLE : Heavy Volume Behind Breakout Gain After Earnings Report - 9/5/2019 |
View all notes |
Set NEW NOTE alert |
Company Profile |
SEC
News |
Chart |
Request a new note
C
A
S
I |
BLD
-
NYSE
Topbuild Corp
Bldg-Constr Prds/Misc
|
$92.87
|
+0.12
0.13% |
$94.28
|
231,238
82.00% of 50 DAV
50 DAV is 282,000
|
$96.01
-3.27%
|
5/17/2019
|
$82.19
|
PP = $87.31
|
|
MB = $91.68
|
Most Recent Note - 9/10/2019 5:40:26 PM
G - Quietly perched within close striking distance of its all-time high. stubbornly holding its ground in a tight range. Earnings rose +39% on +9% sales revenues for the Jun '19 quarter versus the year ago period. Prior highs in the $86 area and its 50 DMA line ($86.50) coincide defining important support to watch on pullbacks. See the latest FSU analysis for more details and a new annotated graph.
>>> FEATURED STOCK ARTICLE : Holding Ground Stubbornly in Tight Range Near Record High - 9/10/2019 |
View all notes |
Set NEW NOTE alert |
Company Profile |
SEC
News |
Chart |
Request a new note
C
A
S
I |
PAGS
-
NYSE
Pagseguro Digital Cl A
Finance-CrdtCard/PmtPr
|
$45.87
|
-1.14
-2.43% |
$47.80
|
764,049
34.73% of 50 DAV
50 DAV is 2,200,000
|
$53.43
-14.15%
|
6/25/2019
|
$37.69
|
PP = $40.07
|
|
MB = $42.07
|
Most Recent Note - 9/12/2019 5:19:52 PM
G - With a big gain today on lighter than average volume it rebounded and closed above its 50 DMA line ($46.66) helping its outlook to improve. Big losses this week triggered a technical sell signal, but it halted its slide above the prior low ($42.00 on 8/05/19) which defines the next important chart support level. Fundamentals are strong. See the latest FSU analysis for more details and an annotated graph.
>>> FEATURED STOCK ARTICLE : 50-Day Moving Average Violation Triggered Technical Sell Signal - 9/11/2019 |
View all notes |
Set NEW NOTE alert |
Company Profile |
SEC
News |
Chart |
Request a new note
C
A
S
I |
|
|
|
THESE ARE NOT BUY RECOMMENDATIONS!
Comments contained in the body of this report are technical
opinions only. The material herein has been obtained
from sources believed to be reliable and accurate, however,
its accuracy and completeness cannot be guaranteed.
This site is not an investment advisor, hence it does
not endorse or recommend any securities or other investments.
Any recommendation contained in this report may not
be suitable for all investors and it is not to be deemed
an offer or solicitation on our part with respect to
the purchase or sale of any securities. All trademarks,
service marks and trade names appearing in this report
are the property of their respective owners, and are
likewise used for identification purposes only.
This report is a service available
only to active Paid Premium Members.
You may opt-out of receiving report notifications
at any time. Questions or comments may be submitted
by writing to Premium Membership Services 665 S.E. 10 Street, Suite 201 Deerfield Beach, FL 33441-5634 or by calling 1-800-965-8307
or 954-785-1121.
|
|
|