You are not logged in.
This means you
CAN ONLY VIEW reports that were published prior to Monday, April 14, 2025.
You
MUST UPGRADE YOUR MEMBERSHIP if you want to see any current reports.
AFTER MARKET UPDATE - TUESDAY, SEPTEMBER 13TH, 2011
Previous After Market Report Next After Market Report >>>
|
|
|
|
DOW |
+44.73 |
11,105.85 |
+0.40% |
|
Volume |
1,070,809,400 |
-1% |
|
Volume |
1,884,764,920 |
-3% |
|
NASDAQ |
+37.06 |
2,532.15 |
+1.49% |
|
Advancers |
2,110 |
68% |
|
Advancers |
1,917 |
72% |
|
S&P 500 |
+10.60 |
1,172.87 |
+0.91% |
|
Decliners |
895 |
29% |
|
Decliners |
625 |
24% |
|
Russell 2000 |
+11.98 |
691.74 |
+1.76% |
|
52 Wk Highs |
13 |
|
|
52 Wk Highs |
12 |
|
|
S&P 600 |
+6.07 |
378.07 |
+1.63% |
|
52 Wk Lows |
42 |
|
|
52 Wk Lows |
72 |
|
|
 |
Major Averages Overcame Sluggish Start For Gains on Light Volume
Kenneth J. Gruneisen - Passed the CAN SLIM® Master's Exam
The major indices got off to a sluggish start on Tuesday yet again finished near the session highs with gains. Slightly lower volume totals were reported on the NYSE and on the Nasdaq exchange, again an indication of lackluster buying demand from the institutional crowd. Advancers led decliners by more than 2-1 on the NYSE and by more than 3-1 on the Nasdaq.exchange. The new 52-week lows totals contracted yet still easily outnumbered new 52-week highs on both major exchanges. There were 8 high-ranked companies from the CANSLIM.net Leaders List that made new 52-week highs and appeared on the CANSLIM.net BreakOuts Page, up from the prior session total of only 2 stocks. Any sustainable rally requires a healthy crop of strong leaders hitting new 52-week highs, as this commentary has repeated! There were 2 decliners out of the 9 high-ranked leaders currently included on the Featured Stocks Page.
A survey by the National Federation of Independent Business showed confidence among U.S. small businesses dropped in July for the fifth consecutive month on a dimming outlook for sales and the U.S. economy. A new economic report suggested slower growth around the world has dampened commodity prices, and that could lead to further moderation in inflationary pressures. August import prices declined 0.4%, the second decrease in three months. Moderation was not evident in the oil patch on the session, as the price of crude climbed to the highest level in five weeks.
U.S. financial stocks, including Morgan Stanley Co (MS +3.26%), advanced after banks in France eased concerns over their access to funding. Aetna Inc (AET +5.44%) rose after the company raised its 2011 outlook for profits. Meanwhile, Best Buy Co Inc (BBY -6.45%) fell after earnings and revenue missed estimates.
The market environment (M criteria) can barely be considered an uptrend that is under pressure, meanwhile the major averages are at least still sputtering above their Day 1 (8/09/11) lows. Disciplined investors may only want to carefully consider new buying efforts when all key criteria are satisfied, and they may be wise to wait and see more evidence of new leadership before committing sidelined cash to substantial new positions.
The September 2011 issue of CANSLIM.net News will be available soon. The Q3 2011 Webcast has also been scheduled for Wednesday, September 28th at 8PM EST. Links to all prior reports and webcasts are available on the Premium Member Homepage.
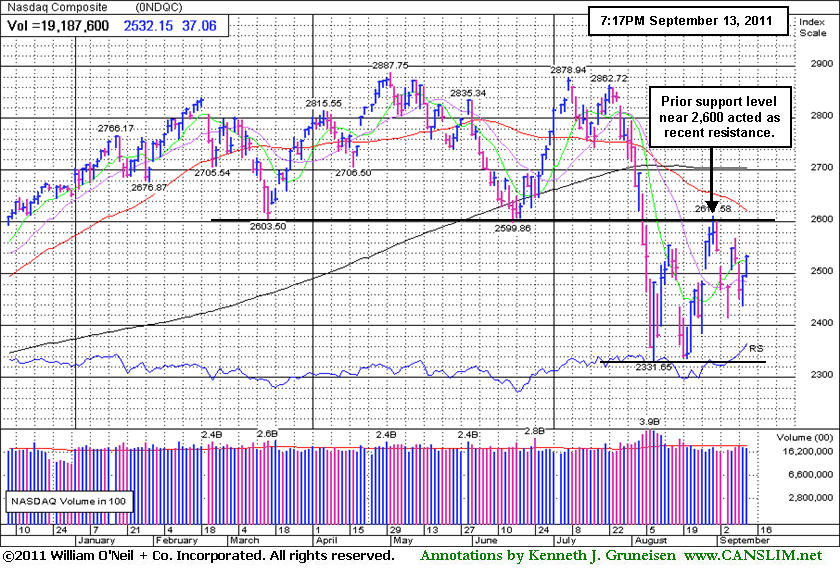
PICTURED: The Nasdaq Composite Index's chart illustrates how a prior support level in the 2,600 area recently acted as a resistance level.
|
 Kenneth J. Gruneisen started out as a licensed stockbroker in August 1987, a couple of months prior to the historic stock market crash that took the Dow Jones Industrial Average down -22.6% in a single day. He has published daily fact-based fundamental and technical analysis on high-ranked stocks online for two decades. Through FACTBASEDINVESTING.COM, Kenneth provides educational articles, news, market commentary, and other information regarding proven investment systems that work in good times and bad.
Comments contained in the body of this report are technical opinions only and are not necessarily those of Gruneisen Growth Corp. The material herein has been obtained from sources believed to be reliable and accurate, however, its accuracy and completeness cannot be guaranteed. Our firm, employees, and customers may effect transactions, including transactions contrary to any recommendation herein, or have positions in the securities mentioned herein or options with respect thereto. Any recommendation contained in this report may not be suitable for all investors and it is not to be deemed an offer or solicitation on our part with respect to the purchase or sale of any securities. |
|
 |
Healthcare, Tech, Financial, and Retail Groups Led Gainers
Kenneth J. Gruneisen - Passed the CAN SLIM® Master's Exam
The Healthcare Index ($HMO +2.81%) was a standout gainer on Tuesday and the tech sector saw unanimous gains from the Networking Index ($NWX +2.94%), Semiconductor Index ($SOX +2.01%), Biotechnology Index ($BTK +1.26%), and Internet Index ($IIX +0.97%). The Bank Index ($BKX +1.19%) and Broker/Dealer Index ($XBD +1.79%) also had a positive influence on the major averages, and the Retail Index ($RLX +0.82%) helped pad the session's gains. Strength in energy related shares boosted the Integrated Oil Index ($XOI +0.65%) and the Oil Services Index ($OSX +0.99%), and the Gold & Silver Index ($XAU +0.50%) posted a smaller gain.
Charts courtesy www.stockcharts.com
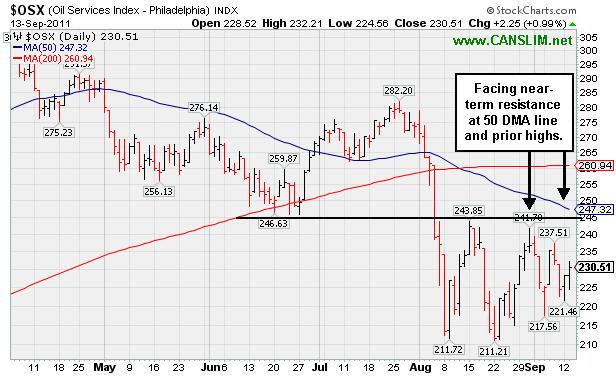
PICTURED: The Oil Services Index ($OSX +0.99%) is facing near-term resistance at its 50-day moving average (DMA) line and prior highs.
| Oil Services |
$OSX |
230.51 |
+2.25 |
+0.99% |
-5.96% |
| Healthcare |
$HMO |
2,010.90 |
+54.97 |
+2.81% |
+18.85% |
| Integrated Oil |
$XOI |
1,111.00 |
+7.13 |
+0.65% |
-8.42% |
| Semiconductor |
$SOX |
366.17 |
+7.21 |
+2.01% |
-11.08% |
| Networking |
$NWX |
238.86 |
+6.82 |
+2.94% |
-14.86% |
| Internet |
$IIX |
281.68 |
+2.71 |
+0.97% |
-8.47% |
| Broker/Dealer |
$XBD |
85.61 |
+1.50 |
+1.79% |
-29.55% |
| Retail |
$RLX |
508.03 |
+4.15 |
+0.82% |
-0.07% |
| Gold & Silver |
$XAU |
218.34 |
+1.09 |
+0.50% |
-3.64% |
| Bank |
$BKX |
37.34 |
+0.44 |
+1.19% |
-28.48% |
| Biotech |
$BTK |
1,172.37 |
+14.62 |
+1.26% |
-9.65% |
|
|
|
 |
Set-Up Has Bullish Characteristics Yet Requires Patience
Kenneth J. Gruneisen - Passed the CAN SLIM® Master's Exam
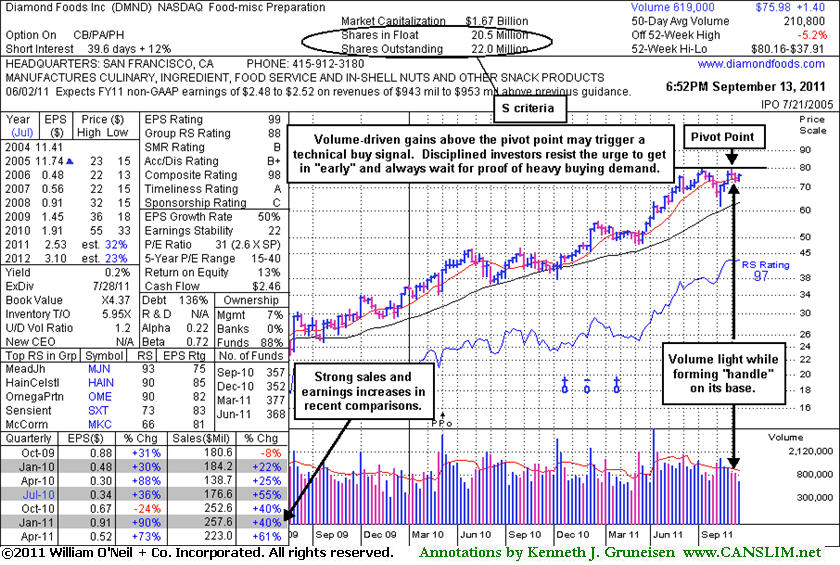
A proper technical buy signal under the investment system's guidelines requires a gain above the pivot backed by more than +40-50% above average volume. Most big winners in market history, in fact, blasted off with very heavy volume, they did not barely limp over their pivot points. Volume is a critical component to a sound technical breakout, as the intense burst of trading activity is what gives investors evidence of serious institutional buying demand - which is needed for a sustained advance!
Diamond Foods Inc (DMND +$0.53 or +0.70% to $75.98) was highlighted in yellow earlier today in the mid-day report (read here). Its color code was changed to yellow while perched -5.8% off its 52-week high. Subsequent gains with heavy volume above the new pivot point cited based on its 8/31/11 high may trigger a technical buy signal. It has been recently consolidating above support at its 50-day moving average (DMA) line and volume totals were light while forming a "handle" on its latest base. It found support well above its 200 DMA line as it formed a cup-with-handle type base following its ascent since previously noted 4/05/11 news it was buying Procter & Gamble's Pringles. It has demonstrated a strong earnings history in recent years (A criteria). Earnings rose +73% on +61% sales revenues in the quarter ended April 30, 2011 versus the year ago period. The Dec '10 quarter also showed strong increases, but quarterly earnings were reported at -24% for the Oct '10 period, a flaw in its otherwise impressive earnings history. Small supply of only 22 million outstanding shares (S criteria) could contribute to greater volatility in the event of any institutional maneuvering.
|
|
|
Color Codes Explained :
Y - Better candidates highlighted by our
staff of experts.
G - Previously featured
in past reports as yellow but may no longer be buyable under the
guidelines.
***Last / Change / Volume data in this table is the closing quote data***
Symbol/Exchange
Company Name
Industry Group |
PRICE |
CHANGE
(%Change) |
Day High |
Volume
(% DAV)
(% 50 day avg vol) |
52 Wk Hi
% From Hi |
Featured
Date |
Price
Featured |
Pivot Featured |
|
Max Buy |
ATHN
-
NASDAQ
Athenahealth Inc
DIVERSIFIED SERVICES - Business/Management Services
|
$65.64
|
+5.12
8.46% |
$66.00
|
1,483,010
214.12% of 50 DAV
50 DAV is 692,600
|
$63.74
2.98%
|
9/8/2011
|
$61.93
|
PP = $61.78
|
|
MB = $64.87
|
 Most Recent Note - 9/13/2011 6:50:34 PM
G - Spiked to a new all-time high today with more than 2 times average volume. Color code is changed to green after it rose above its "max buy" level. Disciplined investors use a tactic called "pyramiding" to avoid chasing stocks more than +5% above prior highs. Always minimize losses by selling if any stock falls -7% from their buy point.
>>> The latest Featured Stock Update with an annotated graph appeared on 9/8/2011. Click here.
View all notes |
Alert me of new notes |
CANSLIM.net Company Profile |
SEC |
Zacks Reports |
StockTalk |
News |
Chart |
Request a new note
C
A N
S L
I M


|
DMND
-
NASDAQ
Diamond Foods Inc
FOOD and; BEVERAGE - Processed and; Packaged Goods
|
$75.98
|
+0.53
0.70% |
$76.70
|
386,672
183.43% of 50 DAV
50 DAV is 210,800
|
$80.16
-5.21%
|
9/13/2011
|
$75.57
|
PP = $80.16
|
|
MB = $84.17
|
Most Recent Note - 9/13/2011 7:28:00 PM
Y - Posted a small gain today with above average volume. Subsequent gains with heavy volume above the new pivot point cited based on its 8/31/11 high may trigger a technical buy signal. It was featured in yellow in today's mid-day report while perched -5.8% off its 52-week high and consolidating above support at its 50 DMA line. It found support well above its 200 DMA line as it formed a cup-with-handle type base following its ascent since previously noted 4/05/11 news it was buying Procter & Gamble's Pringles. Strong earnings history in recent years (A criteria). Earnings rose +73% on +61% sales revenues in the quarter ended April 30, 2011 versus the year ago period. The Dec '10 quarter also showed strong increases, but quarterly earnings were reported at -24% for the Oct '10 period, a flaw in its otherwise impressive earnings history. Small supply of only 22 million outstanding shares (S criteria) could contribute to greater volatility in the event of any institutional maneuvering. See the latest FSU analysis for more details and an annotated weekly graph.
>>> The latest Featured Stock Update with an annotated graph appeared on 9/13/2011. Click here.
View all notes |
Alert me of new notes |
CANSLIM.net Company Profile |
SEC |
Zacks Reports |
StockTalk |
News |
Chart |
Request a new note
C
A N
S L
I M
|
EXLS
-
NASDAQ
Exlservice Holdings Inc
DIVERSIFIED SERVICES - Business/Management Services
|
$23.01
|
-1.88
-7.55% |
$23.75
|
537,622
539.78% of 50 DAV
50 DAV is 99,600
|
$26.55
-13.33%
|
8/2/2011
|
$24.85
|
PP = $24.85
|
|
MB = $26.09
|
Most Recent Note - 9/13/2011 7:31:57 PM
G - Down considerably after a damaging gap down today following news of an offering of 3 million shares by existing shareholders and 1 million shares by the company. Color code was changed to green after it violated its 50 DMA line, raising concerns and triggering a technical sell signal while quickly slumping near its 200 DMA line. Only a prompt rebound above its short-term average would help its outlook.
>>> The latest Featured Stock Update with an annotated graph appeared on 9/7/2011. Click here.
View all notes |
Alert me of new notes |
CANSLIM.net Company Profile |
SEC |
Zacks Reports |
StockTalk |
News |
Chart |
Request a new note
C
A N
S L
I M
|
FCFS
-
NASDAQ
First Cash Financial Svs
SPECIALTY RETAIL - Specialty Retail, Other
|
$48.66
|
+0.31
0.64% |
$48.89
|
249,941
69.64% of 50 DAV
50 DAV is 358,900
|
$49.13
-0.96%
|
5/31/2011
|
$42.00
|
PP = $40.23
|
|
MB = $42.24
|
Most Recent Note - 9/13/2011 7:32:45 PM
G - Still holding its ground stubbornly with volume totals cooling while perched near its all-time high, extended from its prior base. Its 50 DMA line defines supports to watch.
>>> The latest Featured Stock Update with an annotated graph appeared on 9/6/2011. Click here.
View all notes |
Alert me of new notes |
CANSLIM.net Company Profile |
SEC |
Zacks Reports |
StockTalk |
News |
Chart |
Request a new note
C
A N
S L
I M
|
JCOM
-
NASDAQ
J 2 Global Communication
INTERNET - Internet Software and Services
|
$31.35
|
+0.66
2.15% |
$31.63
|
479,256
117.12% of 50 DAV
50 DAV is 409,200
|
$32.64
-3.95%
|
8/8/2011
|
$30.38
|
PP = $29.31
|
|
MB = $30.78
|
Most Recent Note - 9/13/2011 7:33:44 PM
G - Gain today came with better above average volume, finishing -4% off its 52-week high. Previous highs in the $30-31 area define initial chart support to watch.
>>> The latest Featured Stock Update with an annotated graph appeared on 8/29/2011. Click here.
View all notes |
Alert me of new notes |
CANSLIM.net Company Profile |
SEC |
Zacks Reports |
StockTalk |
News |
Chart |
Request a new note
C
A N
S L
I M
|
Symbol/Exchange
Company Name
Industry Group |
PRICE |
CHANGE
(%Change) |
Day High |
Volume
(% DAV)
(% 50 day avg vol) |
52 Wk Hi
% From Hi |
Featured
Date |
Price
Featured |
Pivot Featured |
|
Max Buy |
MA
-
NYSE
Mastercard Inc Cl A
DIVERSIFIED SERVICES - Business/Management Services
|
$328.86
|
+6.82
2.12% |
$328.87
|
1,030,219
70.53% of 50 DAV
50 DAV is 1,460,700
|
$345.13
-4.71%
|
8/3/2011
|
$324.82
|
PP = $322.38
|
|
MB = $338.50
|
Most Recent Note - 9/13/2011 7:35:14 PM
Y - Consolidating recently near important support at its 50 DMA line and above its prior pivot point. A damaging violation of its 50 DMA would raise concerns and may trigger a technical sell signal.
>>> The latest Featured Stock Update with an annotated graph appeared on 9/12/2011. Click here.
View all notes |
Alert me of new notes |
CANSLIM.net Company Profile |
SEC |
Zacks Reports |
StockTalk |
News |
Chart |
Request a new note
C
A N
S L
I M
|
MG
-
NYSE
Mistras Group Inc
DIVERSIFIED SERVICES - Bulding and Faci;ity Management Services
|
$20.11
|
+0.10
0.50% |
$20.36
|
144,482
81.03% of 50 DAV
50 DAV is 178,300
|
$20.82
-3.41%
|
8/10/2011
|
$17.89
|
PP = $17.58
|
|
MB = $18.46
|
Most Recent Note - 9/13/2011 7:36:22 PM
G - Still holding its ground stubbornly near its 52-week high. Prior resistance in the $18 area and its 50 DMA line define important chart support to watch on pullbacks.
>>> The latest Featured Stock Update with an annotated graph appeared on 9/9/2011. Click here.
View all notes |
Alert me of new notes |
CANSLIM.net Company Profile |
SEC |
Zacks Reports |
StockTalk |
News |
Chart |
Request a new note
C
A N
S L
I M
|
MKTX
-
NASDAQ
Marketaxess Holdings Inc
FINANCIAL SERVICES - Investment Brokerage - Nationa
|
$29.38
|
-0.06
-0.20% |
$30.86
|
452,736
180.81% of 50 DAV
50 DAV is 250,400
|
$30.95
-5.07%
|
7/29/2011
|
$25.87
|
PP = $26.35
|
|
MB = $27.67
|
Most Recent Note - 9/13/2011 7:39:07 PM
G - Reversed late day and finished near the session low with its second loss on above average volume in the span of 3 sessions, action indicative of distributional pressure. It has been noted as extended from its prior base. Prior resistance in the $26 area and its 50 DMA line define important chart support to watch.
>>> The latest Featured Stock Update with an annotated graph appeared on 9/2/2011. Click here.
View all notes |
Alert me of new notes |
CANSLIM.net Company Profile |
SEC |
Zacks Reports |
StockTalk |
News |
Chart |
Request a new note
C
A N
S L
I M
|
PSMT
-
NASDAQ
Pricesmart Inc
RETAIL - Drug Stores
|
$69.74
|
+1.93
2.85% |
$69.74
|
364,491
127.44% of 50 DAV
50 DAV is 286,000
|
$68.05
2.48%
|
8/30/2011
|
$63.01
|
PP = $62.37
|
|
MB = $65.49
|
Most Recent Note - 9/13/2011 7:39:57 PM
G - Rallied even higher today for a 6th consecutive gain backed by above average volume, getting more extended from its prior base. Prior highs and its 50 DMA line define support levels to watch on pullbacks.
>>> The latest Featured Stock Update with an annotated graph appeared on 8/30/2011. Click here.
View all notes |
Alert me of new notes |
CANSLIM.net Company Profile |
SEC |
Zacks Reports |
StockTalk |
News |
Chart |
Request a new note
C
A N
S L
I M
|
|
|
|
THESE ARE NOT BUY RECOMMENDATIONS!
Comments contained in the body of this report are technical
opinions only. The material herein has been obtained
from sources believed to be reliable and accurate, however,
its accuracy and completeness cannot be guaranteed.
This site is not an investment advisor, hence it does
not endorse or recommend any securities or other investments.
Any recommendation contained in this report may not
be suitable for all investors and it is not to be deemed
an offer or solicitation on our part with respect to
the purchase or sale of any securities. All trademarks,
service marks and trade names appearing in this report
are the property of their respective owners, and are
likewise used for identification purposes only.
This report is a service available
only to active Paid Premium Members.
You may opt-out of receiving report notifications
at any time. Questions or comments may be submitted
by writing to Premium Membership Services 665 S.E. 10 Street, Suite 201 Deerfield Beach, FL 33441-5634 or by calling 1-800-965-8307
or 954-785-1121.
|
|
|

