You are not logged in.
This means you
CAN ONLY VIEW reports that were published prior to Monday, March 31, 2025.
You
MUST UPGRADE YOUR MEMBERSHIP if you want to see any current reports.
AFTER MARKET UPDATE - WEDNESDAY, SEPTEMBER 14TH, 2011
Previous After Market Report Next After Market Report >>>
|
|
|
|
DOW |
+140.88 |
11,246.73 |
+1.27% |
|
Volume |
1,085,481,410 |
+1% |
|
Volume |
2,330,849,025 |
+24% |
|
NASDAQ |
+40.40 |
2,572.55 |
+1.60% |
|
Advancers |
2,194 |
71% |
|
Advancers |
1,892 |
71% |
|
S&P 500 |
+15.81 |
1,188.68 |
+1.35% |
|
Decliners |
804 |
26% |
|
Decliners |
655 |
25% |
|
Russell 2000 |
+12.38 |
704.12 |
+1.79% |
|
52 Wk Highs |
19 |
|
|
52 Wk Highs |
33 |
|
|
S&P 600 |
+6.62 |
384.70 |
+1.75% |
|
52 Wk Lows |
44 |
|
|
52 Wk Lows |
66 |
|
|
 |
Indices Rally With Slightly Better Volume and Leadership
Kenneth J. Gruneisen - Passed the CAN SLIM® Master's Exam
The major indices tallied their best gains of a 3 session winning streak on Wednesday. Higher volume totals were reported on the NYSE and on the Nasdaq exchange, indicating better buying demand from the institutional crowd. Advancing issues beat decliners by 11-4 on the NYSE and by 3-1 on the Nasdaq exchange. The new 52-week lows totals still outnumbered rising new 52-week highs totals on both major exchanges. There were 18 high-ranked companies from the CANSLIM.net Leaders List that made new 52-week highs and appeared on the CANSLIM.net BreakOuts Page, more than doubling the prior session total of 8 stocks. Any sustainable rally requires a healthy crop of strong leaders hitting new 52-week highs, as this commentary has repeated! There were 8 gainers out of the 9 high-ranked leaders currently included on the Featured Stocks Page.

U.S. Treasury Secretary Timothy Geithner told a conference in New York, "There is no chance the major countries of Europe will let their institutions be at risk in the eyes of the market." Expectations are also building that Europe will take additional steps to ease its debt crisis, and the market welcomed European support for debt-ridden Greece. German Chancellor Angela Merkel and French President Nicolas Sarkozy said they are convinced Greece will remain in the euro area. Their statement suggested Greece will receive the next segment of its aid package.
A weaker-than-expected economic report took some of the starch out of the early advance. August retail sales were unchanged. Analysts were looking for a gain of 0.2%. A separate report showed wholesale prices in the U.S. were unchanged in August, in line with expectations, as costs decreased for energy and automobiles.
Avis Budget Group Inc (CAR +6.30%) dropped its pursuit of Dollar Thrifty Automotive Group Inc (DTG +0.53%), citing market conditions. That leaves Hertz Global Holdings Inc (HTZ +13.47%) as the sole bidder. Dell Inc (DELL +3.34%) rose after the company's board authorized an additional $5 billion for stock repurchases. Yahoo! Inc (YHOO +2.07%) climbed to its highest price since July after a major shareholder increased pressure on the board to fire the company's chairman. Ralcorp Holdings Inc (RAH -7.1%) fell a day after ConAgra Foods (CAG -2.54%) threatened to withdraw its offer to acquire the food company if it did not begin negotiating a deal by late Monday.
The market environment (M criteria) remains in an uptrend despite recent pressure, and disciplined investors may carefully consider new buying efforts when all key criteria are satisfied. While it is encouraging that the major averages have been keeping the rally alive by staying well above their Day 1 (8/09/11) lows, a further expansion in leadership (new 52-week highs) remains crucial to any sustained advance.
The September 2011 issue of CANSLIM.net News will be available soon. The Q3 2011 Webcast has also been scheduled for Wednesday, September 28th at 8PM EST. Links to all prior reports and webcasts are available on the Premium Member Homepage.
PICTURED: The Dow Jones Industrial Average rose as many as 280 points, erasing an early 112-point drop, before closing Wednesday's session up 140 at 11,246. The current rally began with "Day 1" on 8/09/11.
|
 Kenneth J. Gruneisen started out as a licensed stockbroker in August 1987, a couple of months prior to the historic stock market crash that took the Dow Jones Industrial Average down -22.6% in a single day. He has published daily fact-based fundamental and technical analysis on high-ranked stocks online for two decades. Through FACTBASEDINVESTING.COM, Kenneth provides educational articles, news, market commentary, and other information regarding proven investment systems that work in good times and bad.
Comments contained in the body of this report are technical opinions only and are not necessarily those of Gruneisen Growth Corp. The material herein has been obtained from sources believed to be reliable and accurate, however, its accuracy and completeness cannot be guaranteed. Our firm, employees, and customers may effect transactions, including transactions contrary to any recommendation herein, or have positions in the securities mentioned herein or options with respect thereto. Any recommendation contained in this report may not be suitable for all investors and it is not to be deemed an offer or solicitation on our part with respect to the purchase or sale of any securities. |
|
 |
Tech, Financial, Retail, and Energy Indexes Rise
Kenneth J. Gruneisen - Passed the CAN SLIM® Master's Exam
The Semiconductor Index ($SOX +2.61%), Networking Index ($NWX +1.74%), Internet Index ($IIX +1.50%), and Biotechnology Index ($BTK +1.34%) posted unanimous gains that helped the tech-heavy Nasdaq Composite Index and small-cap indexes outperform their larger peers. The Retail Index ($RLX +1.67%) and financial groups including the Broker/Dealer Index ($XBD +1.18%) and Bank Index ($BKX +1.71%) underpinned the major averages' gains. The Integrated Oil Index ($XOI +1.36%) and Oil Services Index ($OSX +1.51%) ratcheted higher. Meanwhile, defensive groups were laggards as the Gold & Silver Index ($XAU -1.62%) lost ground and the Healthcare Index ($HMO +0.61%) posted a small gain.
Charts courtesy www.stockcharts.com
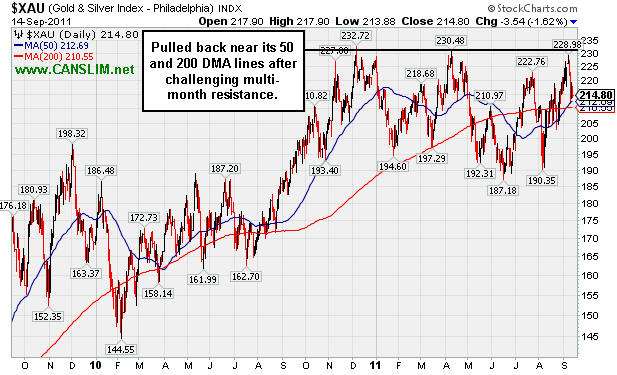
PICTURED: The Gold & Silver Index ($XAU -1.62%) has recently pulled back near its 50-day and 200-day moving average (DMA) lines after challenging multi-month resistance.
| Oil Services |
$OSX |
234.00 |
+3.49 |
+1.51% |
-4.54% |
| Healthcare |
$HMO |
2,023.21 |
+12.31 |
+0.61% |
+19.58% |
| Integrated Oil |
$XOI |
1,126.15 |
+15.15 |
+1.36% |
-7.17% |
| Semiconductor |
$SOX |
375.73 |
+9.56 |
+2.61% |
-8.76% |
| Networking |
$NWX |
243.01 |
+4.16 |
+1.74% |
-13.38% |
| Internet |
$IIX |
285.93 |
+4.23 |
+1.50% |
-7.08% |
| Broker/Dealer |
$XBD |
86.63 |
+1.01 |
+1.18% |
-28.71% |
| Retail |
$RLX |
516.52 |
+8.49 |
+1.67% |
+1.60% |
| Gold & Silver |
$XAU |
214.80 |
-3.54 |
-1.62% |
-5.20% |
| Bank |
$BKX |
37.98 |
+0.64 |
+1.71% |
-27.26% |
| Biotech |
$BTK |
1,188.11 |
+15.76 |
+1.34% |
-8.44% |
|
|
|
 |
Streak of Gains Leaves Leader Extended From Base
Kenneth J. Gruneisen - Passed the CAN SLIM® Master's Exam
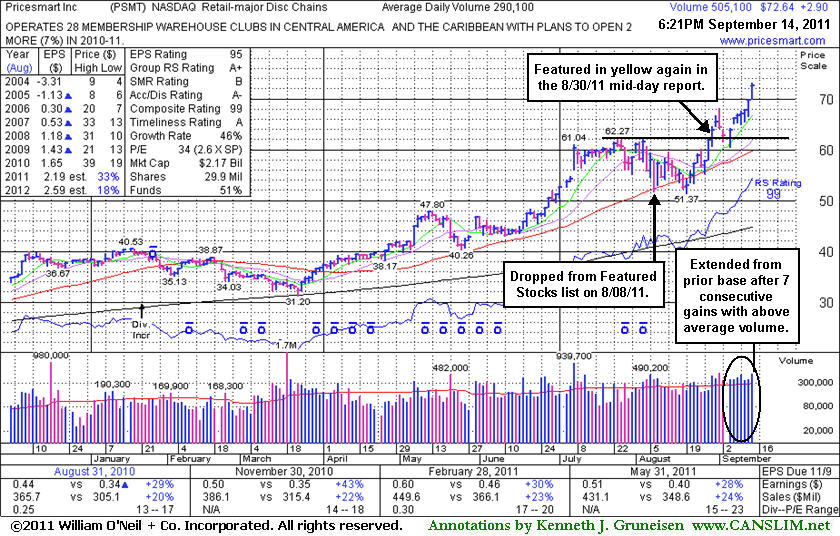
Pricesmart Inc (PSMT +$2.90 or +4.16% to $72.64) rallied even higher today, getting more extended from its prior base. Before its impressive streak of 7 consecutive gains backed by above average volume, prior chart highs had acted as a support level on a brief pullback. Typically about 40% of breakouts pull back and find support near their prior highs before continuing higher.
This high-ranked leader in the Retail - Major Discount Chains group's last appearance in this FSU section was on 8/30/11, as it hit a new 52-week high with a 3rd consecutive gain, and an annotated weekly graph was included under the headline, "Smart Investors May Reconsider Rallying Retailer". Its strong finish with +79% above average volume then helped it clear a "square box" base formed over the prior 5 weeks. Its resilience and renewed strength had prompted its return to the Featured Stocks list, while it had been slumping below its 50-day moving average (DMA) line when last noted on 8/08/11 as it was dropped from the Featured Stocks list. Not long before then, in the 7/29/11 mid-day report (read here) it was first highlighted in yellow because of an advanced "3-weeks tight" type pattern.
PSMT now faces no resistance due to overhead supply. Its small supply (S criteria) of only 17.9 million shares in the publicly traded float can contribute to greater volatility in the event of institutional buying or selling. Disciplined investors avoid chasing stocks extended more than +5% above prior chart highs, and they always limit losses by selling if any stock falls more than -7% from their purchase price.
The number of top-rated funds owning its shares rose from 199 in Sept '10 to 236 in Jun '11, which is a reassuring sign concerning the I criteria of the fact-based investment system. Recent quarterly comparisons (C criteria) show earnings increases above the +25% guideline versus the year earlier and slow sequential acceleration in its sales revenues increases. Its annual earnings (A criteria) growth rate has been strong and steady. Regular readers may have seen prior reference to blue triangles beside the yearly earnings numbers in each year from 2005-2009 on the chart below which indicate pre-tax, non-recurring items were included (where possible, such items are normally removed to provide data better suited for comparison).
|
|
|
Color Codes Explained :
Y - Better candidates highlighted by our
staff of experts.
G - Previously featured
in past reports as yellow but may no longer be buyable under the
guidelines.
***Last / Change / Volume data in this table is the closing quote data***
Symbol/Exchange
Company Name
Industry Group |
PRICE |
CHANGE
(%Change) |
Day High |
Volume
(% DAV)
(% 50 day avg vol) |
52 Wk Hi
% From Hi |
Featured
Date |
Price
Featured |
Pivot Featured |
|
Max Buy |
ATHN
-
NASDAQ
Athenahealth Inc
DIVERSIFIED SERVICES - Business/Management Services
|
$66.79
|
+1.15
1.75% |
$67.87
|
1,211,697
169.82% of 50 DAV
50 DAV is 713,500
|
$66.00
1.20%
|
9/8/2011
|
$61.93
|
PP = $61.78
|
|
MB = $64.87
|
 Most Recent Note - 9/14/2011 6:00:39 PM
G - Posted a second consecutive gain today with above average volume for another new all-time high, getting more extended from its prior base. Disciplined investors use a tactic called "pyramiding" to avoid chasing stocks more than +5% above prior highs. Always minimize losses by selling if any stock falls -7% from their buy point.
>>> The latest Featured Stock Update with an annotated graph appeared on 9/8/2011. Click here.
View all notes |
Alert me of new notes |
CANSLIM.net Company Profile |
SEC |
Zacks Reports |
StockTalk |
News |
Chart |
Request a new note
C
A N
S L
I M


|
DMND
-
NASDAQ
Diamond Foods Inc
FOOD and; BEVERAGE - Processed and; Packaged Goods
|
$76.47
|
+0.49
0.64% |
$76.79
|
256,218
118.78% of 50 DAV
50 DAV is 215,700
|
$80.16
-4.60%
|
9/13/2011
|
$75.57
|
PP = $80.16
|
|
MB = $84.17
|
Most Recent Note - 9/13/2011 7:28:00 PM
Y - Posted a small gain today with above average volume. Subsequent gains with heavy volume above the new pivot point cited based on its 8/31/11 high may trigger a technical buy signal. It was featured in yellow in today's mid-day report while perched -5.8% off its 52-week high and consolidating above support at its 50 DMA line. It found support well above its 200 DMA line as it formed a cup-with-handle type base following its ascent since previously noted 4/05/11 news it was buying Procter & Gamble's Pringles. Strong earnings history in recent years (A criteria). Earnings rose +73% on +61% sales revenues in the quarter ended April 30, 2011 versus the year ago period. The Dec '10 quarter also showed strong increases, but quarterly earnings were reported at -24% for the Oct '10 period, a flaw in its otherwise impressive earnings history. Small supply of only 22 million outstanding shares (S criteria) could contribute to greater volatility in the event of any institutional maneuvering. See the latest FSU analysis for more details and an annotated weekly graph.
>>> The latest Featured Stock Update with an annotated graph appeared on 9/13/2011. Click here.
View all notes |
Alert me of new notes |
CANSLIM.net Company Profile |
SEC |
Zacks Reports |
StockTalk |
News |
Chart |
Request a new note
C
A N
S L
I M
|
EXLS
-
NASDAQ
Exlservice Holdings Inc
DIVERSIFIED SERVICES - Business/Management Services
|
$22.83
|
-0.18
-0.78% |
$23.05
|
2,742,502
2,509.15% of 50 DAV
50 DAV is 109,300
|
$26.55
-14.01%
|
8/2/2011
|
$24.85
|
PP = $24.85
|
|
MB = $26.09
|
Most Recent Note - 9/14/2011 12:12:59 PM
G - Holding its ground today near its 200 DMA line after pricing its previously noted Secondary Offering at $23.00. News of the offering was followed by a damaging gap down on 9/13/11, and it violated its 50 DMA line, raising concerns and triggering a technical sell signal. It is -13.8% off its 52-week high hit last week, and only a prompt rebound above its short-term average would help its outlook.
>>> The latest Featured Stock Update with an annotated graph appeared on 9/7/2011. Click here.
View all notes |
Alert me of new notes |
CANSLIM.net Company Profile |
SEC |
Zacks Reports |
StockTalk |
News |
Chart |
Request a new note
C
A N
S L
I M
|
FCFS
-
NASDAQ
First Cash Financial Svs
SPECIALTY RETAIL - Specialty Retail, Other
|
$50.89
|
+2.23
4.58% |
$51.62
|
451,137
125.25% of 50 DAV
50 DAV is 360,200
|
$49.13
3.58%
|
5/31/2011
|
$42.00
|
PP = $40.23
|
|
MB = $42.24
|
Most Recent Note - 9/14/2011 3:55:33 PM
G - Spiking to a new all-time high today with above average volume behind its gain. It is extended from its prior base, and its 50 DMA line defines support to watch.
>>> The latest Featured Stock Update with an annotated graph appeared on 9/6/2011. Click here.
View all notes |
Alert me of new notes |
CANSLIM.net Company Profile |
SEC |
Zacks Reports |
StockTalk |
News |
Chart |
Request a new note
C
A N
S L
I M
|
JCOM
-
NASDAQ
J 2 Global Communication
INTERNET - Internet Software and Services
|
$31.61
|
+0.26
0.83% |
$32.09
|
388,652
93.65% of 50 DAV
50 DAV is 415,000
|
$32.64
-3.16%
|
8/8/2011
|
$30.38
|
PP = $29.31
|
|
MB = $30.78
|
Most Recent Note - 9/13/2011 7:33:44 PM
G - Gain today came with better above average volume, finishing -4% off its 52-week high. Previous highs in the $30-31 area define initial chart support to watch.
>>> The latest Featured Stock Update with an annotated graph appeared on 8/29/2011. Click here.
View all notes |
Alert me of new notes |
CANSLIM.net Company Profile |
SEC |
Zacks Reports |
StockTalk |
News |
Chart |
Request a new note
C
A N
S L
I M
|
Symbol/Exchange
Company Name
Industry Group |
PRICE |
CHANGE
(%Change) |
Day High |
Volume
(% DAV)
(% 50 day avg vol) |
52 Wk Hi
% From Hi |
Featured
Date |
Price
Featured |
Pivot Featured |
|
Max Buy |
MA
-
NYSE
Mastercard Inc Cl A
DIVERSIFIED SERVICES - Business/Management Services
|
$337.23
|
+8.37
2.55% |
$338.66
|
1,789,575
124.87% of 50 DAV
50 DAV is 1,433,200
|
$345.13
-2.29%
|
8/3/2011
|
$324.82
|
PP = $322.38
|
|
MB = $338.50
|
Most Recent Note - 9/14/2011 3:58:49 PM
Y - Gain today with above average volume has it perched within -1% of its best ever close. It has been consolidating near important support at its 50 DMA line and above its prior pivot point. A damaging violation of its 50 DMA would raise concerns and may trigger a technical sell signal.
>>> The latest Featured Stock Update with an annotated graph appeared on 9/12/2011. Click here.
View all notes |
Alert me of new notes |
CANSLIM.net Company Profile |
SEC |
Zacks Reports |
StockTalk |
News |
Chart |
Request a new note
C
A N
S L
I M
|
MG
-
NYSE
Mistras Group Inc
DIVERSIFIED SERVICES - Bulding and Faci;ity Management Services
|
$20.15
|
+0.04
0.20% |
$20.39
|
126,607
70.77% of 50 DAV
50 DAV is 178,900
|
$20.82
-3.22%
|
8/10/2011
|
$17.89
|
PP = $17.58
|
|
MB = $18.46
|
Most Recent Note - 9/13/2011 7:36:22 PM
G - Still holding its ground stubbornly near its 52-week high. Prior resistance in the $18 area and its 50 DMA line define important chart support to watch on pullbacks.
>>> The latest Featured Stock Update with an annotated graph appeared on 9/9/2011. Click here.
View all notes |
Alert me of new notes |
CANSLIM.net Company Profile |
SEC |
Zacks Reports |
StockTalk |
News |
Chart |
Request a new note
C
A N
S L
I M
|
MKTX
-
NASDAQ
Marketaxess Holdings Inc
FINANCIAL SERVICES - Investment Brokerage - Nationa
|
$29.73
|
+0.35
1.19% |
$30.19
|
166,028
64.40% of 50 DAV
50 DAV is 257,800
|
$30.95
-3.94%
|
7/29/2011
|
$25.87
|
PP = $26.35
|
|
MB = $27.67
|
Most Recent Note - 9/13/2011 7:39:07 PM
G - Reversed late day and finished near the session low with its second loss on above average volume in the span of 3 sessions, action indicative of distributional pressure. It has been noted as extended from its prior base. Prior resistance in the $26 area and its 50 DMA line define important chart support to watch.
>>> The latest Featured Stock Update with an annotated graph appeared on 9/2/2011. Click here.
View all notes |
Alert me of new notes |
CANSLIM.net Company Profile |
SEC |
Zacks Reports |
StockTalk |
News |
Chart |
Request a new note
C
A N
S L
I M
|
PSMT
-
NASDAQ
Pricesmart Inc
RETAIL - Drug Stores
|
$72.64
|
+2.90
4.16% |
$73.19
|
508,282
175.21% of 50 DAV
50 DAV is 290,100
|
$69.76
4.13%
|
8/30/2011
|
$63.01
|
PP = $62.37
|
|
MB = $65.49
|
Most Recent Note - 9/14/2011 12:24:37 PM
G - Rallying even higher today, on track for a 7th consecutive gain backed by above average volume, getting more extended from its prior base. Prior highs and its 50 DMA line define support levels to watch on pullbacks.
>>> The latest Featured Stock Update with an annotated graph appeared on 9/14/2011. Click here.
View all notes |
Alert me of new notes |
CANSLIM.net Company Profile |
SEC |
Zacks Reports |
StockTalk |
News |
Chart |
Request a new note
C
A N
S L
I M
|
|
|
|
THESE ARE NOT BUY RECOMMENDATIONS!
Comments contained in the body of this report are technical
opinions only. The material herein has been obtained
from sources believed to be reliable and accurate, however,
its accuracy and completeness cannot be guaranteed.
This site is not an investment advisor, hence it does
not endorse or recommend any securities or other investments.
Any recommendation contained in this report may not
be suitable for all investors and it is not to be deemed
an offer or solicitation on our part with respect to
the purchase or sale of any securities. All trademarks,
service marks and trade names appearing in this report
are the property of their respective owners, and are
likewise used for identification purposes only.
This report is a service available
only to active Paid Premium Members.
You may opt-out of receiving report notifications
at any time. Questions or comments may be submitted
by writing to Premium Membership Services 665 S.E. 10 Street, Suite 201 Deerfield Beach, FL 33441-5634 or by calling 1-800-965-8307
or 954-785-1121.
|
|
|

